Monitoring International Trade by Dr. Ziva Rozen-Bakher For the Year 2024
https://www.rozen-bakher.com/monitoring-international-trade/2024
Published Date: 14 August 2026
COPYRIGHT ©2026 ZIVA ROZEN-BAKHER ALL RIGHTS RESERVED
Rozen-Bakher, Z, Monitoring International Trade by Dr. Ziva Rozen-Bakher For the Year 2024, Monitoring International Trade by Dr. Ziva Rozen-Bakher, https://www.rozen-bakher.com/monitoring-international-trade/2024
Monitoring International Trade by Dr. Ziva Rozen-Bakher
Monitoring International Trade by Dr. Ziva Rozen-Bakher: Annual Analysis of Exports, Imports, Trade Balance, and Top Trade Partners at the Country Level and at the Multilateral Trade Alliances Level through the Global Political Power Rank vs Global Market Size Rank
Rozen-Bakher, Z. Monitoring International Trade by Dr. Ziva Rozen-Bakher https://www.rozen-bakher.com/monitoring-international-trade

Dr. Ziva Rozen-Bakher
Researcher in International Relations and Foreign Policy with a Focus on Risks for Foreign Direct Investment (FDI) and International Trade: International Security, Political, and Economic Risks
Monitoring International Trade by Dr. Ziva Rozen-Bakher For the Year 2024
List of Contents
Section 1. Why Do We Need Global Political Power Rank versus Global Market Size Rank to Monitor International Trade?
Section 1.1 International Trade: Mercantilism versus Comparative Competitive Advantages
Section 1.2 Top Export/Import Partner of a Country versus Global Top Export/Import Partner of Many Countries
Section 1.3 Research Model of ‘Monitoring International Trade by Dr. Ziva Rozen-Bakher’
Section 1.3.1 Global Political Power Rank versus Global Market Size Rank
Section 1.3.2 Geopolitical Factor: Region, Religion, Sovereignty Status, Limited International Recognition, New International Economic Order, Decolonialism, Multilateral Alliances, Foreign Military Presence, Sanctions, Involvement in Wars
Section 1.3.3 Global Survival Rank (GSR) by Dr. Ziva Rozen-Bakher
Section 1.3.4 Government Policy: Trade Policy and Labour Market Policy
Section 2. Methodology
Section 2.1 Home Country Characteristics as Independent Variables
Section 2.2 International Trade as Dependent Variables
Section 2.3 Geopolitical Factors as Moderating Variables: Region, Religion, Sovereignty Status, Limited International Recognition, New International Economic Order, Decolonialism, Multilateral Alliances, Foreign Military Presence, Sanctions, Involvement in Wars
Section 2.4 Global Survival Rank (GSR) as Moderating Variable for two Geopolitical factors: Sanctions and Involvement in Wars
Section 2.5 Government Policy: Trade Policy and Labour Market Policy
Section 2.5.1 Trade Policy as a Moderating Variable
Section 2.5.2 Labour Market Policy as an Antecedent Variable for Strategic Assets
Section 3. Results
Section 3.1 Highlights
Section 3.2 Analysis of Global Top Partners of Exports and Imports in 2024 - Global Political Power Rank versus Global Market Size Rank: All UN Members and Non-UN Members
Section 3.3 Analysis of Top Partners of the Home Country versus Global Top Partners in 2024: All UN Members and Non-UN Members
Section 3.3.1 Analysis of Top Import Partners of the Home Country versus Global Top Import Partners
Section 3.3.2 Analysis of Top Export Partners of the Home Country versus Global Top Export Partners: All UN Members and Non-UN Members
Section 3.3.3 In which Countries the Country is the Top 1/Top 2/Top 3 Import Partner, sorted by Global Top 1/Top 2/Top 3 Import Partner, Higher to Lower: All UN Members and Non-UN Members
Section 3.3.4 In which Countries the Country is the Top 1/Top 2/Top 3 Export Partner, sorted by Global Top 1/Top 2/Top 3 Export Partner, Higher to Lower: All UN Members and Non-UN Members
Section 3.4. Analysis of International Trade Balance, Total Exports and Total Imports in 2024: All UN Members and Non-UN Members
Section 3.4.1 Comparison of International Trade Balance in 2024: All UN Members and Non-UN Members
Section 3.4.2 Comparison of Total Imports in 2024: All UN Members and Non-UN Members
Section 3.4.3 Comparison of Total Exports in 2024: All UN Members and Non-UN Members
Section 3.5 The Impact of the Geopolitical Position Factors on International Trade
Section 3.5.1 The Impact of Region on International Trade: All UN Members and Non-UN Members
Section 3.5.2 The Impact of Religion on International Trade: All UN Members and Non-UN Members
Section 3.5.3 The Impact of Sovereignty Status on International Trade: All UN Members and Non-UN Members
Section 3.5.4 The Impact of Limited International Recognition on International Trade: All UN Members and Non-UN Members
Section 3.5.5 The Impact of the Attitude towards the New International Economic Order on International Trade: Countries with UN Vote Right
Section 3.5.6 The Impact of Decolonialism on International Trade: All UN Members and Non-UN Members
Section 3.5.7 The Impact of Multilateral Trade Alliances (Free Trade Agreements (FTAs)) and Multilateral Military Alliances on International Trade: All UN Members and Non-UN Members
Section 3.5.8 The Impact of Foreign Military Presence on International Trade: All UN Members and Non-UN Members
Section 3.5.9 The Impact of Sanctions on International Trade: All UN Members and Non-UN Members
Section 3.5.10. The Impact of Involvement in Wars, Occupations, and Military Conflicts on International Trade: All UN Members and Non-UN Members
Section 3.6. Global Survival Rank (GSR) as a Moderator for Two Geopolitical Factors: Sanctions and Involvement in Wars
Section 3.6.1 The Impact of Sanctions on International Trade: Global Survival Rank (GSR) as a Moderator
Section 3.6.2 The Impact of Involvement in Wars, Occupations, and Military Conflicts on International Trade: Global Survival Rank (GSR) as a Moderator
Section 3.7. The Impact of Market Size versus Comparative Competitive Advantages on International Trade
Section 3.7.1 The Impact of Market Size on International Trade: Population Size and the Level of GDP per Capita
Section 3.7.2 The Impact of Comparative Competitive Advantages on International Trade: Labour Costs, Strategic Assets, and Natural Resources
Section 3.8. The Impact of the Government Policy on International Trade: Trade Policy and Labour Market Policy
Section 4. Analysis of the Results: Comparison between China, USA and Germany - Why China and Germany have the Best Positive Trade Balance, while the USA has the Worst Negative Trade Balance?
Section 5. Policy Recommendations
Section 6. Methodological Notes
Section 7. List of Citations by the Number of Citation
Section 8. Blog on Foreign Direct Investment (FDI) and International Trade by Dr. Ziva Rozen-Bakher: All UN Members and Non-UN Members, sorted by Alphabetical Order
Section 9. Relevant Items From the Research Projects of Dr. Ziva Rozen-Bakher
Section 10. Recommended Reading from the Scientific Literature
List of Tables
Table A. Total of Exports/Imports in 2024 relative to Global Top Export/Import Partners in 2024: China, USA, and Germany, Section 1.2
Table B. Population versus GDP per Capita relative to International Trade Balance: The cases of China vs India, Germany vs USA, Liechtenstein vs San Marino, and Eritrea vs Central African Republic, Section 1.3
Table C. Comparison of Russia vs Ukraine: Indicators (R1-R7) of Global Survival Rank (GSR), GSR 2023 - GSR 2025, Section 1.3.3
Table D. All indicators included in the Results Tables 1-26: Each Indicator by Each Table, Section 2
Table E. Top Export Global Partners vs Top Import Global Partners: China, United States, and Germany, sorted by the Global Rank of International Trade Balance, Section 4
Table F. The Impact of Location Factors on FDI via Long-Run Multiple Regression, Years 1992-2007, 191 UN Members, Section 4
Table G. International Trade Data Notes: All UN Members and Non-UN Members, sorted by Alphabetical Order, Section 6
Table 1. Global Top Partners of Exports and Imports: All UN Members and Non-UN Members, sorted by Global Political Power Rank, Section 3.2
Table 2. Global Top Partners of Exports and Imports: All UN Members and Non-UN Members, sorted by Global Market Size Rank, Section 3.2
Table 3. Global Top Partners of Exports and Imports: All UN Members and Non-UN Members, sorted by Alphabetical Order, Section 3.2
Table 4. Top Import Partners of the Home Country versus Global Top Import Partners: All UN Members and Non-UN Members, sorted by Global Political Power Rank, Section 3.3.1
Table 5. Top Import Partners of the Home Country versus Global Top Import Partners: All UN Members and Non-UN Members, sorted by Alphabetical Order, Section 3.3.1
Table 6. Top Export Partners of the Home Country versus Global Top Export Partners: All UN Members and Non-UN Members, sorted by Global Market Size Rank, Section 3.3.2
Table 7. Top Export Partners of the Home Country versus Global Top Export Partners: All UN Members and Non-UN Members, sorted by Alphabetical Order, Section 3.3.2
Table 8. In which Countries the Country is the Top 1/Top 2/Top 3 Import Partner, sorted by Global Top 1/Top 2/Top 3 Import Partner, Higher to Lower, Section 3.3.3
Table 9. In which Countries the Country is the Top 1/Top 2/Top 3 Export Partner, sorted by Global Top 1/Top 2/Top 3 Export Partner, Higher to Lower, Section 3.3.4
Table 10. International Trade Balance: All UN Members and Non-UN Members with a Positive International Trade Balance, sorted from Higher to Lower, Section 3.4.1
Table 11. International Trade Balance: All UN Members and Non-UN Members with a Negative International Trade Balance, sorted from Higher to Lower, Section 3.4.1
Table 12. Total Imports in 2024: All UN Members and Non-UN Members, sorted from Higher to Lower, Section 3.4.2
Table 13. Total Exports in 2024: All UN Members and Non-UN Members, sorted from Higher to Lower, Section 3.4.3
Table 14. Geopolitical Position Factors: All UN Members and Non-UN Members, sorted by Alphabetical Order, Section 3.5
Table 15. Average of International Trade in 2024 by Region, sorted by the Average of International Trade Balance in 2024, Section 3.5.1
Table 16. Average of International Trade in 2024 by Main Religion, sorted by the Average of International Trade Balance in 2024, Section 3.5.2
Table 17. Average of International Trade in 2024 by Main Religious Denomination, sorted by the Average of International Trade Balance in 2024, Section 3.5.2
Table 18. Average of International Trade in 2024 by the Categories of Limited International Recognition, sorted by the Average of International Trade Balance in 2024, Section 3.5.4
Table 19. The Impact of Multilateral Trade/Military Alliances on International Trade, sorted by the Total of International Trade Balance in 2024, Section 3.5.7
Table 20. The Impact of the Sanctions against Russia on International Trade: Comparison between Home Countries that Imposed Sanctions on Russia versus Home Countries that did not impose sanctions on Russia, Sorted by International Trade Balance, Section 3.5.9
Table 21. The Impact of Involvement in Wars, Occupations, and Military Conflicts in 2024 on the International Trade, sorted by International Trade Balance in 2024, Section 3.5.10
Table 22. Countries Under Sanctions - Russia, Iran, Afghanistan, Cuba, and North Korea - Comparison of 2025 Global Survival Rank (GSR) versus the Rank of International Trade Balance, Sorted by 2025 Global Survival Rank (GSR), Section 3.6.1
Table 23. Countries Under Sanctions - Russia, Iran, Afghanistan, Cuba, and North Korea - Comparison of the Indicators (R1-R7) of 2025 Global Survival Rank (GSR), Sorted by 2025 Global Survival Rank (GSR), Section 3.6.1
Table 24. Involvement in Wars in 2024 - All UN Members and Non-UN Members: Positive International Trade Balance vs Negative International Trade Balance in 2024, sorted by 2025 Global Survival Rank (GSR), Section 3.6.2
Table 25. Involvement in Wars in 2024 - Russia, Iran, Ukraine, and Israel - Comparison of 2025 Global Survival Rank (GSR) versus the Rank of International Trade Balance, Sorted by 2025 Global Survival Rank (GSR), Section 3.6.2
Table 26. Involvement in Wars in 2024 - Russia, Iran, Ukraine, and Israel - Comparison of the Indicators (R1-R7) of 2025 Global Survival Rank (GSR), Sorted by 2025 Global Survival Rank (GSR), Section 3.6.2
Table 27. Market Size versus Comparative Competitive Advantages: All UN Members and Non-UN Members, sorted by Alphabetical Order, Section 3.7
Table 28. The Impact of Population Size on International Trade, Average by Each Category of Population Size, Section 3.7.1
Table 29. The Impact of GDP per Capita on International Trade, Average by Each Category of GDP per Capita, Section 3.7.1
Table 30. The Impact of Labour Costs on International Trade, Average by Each Category of Labour Costs, Section 3.7.2
Table 31. The Impact of Strategic Assets on International Trade, Average by Each Category of Strategic Assets, Section 3.7.2
Table 32. The Impact of Natural Resources on International Trade: Gas-Proved Reserves and Oil-Proved Reserves, Average by Each Category of Gas and Oil, Section 3.7.2
Table 33. Government Policy - Trade Policy and Labour Market Policy: All UN Members and Non-UN Members, sorted by Alphabetical Order, Section 3.8
Table 34. The Impact of Trade Policy on International Trade, Average by Each Category of Trade Policy, Section 3.8
Table 35. The Impact of Labour Market Policy on Strategic Assets, Average by Each Category of Labour Market Policy, Section 3.8
List of Charts
Chart A. Global Top Export/Import Partner versus Top Export/Import Partner: Global Political Power Rank versus Global Market Size Rank, Section 1.2
Chart B. Research Model of ‘Monitoring International Trade by Dr. Ziva Rozen-Bakher’, Section 1.3
Chart C. Comparison of Russia vs Ukraine: International Trade Balance in USD for the Years 2020-2024, Section 1.3.3
Chart D. Top Export Global Partners vs Top Import Global Partners for 2024: China, United States, and Germany, Section 4
Chart E. Historical Data on International Trade Balance, 1960-2024: China vs USA vs Germany, Section 4
Chart F. The ‘Domino Effect’ of the Lack of Comparative Competitive Advantages on Falling into the Trap of a Negative International Trade Balance versus the Positive Long-Term Impact of Comparative Competitive Advantages on Creating a Positive International Trade Balance, Section 4
Chart G. Global Vehicle Production, Market Share by Leading Countries, 1950-2023, Section 4
Chart H. Detroit Population, 1925-2020, Section 4
Chart I. Historical Data on Strategic Assets, 1996-2023: China vs USA vs Germany, Section 4
Chart J. Top 15 Home Countries with the Highest Strategic Assets, Section 4
Chart K. The Impact of Sanctions Against Russia on the Change in International Trade Balance of Each EU Country, 27 EU Countries, 2020-2024, Section 4
Chart L. Historical Data on Labour Market Policy, 1925-2026: China vs USA vs Germany, Section 4
Chart M. The Impact of the Significant Geopolitical Factors on International Trade Balance in 2024: China vs USA vs Germany, Section 4
Chart 1. Top 20: Positive International Trade Balance versus Negative International Trade Balance, Section 3.1
Chart 2. Top 20: Global Political Power Rank versus Global Market Size Rank, Section 3.1
Chart 3. Top 20: Global Top 1 Import Partner versus Global Top 1 Export Partner, Section 3.1
Chart 4. Comparison of International Trade Balance in 2024 among Multilateral Trade/Military Alliances, Section 3.1
Chart 5. The Impact of the Region on Exports, Average of the Total Exports in 2024, Section 3.5.1
Chart 6. The Impact of the Sovereignty Status on International Trade, Section 3.5.3
Chart 7. Average of International Trade Balance in 2024 by the Vote (Favour/Against) of UN Resolution on New International Economic Order, Section 3.5.5
Chart 8. Average of International Trade Balance in 2024 by the Vote of UN Resolution on Decolonialism, Section 3.5.6
Chart 9. Average of International Trade Balance in 2024 by Colonialism versus Decolonialism, Section 3.5.6
Chart 10. Average of International Trade Balance in 2024 by Foreign Military Presence, Section 3.5.8
Chart 11. International Trade Balance in 2024: Home Countries with Foreign Military Presence with above 7 Military Bases and Installations in Host Countries, Section 3.5.8
List of Maps
Map 1. Global Political Power - Top 1 Import Partner: China vs USA vs Germany, Section 3.1
Map 2. Global Market Size - Top 1 Export Partner: USA vs China vs Germany, Section 3.1
Map 3. Global Political Power - China as a Top Import Partner: Top 1, Top 2, Top 3, Section 3.1
Map 4. Global Political Power - USA as a Top Import Partner: Top 1, Top 2, Top 3, Section 3.1
Map 5. Global Political Power - Germany as a Top Import Partner: Top 1, Top 2, Top 3, Section 3.1
Map 6. Results of UN Vote on New International Economic Order by UN Members, Section 3.5.5
Map 7. Results of UN Vote on Decolonialism by UN Members, Section 3.5.6
List of Documents
Document I. Article 6 on Security From the USA-Jordan Defense Cooperation Agreement about the USA’s Foreign Military Presence in Jordan, Section 1.3.2
Section 1.
Why Do We Need Global Political Power Rank versus Global Market Size Rank to Monitor International Trade?
Section 1.1 International Trade: Mercantilism versus Comparative Competitive Advantages
The Trade-War that erupted by Trump following his ‘Reciprocal Tariff’ policy (Cite 1 and Cite 2) has renewed the discussion about which Prescriptive Theory of International Trade gives the right way to increase the International Trade of a country, and in particular, the exports, because the exports of the country should be higher compared to the Imports to create a Positive International Trade Balance. In my research paper titled: Rozen-Bakher, Z. "Are Multinational Enterprises’ (MNEs) Theories explained the reality of Foreign Direct Investment (FDI) and International Trade in the 21st Century?." (Cite 3), I presented and discussed all the important International Trade theories, but If we look at these theories from the current Trade-War perspective, then there are two opposite theories that are implemented by two superpowers: The 'Mercantilism Theory' by the USA versus the 'Comparative Competitive Advantages Theory' by China (Cite 4).
The Mercantilism Theory (Cite 3 and Cite 5) gives a "recipe" on how the country should increase its wealth by maximising the Exports along with minimising the Imports, namely "to sell more to foreigners during a year than we buy from them in terms of value" (Cite 5), resulting in a Positive International Trade Balance. Thus, the Mercantilism reflects a "zero-sum game" in which increasing the wealth of one country occurs at the expense of the wealth of a second country. According to Mercantilism, there are four main ways to create a Positive International Trade Balance, as follows (Cite 3 and Cite 5): i) Providing Government Subsidies to local companies to encourage Exports, with the aim of selling the products at lower prices in host markets compared to the higher prices without government subsidies. However, many Free Trade Agreements (FTAs), including those under the WTO, do not allow subsidisation, so many governments bypass this restriction by providing 'Grants' to local firms, which are de-facto Government Subsidies. ii) Imposing Import Restrictions on imported products through taxes, tariffs and quotas to ensure that the prices of imported products are less competitive compared to the prices of local products, with the aim of providing an advantage to the consumption of local products over imported products, resulting in achieving minimal imports to create a Positive International Trade Balance. iii) Limiting consumption outside the country and encouraging local savings to prevent the outflow of funds from the home country to host countries, such as the 'Exit Tax' when a person stops being a tax-resident in a country or even the 'Exit Tourism Tax' when a person travels abroad (outgoing tourism) to prevent "unnecessary" spending of local money in foreign countries. Note, outgoing tourism is considered an import, while incoming tourism is considered an export. iv) Imperialism and Colonialism, which is done by the occupation of host territories to establish Colonies to obtain cheap natural resources and low-cost production. Thereby, the sovereign state maximises the Positive International Trade Balance through colonialism by imposing the following regulations: First, Production Restrictions to gain control over the colony's production for the exclusive benefit of the home country. Second, Trade Restrictions to prevent the colonies from trading with other colonies or other countries without the involvement of the sovereign state. Third, Price Restrictions to achieve lower prices for exports when the sovereign state buys from the Colony, while higher prices for imports when the colony buys from the sovereign state. In other words, the sovereign state purchased products and raw materials from the colonies at lower prices than the real value of the products and raw materials, while the colonies purchased products and raw materials from the sovereign state at exorbitant prices, namely at higher prices than the real value of the products and raw materials. Considering that, Trump's policy of "America First" is based on the principles of the Mercantilism Theory, namely the USA tries to force UN Members or Non-UN Members via economic pressure (e.g., Canada (Cite 6) or even by military means and blockade (e.g., Greenland (Cite 7), Venezuela (Cite 8), Iran (Cite 9), Cuba (Cite 10) to become, formally or informally, colonies of the USA in order to takeover on their natural resources, mainly oil and gas. If we look at the Compacts of Free Association (COFA) (Cite 11) that the USA has with Micronesia, the Marshall Islands, and Palau, then these UN Members are de-facto run like Colonies of the USA, so the model of COFA represents a New-Colonialism, namely UN Members that are de-facto under the control of another sovereign state. Regardless of the New-Colonialism, the USA still has far-distance Colonies (Cite 12 and Cite 13) (e.g., Guam and the Northern Mariana Islands) that some of them even became Non-Contiguous States of the USA (e.g., Alaska (Cite 14 and Hawaii (Cite 15), with a prospect for others (e.g., Puerto Rico (Cite 16), but despite that, there are Colonies among them with an aspiration for Independence (e.g., Hawaii (Cite 15). Importantly, even the Foreign Military Presence in host countries reflects Military Imperialism and even New-Military-Colonialism. The USA has 853 Military Bases and Installations around the globe, and in some UN Member countries, the USA has countless Military Bases and Installations, such as 101 Military Bases and Installations in Japan and 75 in South Korea, which is even more than in the Colony of the USA, Guam, that has 52 Military Bases and Installations (Cite 17), so Japan and South Korea can be considered as Military-Colonies of the USA because the USA has full control over the military aspect of these UN members, including their arms trade.
However, the 'Comparative Competitive Advantages Theory' (Cite 3) is an opposite Prescriptive Theory, which is implemented by China. David Ricardo, in his book "On the Principles of Political Economy and Taxation" (Cite 18), argued that restrictions and barriers in relation to international trade should be removed to increase the output and efficiency at the global level. Hence, if each country creates expertise in a few fields but trades with other countries in its non-expertise fields, then it may increase the output and efficiency at the global level (Cite 3). That's based on the idea that countries differ from each other in their production efficiency and how they utilise their resources, so each country should produce a large number of products that they are able to produce more effectively, while each country should purchase products from other countries when it's less effective to produce these products locally (Cite 18). Importantly, each country should have expertise in fewer fields to create Comparative Competitive Advantages, which can be achieved by importing products from other countries even if the country can produce these products more effectively than other countries (Cite 3 and Cite 18). Hence, according to Ricardo, each country should prioritise its production by producing only products with a Comparative Competitive Advantage, which is supposed to contribute to professionalisation and specialisation. That's based on the rationale that when a country splits its resources across too many fields, it may undermine the country's expertise in some fields. In contrast, when a country focuses on only a few fields, it may increase its expertise in those fields.
Nevertheless, according to the early classical international trade theories, such as the Absolute Advantage Theory of Adam Smith and the Factor Proportions Theory, the availability and quality of a country's natural resources, such as oil, agricultural products, and minerals, explain the Absolute Advantage of the country (Cite 3), but according to the 'Comparative Competitive Advantages Theory' of Ricardo, each country should prioritise its production based on its Comparative Advantage, rather than based on its Absolute Advantage, so even if a country lacks an Absolute Advantage in natural resources, then the 'Comparative Competitive Advantages` can be achieved by professionalisation and specialisation of the human resources, such as the creation of Strategic Assets (e.g., Patents and Technological assets) (Cite 30), which can lead to expertise in specific areas, resulting in competitive products at the global level. For example, even if a country has an Absolute Advantage in certain agricultural products, then the country may gain 'Comparative Competitive Advantages' by the creation of Biotech or High-tech industries, because High-tech products may have a greater market value than fruits, which may be explained why employment in many advanced countries has shifted from agriculture to manufacturing and service industries (Cite 30).
Considering the above, if we look at China, then China over the last two decades has implemented the 'Comparative Competitive Advantages Theory' of Ricardo by creating expertise in solutions of Infrastructure (e.g., Buildings, Ports, Bridges, and Transportation) and recently, China has started to create expertise in Humanoid-Robotics. Importantly, in contrast to the USA, China does not have any Colonies/New-Colonies nor any significant Foreign Military Presence (Only 2 bases around the globe) (Cite 17). Besides, China does not impose any restrictions on trade in the style of Trump nor sanctions against other countries or courts like the USA, such as the USA’s sanctions against the International Criminal Court (ICC) (Cite 19 and Cite 20). Besides, China does not act in ‘Double-Standards’ like the USA (Cite 21) (e.g., the USA's complicity in the Israeli Genocide in Gaza (Cite 22)) nor as the ‘World Military Police’ like the USA (Cite 21), such as the recent USA-Israel attack against Iran due to peaceful nuclear (Cite 23), while the USA does not attack other countries despite that they have nuclear weapons (e.g., Pakistan, India, North Korea and more) (Cite 24 and Cite 25), and recently, Trump even decided to let Saudi Arabia, the neighbouring country of Iran, to have peaceful nuclear if Saudi Arabia agrees to recognise the State of Israel without demanding from Israel before the recognition to end the occupation of Palestine and the Genocide in Gaza and the ethnic cleansing in the West Bank (Cite 26).
Clearly, the USA and China have a dramatic gap in their foreign policies, which significantly affects their international trade. As I mentioned in my Comment from the Risks Timeline titled: " ’Democracy Police’ Under ´Double Standards’: Bad for Preserving USA Superpower" (07 October 2022, Cite 21), "China treats its allies like customers, so from the marketing perspective, China cares about the potential ´sale´ (FDI and export) to their allies and about their ability to ´pay´ (payments and loans). Russia, on the contrary to China, treats its allies like 'fathers and sons', so it is loyal relations in the long-run. However, the USA is a different story. The USA engaged actively in regime transformation into democracy while punishing regimes via sanctions if the regime stopped acting like a democracy, so from the marketing perspective, punishment never helps to preserve customers or to get new customers. Nevertheless, the USA less punishes Western strategic allies for democracy problems, like in the case of Israel, which is perceived as ´double standards, regardless of the democratic problems in the USA due to Trump's behaviour and policy, so paradoxically, the USA pushed many countries into the hands of its ´competitors´, Russia and China, thereby, for many countries, Russia and China are more attractive than the USA". This was reflected in the vote of the UN Resolution on the New International Economic Order (In Favour-123, Against-40, Abstain-1) (Cite 27), so this vote gives a clear indication that most of the countries worldwide (123 countries) would like to replace the economic dominance of the USA with other alternatives, while only 40 countries would like to preserve the economic dominance of the USA. Even the vote of the UN resolution on Decolonialism reflected the split between the ‘Old Order-Mercantilism’ versus the ‘New Order-Decolonialism’ (Cite 28), namely 113 countries voted in-favour of Decolonialism, while 63 countries voted Abstain (Cite 29), but in this vote, the Abstain can be considered as a ‘Soft-Against’, because the Against may be seen as ‘not politically correct'. Keep in mind that worldwide there are still 55 Colonies under 11 sovereign states, including the USA (Cite 13).
Section 1.2 Top Export/Import Partner of a Country versus Global Top Export/Import Partner of Many Countries
In the light of the above, it is crucial to understand which policy – 'Mercantilism' by the USA or 'Comparative Competitive Advantages' by China – has more success in the real world. However, if we look at the current institutions that monitor the International Trade, then it is difficult to get an answer for this question, because all of them are looking at the following main indicators at the country level, such as the total annual Exports/Imports, the International Trade Balance, and the Top Partners of Export/Import that each country has. However, this kind of monitoring can not reveal which country is more powerful in International Trade compared to other countries because it did not take into account in how many countries the home country is the Top Partner compared to other countries, either in Export or in Import. In other words, as shown in Chart A, there is a significant difference between being a Top Export/Import Partner of a certain country versus being a Global Top Export/Import Partner of many countries. Today, all the institutions that are monitoring International trade (e.g., UNCTAD) are looking only at the Top Export/Import Partner of a certain country and not at who the Global Top export/import partners of many countries are.
Chart A. Global Top Export/Import Partner versus Top Export/Import Partner: Global Political Power Rank versus Global Market Size Rank
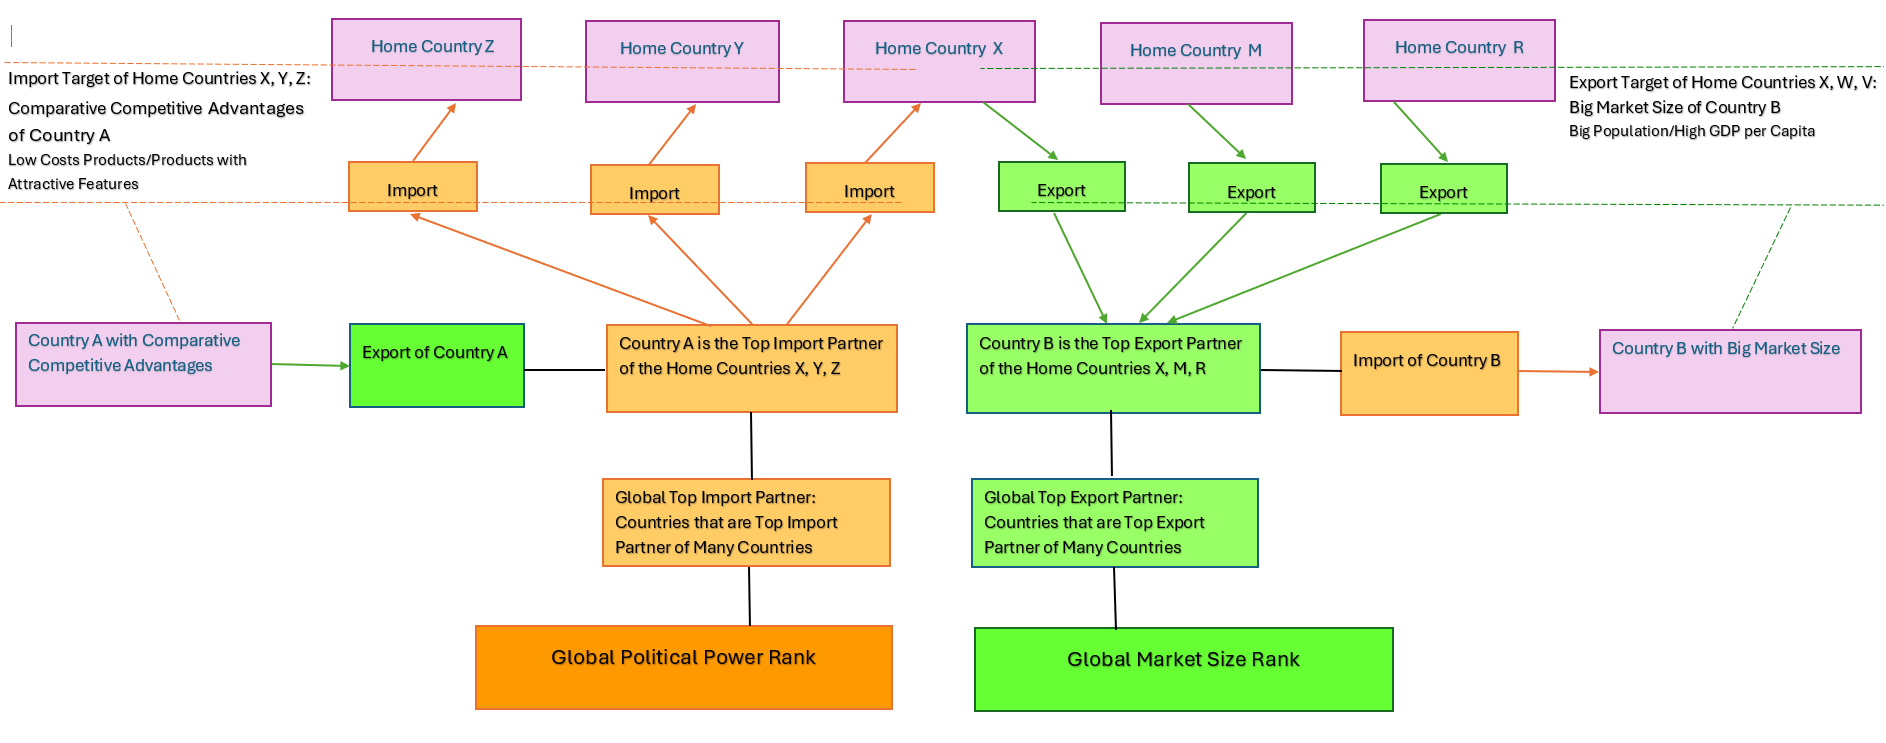
Importantly, there is a big difference between being a Global Top Export Partner versus being a Global Top Import Partner, because it impacts differently the economic growth and the job creation (Cite 30 and Cite 31). Keep in mind that there is a correlation between the impact of Foreign Direct Investment (FDI) and International Trade on the Labour Market, because many Multinational Enterprises (MNEs) relocated their production plants to low-cost countries, with the aim of exporting the products to third countries, yet the attractiveness of the 'Location Factors' of the Host Country determines the scope of the ‘FDI Inward with Export Target’ (Look for of the Eclectic Paradigm of Dunning in Cite 3). Importantly, paradoxically, from the Global Top Partner perspective, many institutions (e.g., UNCTAD) present in their reports only the Top Export Partners and not the Top Import Partners, despite that the Top Export Partners are less important compared to the Top Import Partners, because, as shown in Chart A, if a country is the Top Export Partner of many countries, then it means that the country imports a lot of goods to many countries, while if a country is the Top Import Partner of many countries, then it means that the country exports a lot of goods to many countries. Thus, if we would like to know which country exports goods to the maximum number of countries as their Top Partner, then we should look at the Top Import Partner, rather than at the Top Export Partner. However, keep in mind that there is a difference between a country that has the biggest amount of exports in a certain year but exports only to a few countries versus a country that exports its goods to the maximum number of countries as their Top Import Partner. Nevertheless, if we look at the real data, then usually, there is a correlation between a country that has the biggest Export/Import annual amount and being a Global Top Import/Export Partner, as shown in Table A that presents the cases of China, the USA, and Germany regarding the Volume of Exports/Imports in 2024 relative to the Global Top Export/Import Partners in 2024.
Table A. Total of Exports/Imports in 2024 relative to Global Top Export/Import Partners in 2024: China, USA, and Germany

Section 1.3 Research Model of ‘Monitoring International Trade by Dr. Ziva Rozen-Bakher’
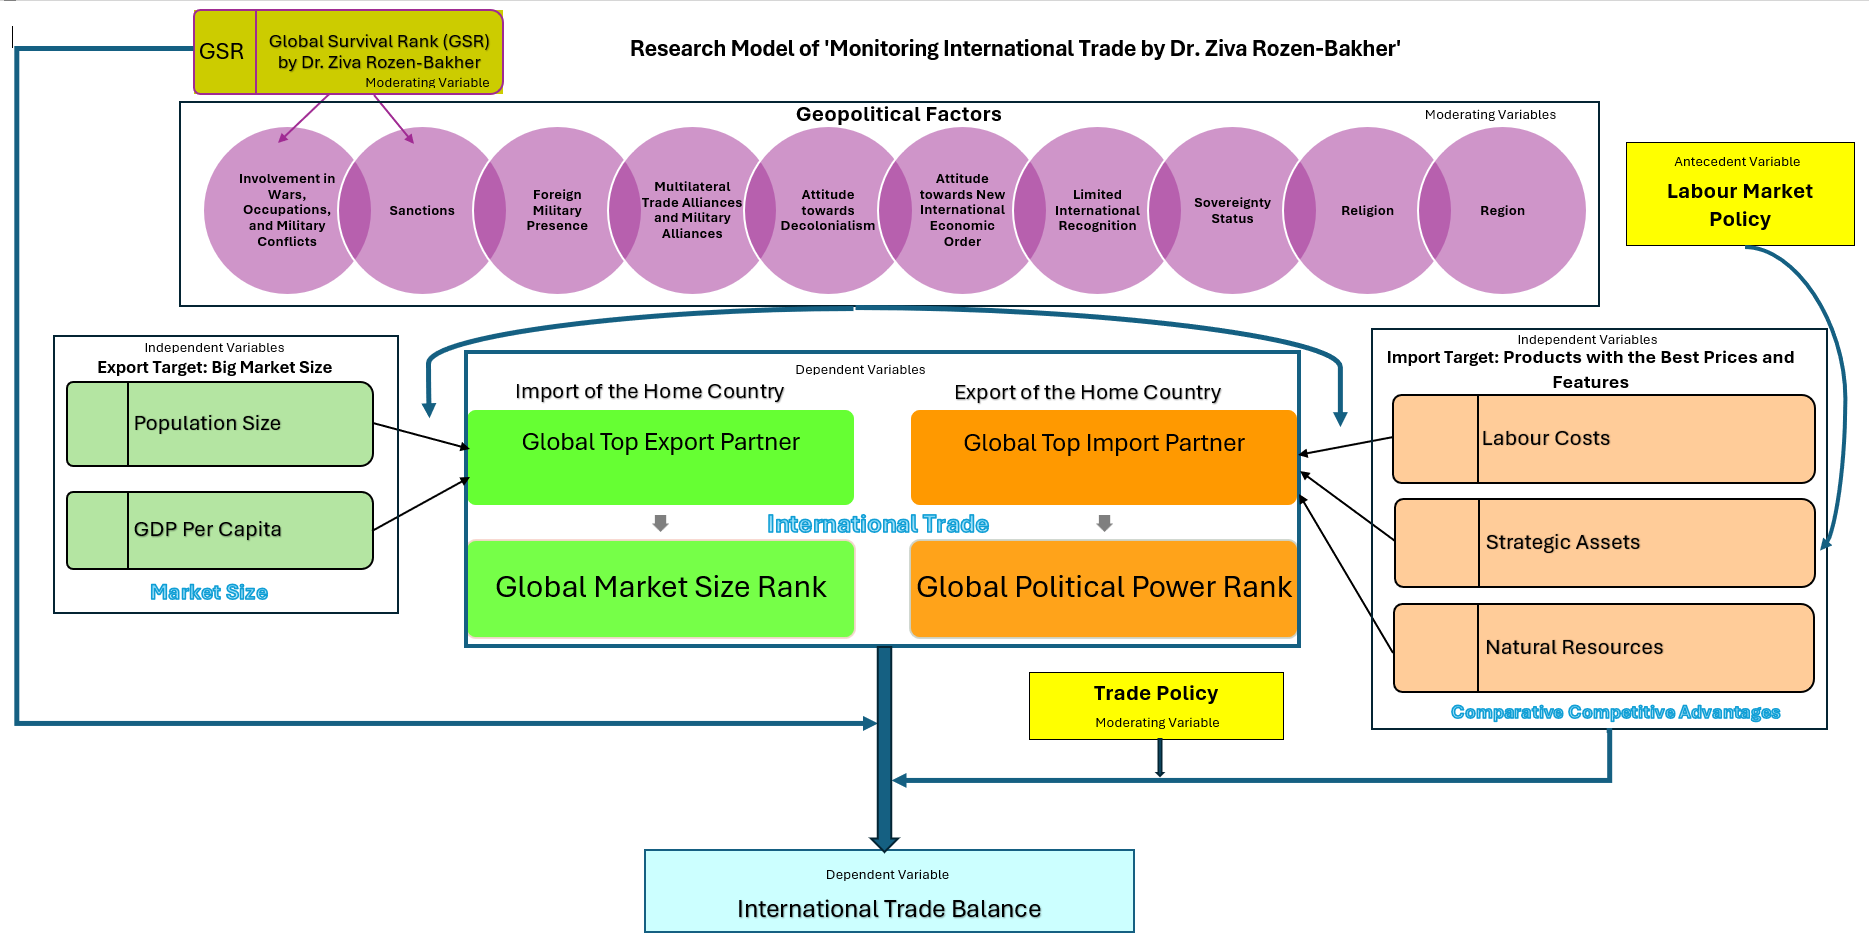
In light of the outlined above, I developed two new ranks – Global Market Size Rank versus Global Political Power Rank – to fill the gaps that were presented in the previous section, as shown in Chart B that presented the Research Model of ‘Monitoring International Trade by Dr. Ziva Rozen-Bakher’, as discussed below.
Chart B. Research Model of ‘Monitoring International Trade by Dr. Ziva Rozen-Bakher’
Section 1.3.1 Global Political Power Rank versus Global Market Size Rank
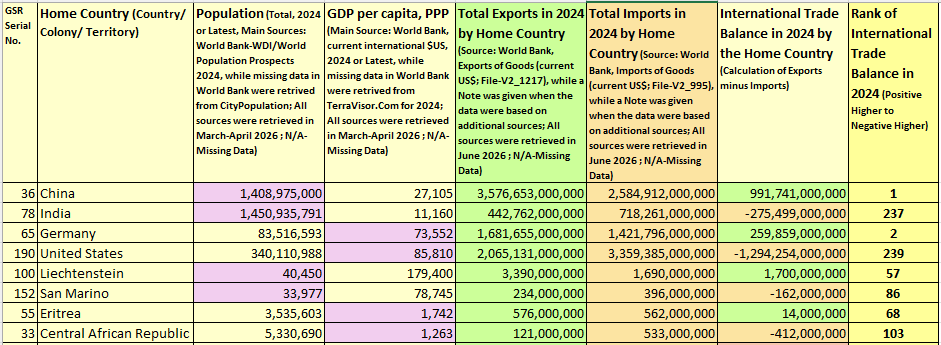
The Market size can be assessed by two crucial indicators: Population Size versus GDP per Capita, as illustrated in Table B that presents the Population versus GDP per Capita relative to the International Trade Balance in the cases of China vs India (Big population with a Mid-GDP per Capita), Germany vs USA (Big population with a High GDP per capita), Liechtenstein vs San Marino (Very Small population with a High GDP per Capita), and Eritrea vs Central African Republic (Small Population with a very Low GDP per Capita). The Population Size signals about the market in terms of quantity, namely if the country is a big one (e.g., China and India are around 1.5 Trillion People) or a small one (e.g., Liechtenstein and San Marino are around 30-40K People), namely if the country has a lot of potential customers and a lot of workers, or vice versa, if the country has limited potential customers and limited workers. However, the GDP per Capita signals about the market in terms of quality, namely if the country has rich customers (e.g., Liechtenstein: 179,400 USD) or, vice versa, poor customers (e.g., Central African Republic: 1,263 USD). Nevertheless, the GDP per Capita also reflects the 'Labour Cost', so countries with a 'Low Labor Cost' usually attract ‘Exported International Production’, namely establishment of Production Sites in the country to export the products to third countries (e.g., China), which positively impacts the ‘Labour Market’ and the Exports, while a 'High Labor Cost' usually leads to the Relocation of Production Sites to Low-Cost Countries, which negatively impacts the 'Labour Market' and the Exports (see Cite 30).
However, the 'Comparative Competitive Advantages of the country' allow maintaining a high volume of exports even if the country has a 'High Labour Cost', yet has Strategic Assets (e.g., Germany), while a 'Low Labour Cost' without sufficient Competitive Advantages unlikely leads to a high volume of Exports (e.g., India). On the contrary, a high GDP per Capita attracts a high volume of Imports, but without sufficient Competitive Advantages for promoting exports, it will lead to a Negative International Trade Balance (e.g., USA), while even a very low GDP per Capita does not promise a Positive International Trade Balance (e.g., Central African Republic) unless the country has sufficient Competitive Advantages (e.g., Eritrea). To summarise, the Comparative Competitive Advantages of the country indicate if the country has the ability to create a Positive International Trade Balance, such as China vs India that both of them have a Big population with Mid-GDP per Capita, but despite it, China has a positive trade, while India has a negative trade. Or Germany vs the USA that both of them have a Big population with a High GDP per Capita, but despite it, Germany has a positive trade, while the USA has a negative trade. Or Liechtenstein vs San Marino that both of them have a Very Small population with a High GDP per Capita, but despite it, Liechtenstein has a positive trade, while San Marino has a negative trade. Or Eritrea vs the Central African Republic that both of them have a Small Population with a very Low GDP per Capita, but despite it, Eritrea has a positive trade, while the Central African Republic has a negative trade.
Table B. Population versus GDP per capita relative to International Trade Balance: The cases of China vs India, Germany vs USA, Liechtenstein vs San Marino, and Eritrea vs Central African Republic
Considering the above, the Global Political Power Rank indicates which countries have the most Comparative Competitive Advantages at the global level, namely which countries are the Global Top Import Partners, while the Global Market Size Rank indicates which countries have the biggest market size in terms of Population and/or GDP per Capita. Therefore, the Global Political Power Rank looks at how many countries the home country is the Top 1/Top 2/Top 3 Import Partner, while the Global Market Size Rank looks at how many countries the home country is the Top 1/Top 2/Top 3 Export Partner. However, each rank takes into account that being the Top 1 Export/Import Partner is more important than being the Top 2 Export/Import Partner, while being the Top 2 Export/Import Partner is more important than being the Top 3 Export/Import Partner, so each rank is based on a Weight Average that gives 50% for Top 1 Export/Import Partner, 35% for the Top 2 Export/Import Partner, and 15% for the Top 3 Export/Import Partner.
Section 1.3.2 Geopolitical Factors:
Region, Religion, Sovereignty Status, Limited International Recognition, New International Economic Order, Decolonialism, Multilateral Alliances, Foreign Military Presence, Sanctions, Involvement in Wars
As shown in Chart B, the Research Model includes ten Geopolitical Factors that each of them can impact the international trade of the country, either in a positive way or in a negative way. In other words, regardless of the Market Size and the Comparative Competitive Advantages of a country, the Research Model assumes that each Geopolitical Factor can impact the direction of the International Trade Balance, namely each Geopolitical Factor can lead to a Positive International Trade Balance or, vice versa, to a Negative International Trade Balance. It also assumes that each Geopolitical Factor can determine whether the country will be a Global Top Partner or not. Hence, this section discusses how each Geopolitical Factor impacts the International Trade, as follows:
Region. The region can affect international trade, especially in cases where the country/colony is located in remote areas, and, in particular, when the country/colony is located on isolated islands, mainly because of the transportation costs, regardless of the high risk of reaching isolated islands when a war erupts, which makes the sea routes unsafe. For example, the region of Oceania (Cite 32) may attract less International Trade compared to Europe due to thetransportation costs, while a problematic region, such as the Middle East (Cite 33), may affect negatively the International trade due to the repeated wars in the region, especially during long wars that hinder the exports of goods, oil, and gas.
Religion. The Main Religion (e.g., Christianity vs. Islam) affects how the country runs (Look for Religious Regime in Cite 40), who the allies of the country are, and to which alliances, blocs, and coalitions the country belongs, which affects the International Trade. Importantly, the Main Religious Denomination (e.g., Catholic vs. Protestant or Sunni vs. Shia) plays an important role in the national culture, which impacts the country at the economic and political levels, including the attitude towards trade and conflicts. For example, Protestantism encourages 'Hard-work' and Capitalism (Cite 34), which may positively affect International Trade, while Hinduism encourages spirituality over materialism (Cite 35), which may negatively affect International Trade. However, the ‘Religion Distance’ (Cite 41) also affects the International Trade, especially when there exists a significant gap in the values and in the ways of life, such as the gap in the lifestyle between Christianity and Islam.
Sovereignty Status. The Sovereignty Status affects significantly the International Trade because of the big difference between a UN member versus a Colony regarding their ability to conduct Exports/Imports freely, namely a Colony acts under the regulations of its sovereign state when it conducts international trade, while a UN member has no such limitation like a Colony. Even a Disputed Country that runs under diplomatic disputes (e.g., Turkish Republic of Northern Cyprus (Cite 66) or, worse, under military conflicts (e.g., North Yemen (Sanaa) Cite 36) has limitations in conducting International Trade.
Limited International Recognition. Limited International Recognition refers to the situation when UN members or UN Observer States do not have recognition from all the UN members due to ongoing conflicts (Cite 63). However, it also refers to the International Recognition of Disputed Countries (Cite 64) in terms of how many UN members or Non-UN members already formally recognised the Self-Declaration of Independence that was made by the Disputed Country (Cite 65), which signals if the Disputed Country has the prospect of becoming an independent country by getting the status of UN Membership or, vice versa, if the dispute between the Disputed country and the sovereign state that claims sovereignty over the territory is going to drag on for a long period. Considering the above, limited International Recognition negatively affects International Trade because it reduces the opportunities for Exports and Imports because those countries that do not recognise a country usually ban the International Trade with the unrecognised country.
Attitude towards the New International Economic Order. The UN Resolution on the New International Economic Order that was brought to a vote by Russia on 14 December 2022 splits the world into two camps: those countries that would like to preserve the economic dominance of the USA or, vice versa, those countries that would like to replace the economic dominance of the USA with other alternatives (Cite 27), which particularly affects the International Trade of the Superpowers: China, the USA, and Russia, and even their big Allies, such as the UK, either positively or negatively.
Attitude towards Decolonialism. The UN Resolution on Decolonialism by granting Independence to Colonies also splits the world into two camps: those countries that would like to preserve the Colonies or, vice versa, those countries that would like to abolish the colonies by granting Independence to the remaining Colonies (Cite 2). This split reflects the transformation from the old era of Colonialism/New Colonialism into the new global order that opposes Colonialism, which impacts significantly the International Trade, such as the transformation in Africa that led, for example, to the ending of the French Military Presence in several African countries (Cite 38) and even to cutting the diplomatic relations with France as recently done by Burkina Faso (Cite 39).
Multilateral Trade Alliances (Free Trade Agreements (FTAs)) and Multilateral Military Alliances. Traditionally, Multilateral Alliances include dedicated types of alliances, such as Military alliances (e.g., NATO), Trade Alliances (FTAs) (e.g., Mercosur), and Political Alliances (e.g., OIC) (Cite 42). However, over the years, the Multilateral alliances have evolved into complex alliances that combine multiple activities, such as Trade, Politics, and Economics and even Military aspects, such as the GCC and the African Union (AU). Importantly, in the last two decades, too many Trade alliances based on Free Trade Agreements (FTAs) (Cite 43) were established, so too many countries became members of several Trade alliances in parallel, such as Russia that is a member in a few Multilateral Trade Alliances, such as SCO, BRICS, CIS, OPEC+, and EAEU. Hence, Membership in Multilateral Trade Alliances (Free Trade Agreements (FTAs)) is supposed to affect positively and in a significant way the International Trade of the country because FTAs are supposed to eliminate the import tariffs or to reduce them significantly, which gives advantages to countries that are members in certain FTAs over countries that are not members in these FTAs (Cite 43). Even membership in Multilateral Military Alliances (e.g., NATO and CSTO) is supposed to contribute to International Trade, but mainly in relation to the export of Arms.
Foreign Military Presence in Host Countries. Foreign Military Presence has advantages and disadvantages from the military perspective (Cite 44), but from the international trade perspective, it may lead to more risks, especially if the host country is involved in an unintentional war, as happened to the GCC countries when the USA attacked Iran from their territories, which paralysed their airports and ports during the war (Cite 45), resulting in heavy losses in terms of exports and tourism (Cite 46), regardless of the civil damages to the GCC countries due to the counter-missile attacks from Iran alongside the self-damages from the intercepts (Cite 47). Importantly, Foreign Military Presence does not promise any commitment to defend in the case of an attack like what exists in a Military Defence Treaty (Cite 44). Thereby, the agreement between the USA and Jordan about the USA’s bases in Jordan is a good example of this, namely not only that the USA have no commitment to defend Jordan in the case of an attack, but the opposite, Jordan should defend the USA’s personnel and installations in Jordan (Clause 1 in Document I below), and Jordan is even primarily responsible for the security in Jordan outside the USA’s facilities (Clause 4 in Document I below), so paradoxically, the USA has no any commitment to defend Jordan in the case of an attack against Jordan or even in the case of a counter-attack against Jordan following the USA’s attack against a third country from the USA's bases and installations in Jordan, as happened recently when Iran conducted counter-attacks against the USA's bases and installations in Jordan that the USA used them to carry out attacks against Iran, such as the Iranian counter-attack against the USA’s bases in Jordan (Cite 48) or even the Iranian counter-attack against Aqaba airport in Jordan that was used by the USA to carry out attacks against Iran (Cite 49). Considering the above, Foreign Military Presence may impact negatively the International Trade of the Host Country, especially if the military bases were used in wars in the past or even in cases where there is a risk for using the military bases in a war in the near future (Cite 50). However, even ‘Military Imperialism’ that used for military interventions may impact negatively the International Trade of the Home Country, because it lead to Enmity and Antagonism (Cite 122), such as in the case of the USA (Cite 21 and Cite 22). Keep in mind that at the end of the day, every person around the world makes the decision about which imported product to buy and not their government, so wars, especially those based on double standards, can negatively impact personal decision-making. In other words, the buying decision of any individual worldwide may be influenced by acts of War Crimes, which may result in choosing imported products from countries that do not conduct War Crimes, Ethnic Cleansing, and Genocide, or even have complicity with them.
Document I. Article 6 on Security From the USA-Jordan Defense Cooperation Agreement about the USA’s Foreign Military Presence in Jordan
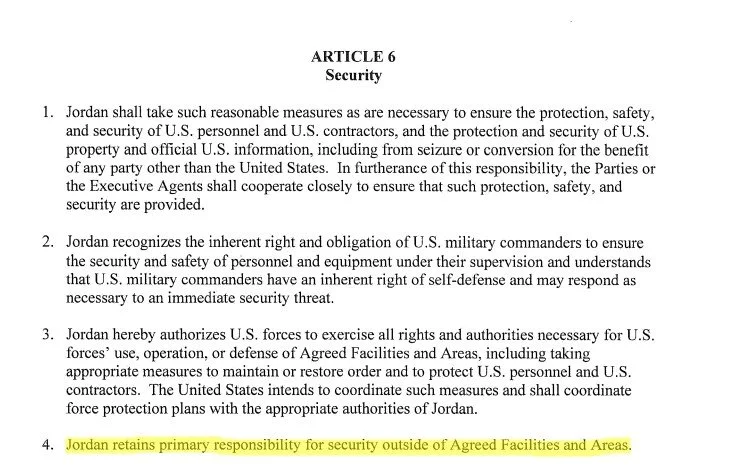
For Full Agreement, please see https://www.state.gov/wp-content/uploads/2021/05/21-317-Jordan-Defense-DCA-01.31.2021-with-Exchange-of-Notes.pdf
Sanctions. Sanctions serve as a tool to punish countries that violate International Law and the UN Charter, yet unclear its effectiveness (Cite 51), especially due to the Global Mechanism of Middle Trade Brokers (Cite 52). However, over the last two decades, it has been used as a political tool against non-allies (e.g., Against Russia (Cite 53), especially by the USA Coalition (Cite 54), while the USA Coalition has refrained from imposing sanctions against allies, as in the case of Israel, despite that Israel clearly has violated the International Law and the UN Charter, which has been perceived as Double-Standards (Cite 55). Worse, the USA even forces other countries to join the sanctions against other countries under a threat of 'Trade Punishment with the USA' if the country won't join the sanctions, which has led to the creation of a mechanism of 'Bypassing sanctions', including refraining from doing International Trade with the USA by many MNEs, especially from non-USA allied countries, with the aim of continuing to do trade with countries under sanctions (Cite 56). Much worse, over the last decade, the Sanctions tool has become a farce. First, the over-using of the Sanctions tool by the USA (Cite 57) makes it ineffective, especially when the USA has started to use it as a symbolic tool. Second, the USA has started to impose sanctions to obstruct justice (Cite 58), such as the USA's sanctions against the International Criminal Court (ICC) due to the arrest warrant against Netanyahu (Cite 59) or the USA's sanctions against UN employees, such as the sanctions against the UN Special Rapporteur Francesca Albanese because she wrote unfavourable reports about the Israeli Genocide in Gaza (Cite 60). Third, the recent farce of the 'Retired Syrian Terrorists' makes the USA's sanctions irrelevant because the USA removed the 'Retired Syrian Terrorists' from the list of sanctions and from the list of Terrorists only because they became allies of the USA (Cite 61 and Cite 62), while recently, the USA started to add to the list of sanctions/terrorists 'everyone' that are not allies of the USA, despite that they are not Terrorists, as in the case of the Palestinians that are fighting against Israeli occupation and the Israeli Genocide, like the Ukrainians that are fighting against the Russian occupation yet not suffering from Genocide, but despite it, for the USA, the Palestinians are Terrorists and the Ukrainians are not, which has been perceived as Double-Standards (Cite 55). Considering the above, sanctions are supposed to impact negatively the International Trade of the country, but paradoxically, the sanctions not only may disrupt the international Trade among countries that sanctions are imposed against them, but the sanctions also may disrupt the international Trade among the countries that imposed sanctions against others. Therefore, it can be argued that if a country is involved in sanctions, then the sanctions may negatively affect the International Trade of the country, either if the sanctions are imposed against the country or if the sanctions are imposed by the country against other countries, still, the negative effect will be strong if the sanctions are perceived as Double-Standards.
Involvement in Wars, Occupations, and Military Conflicts. The most crucial Geopolitical factor is 'Involvement in Wars, Occupations, and Military Conflicts', because it has the most significant negative impact on international trade. Countries, institutions, and MNEs consider countries that are involved in wars as unstable places for doing business, but it even negatively influences the decision-making of individuals when they choose a product to buy, especially if the country is involved in Occupations, War-crimes, Ethnic cleansing, Crimes against Humanity, Starvation, and Genocide, which reduce significantly the export of the country due to the avoidance of imports from the warmonger country by governments, institutions, MNEs, and individuals worldwide, either formally via sanctions, embargo, and ban or informally. Importantly, the negative attitude towards warmonger countries may stay even several years after the end of the war, which may impact International Trade in the long-run. Even long occupations and annexations that violate International Law and the UN charter can deteriorate the International Trade of the country, especially if it is involved with war crimes and Genocide, as happened to Israel due to the occupation of Palestine when many countries and organisations worldwide have banned the trading with Israel, formally and informally (Cite 37 and Cite 67).
Section 1.3.3 Global Survival Rank (GSR) by Dr. Ziva Rozen-Bakher
As shown in Chart B, the Research Model includes the Global Survival Rank (GSR) (Cite 68) that can influence the direction of how the two Geopolitical factors – Sanctions and Involvement in wars – may affect International Trade, either positively or negatively. In other words, the Global Survival Rank (GSR) can serve as a moderator for the impact of the Sanctions and Involvement in wars on International Trade, namely a low rank of GSR (Cite 69) can reduce the negative impact of sanctions and Involvement in wars on the International Trade Balance, as discussed below.
Global Survival Rank (GSR) as a Moderator for Sanctions. The Global Survival Rank (GSR) can give an additional layer about the ability of the country to maintain a Positive International Trade Balance under Sanctions (Cites 51-54). In other words, strong countries with a Low rank of GSR may have the ability to deal with sanctions while maintaining a Positive International Trade Balance, while weaker countries may experience a Negative International Trade Balance due to sanctions. However, paradoxically, sanctions can lead not only to a Negative International Trade Balance among countries that sanctions imposed against them but also among countries that imposed sanctions against other countries, especially if they were previously dependent on trade with the countries that were sanctioned.
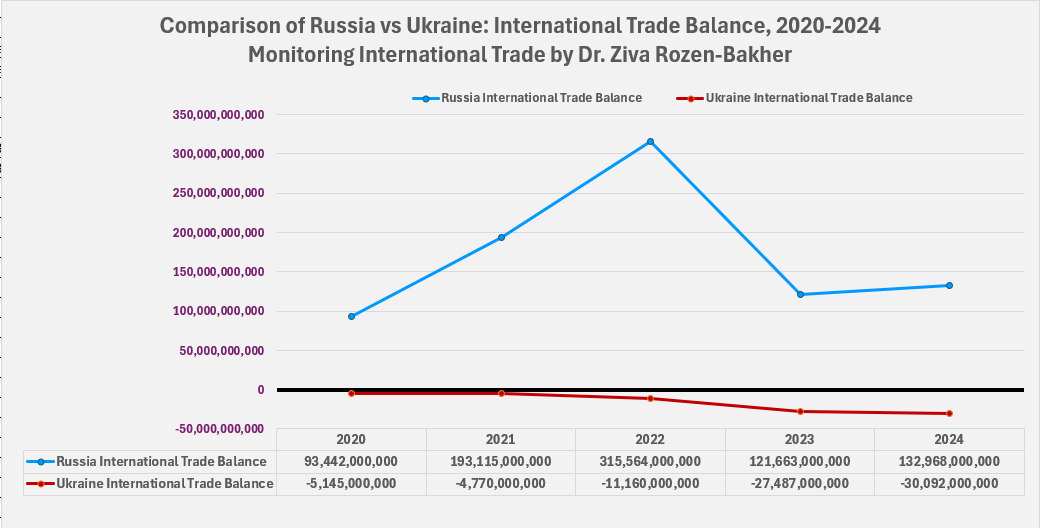
Global Survival Rank (GSR) as a Moderator for 'Involvement in Wars, Occupations, and Military Conflicts'. The Global Survival Rank (GSR) provides important information about the country's ability to function during wars at all levels (Cite 63), including at the economic Level (Cite 70), which covers the International Trade level. Therefore, strong countries with a Low rank of GSR have the ability to function economically under wars without getting into a Negative International Trade Balance, while less powerful countries may fall into the trap of a Negative International Trade Balance because of wars, such as in the case of Russia vs Ukraine, as shown in Table C. that presents the Indicators (R1-R7) of Global Survival Rank (GSR) of Russia vs Ukraine during the years 2023-2025 (Cite 70), namely paradoxically, Russia’s GDP increased from 1,779 Billion in 2023 to 2,021 Billion in 2025, despite that Russia was at war under unprecedented sanctions (Cite 54), while Ukraine’s GDP reduced from 200 Billion in 2023 to 179 Billion in 2025, despite the unprecedented military Aid and Civil Aid that Ukraine got from the USA Coalition (€309 billion from at least 41 countries, updated August 2025, Cite 71), which can be explained by Russia’s High rank of GSR (3) versus the Ukraine’s lower rank of GSR compared to Russia that even negatively changed from 31 in 2023 to 33 in 2025. Therefore, the Global Survival Rank (GSR) gives an important indication about the ability of the country to carry out International Trade during Wars and even to stay in a Positive International Trade Balance if the country has a low rank of GSR, such as in the case of Russia vs Ukraine as shown in Chart C. that compares Russia vs Ukraine regarding their International Trade Balance for the Years 2020-2024. Chart C not only confirms the assumption that Russia will succeed in keeping a Positive International Trade Balance during wars due to the low rank of GSR, but it also shows that despite the unprecedented sanctions, Russia even succeeds in increasing its trade balance from 2023 to 2024 during the long war with Ukraine, while Ukraine, despite the unprecedented Aid, its Negative International Trade Balance increased significantly after the start of the war, namely from -4.8 Billion in 2021 to 11.2 Billion in 2022, 27.5 Billion in 2023, and 30.1 Billion in 2024, so in 2024, Ukraine even gets into the Top 20 of the countries with a Negative International Trade Balance (see Chart 1 in the Result Section).
Table C. Comparison of Russia vs Ukraine: Indicators (R1-R7) of Global Survival Rank (GSR), GSR 2023 - GSR 2025
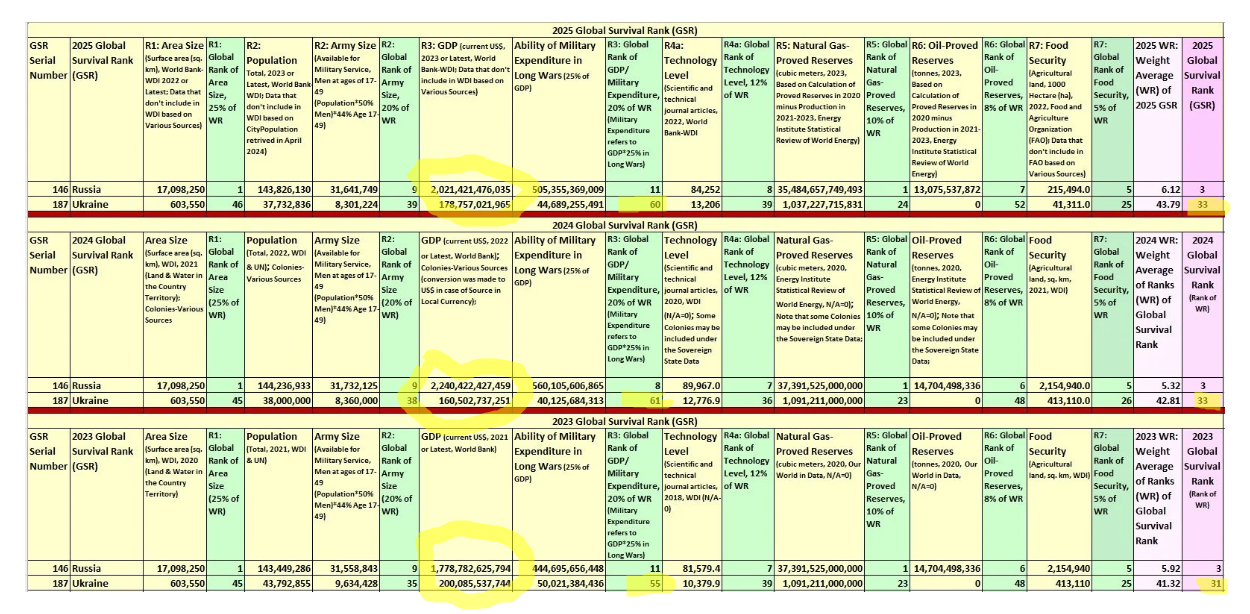
Chart C. Comparison of Russia vs Ukraine: International Trade Balance in USD for the Years 2020-2024
Section 1.3.4 Government Policy: Trade Policy and Labour Market Policy
As shown in Chart B, the International Trade not only affected by the Geopolitical Factors, but also by the Government Policy, especially by the Trade Policy and Labour Market Policy, as discussed in this section.
Trade Policy. Trade Policy is critical to the success of creating a Positive International Trade Balance, yet as I discussed in my research paper titled: Rozen-Bakher, Z. “Restrictions on International Trade and Foreign Direct Investment (FDI): Nationalism-Mercantilism versus Trade Liberalism” (Cite 4), there are two opposing doctrines on how a government should manage International Trade: Restrictions on International Trade versus Trade Liberalisation, as follows:
Nationalism-Mercantilism: Restrictions on International Trade. From the country perspective, there are many justifications for imposing restrictions on international trade, such as preventing control of strategic national assets by foreign firms, restraining unemployment in domestic companies by preventing the relocation of production to host countries, protecting weak industries, dealing with "unfriendly" countries, maintaining high prices, and more. However, Restrictions on International Trade have become a controversial topic due to the ‘Hard-Direct Tactics’ based on a Nationalist-Mercantilist Doctrine, such as imposing import quotas to limit the quantities of foreign products that enter the country, imposing export quotas to increase the prices of goods in host markets (e.g., on Oil by OPEC), imposing import tariffs to give priority to domestic production, while imposing export tariffs to preserve natural resources and rare resources. Still, a country may impose higher import tariffs on its rivals, while giving lower tariffs to its allies or even exemptions from tariffs, as done by Trump’s ‘Reciprocal Tariff’. Although it also includes ‘Manipulative-Indirect Tactics’, such as government subsidies to promote the export of local goods around the world at competitive prices, giving priority to national products in tenders, strict local standards to restrain imported products, limiting quotas for foreign workers, Antitrust regulations regarding cross-border M&As, and more. Nevertheless, the restriction policy towards international trade leads to an inherent complicated conflict at the country level between the local demands and the global demands, resulting in a backfire on the national economy, because when a country imposes high import tariffs on a rival country, the local market still needs products from this rival country, which increases the production costs in the country, and consequently, hinders the Comparative Competitive Advantages of the country in the global markets. (Cite 4)
Trade Liberalisation: Removal of Restrictions on International Trade and Encouragement of International Trade. As I discussed in my research book titled: Rozen-Bakher, Z. “Trade Wars: Foreign Direct Investment (FDI) and International Trade” (Cite 83), Trade Liberalisation stems from the significant increase in the scope of MNEs' activity worldwide due to globalization, which has led many governments to recognize the importance of MNEs’ activities to advance the national economy through the implementation of Trade Liberalisation. The motives for the incentive policy to encourage International Trade are based primarily on the assumptions that it will lead to prosperity, economic growth, knowledge transfer, technology transfer, advanced R&D, improving infrastructure, improving labour skills, improving labour productivity, availability of a variety of products at attractive prices to customers, quality service and more. Thereby, many governments have moved from ‘closures to trade’ to ‘openness to trade’, which has implemented by removing restrictions on trade, removing barriers to MNEs' activities, breaking monopolies to allow free competition, opening sectors to competition, privatization of state-owned companies, incentives for MNEs when they operate in peripheral geographical areas or in weak sectors or underdeveloped areas, which have been implemented through the provision of grants and loans to MNEs, and corporate tax incentives. Considering the above, Trade Liberalisation should lead to an open competitive market without monopolies, cartels, subsidies to export and indirect technical barriers, resulting in more opportunities for local customers to obtain attractive products in competitive prices from MNEs from around the world, which also gives opportunities for MNEs to engage in the local market activities in various host countries. However, dramatic liberalization reforms in a short period can lead to a shock in the local market, so Trade Liberalisation should be implemented in a way that allows the local industries to adapt to the open competition (Cite 83), but from the viewpoint of the Comparative Competitive Advantages Theory, it is better to get rid of unprofitable and inefficient industries to allow specialisation in profitable and efficient industries.
Importantly, joining Multilateral Trade Alliances (Free Trade Agreements (FTAs)) is part of Trade Liberalisation, and it is a critical element for the success of the International Trade of a country, because memberships in FTAs provide competitive advantages to MNEs from a home country that has greater significant FTAs over MNEs from a home country that has fewer significant FTAs (Cite 4 and Cite 83), such as China that has memberships in significant trade alliances as BRICS and SCO versus the USA that has memberships in smaller or less significant trade alliances as USMCA, QIZ, and CAFTA, regardless of the fact that these FTAs of the USA are not fully valid due to Trump`s `Reciprocal Tariff’ (Cite 1). More specifically, an FTA is based on the principles that the Restrictions on International Trade should be removed, partially or fully, immediately or gradually, yet each country can maintain an independent trade policy towards other countries that are not parties to the FTA (Cite 83). As I discussed in my research paper titled: Rozen-Bakher, Z. “The Chess Game of Forming International Trade Agreements: Shaping Global Economic and Political Power” (Cite 43), membership in Multilateral Trade Alliances allows preserving political power or securing political power, especially in Multilateral Alliances that combine Trade, Political, Economic and even Military aspects, such as in Regional Alliances (e.g., SCO) or in Global Alliances that include members from different geographical areas, acting as a ‘Trade Coalition’ (e.g., BRICS). However, the quality of an FTA depends on the conditions of the 'Origin Product' and 'Rules of Origin' (Cite 43 and Cite 83). More specifically, a product is considered as an 'Origin Product' when the product is fully produced in the country, including its raw materials that used in its production, so an imported product or a product whose production is based on imported raw materials cannot be considered as an 'Origin Product' in FTAs, still, each FTA has specific 'Rules of Origin' for each product, which determine the quality of the FTA.
Labour Market Policy. As I discussed in my PhD Dissertation titled: Rozen-Bakher, Z. “Multinational Enterprises (MNEs) in the Global Era: The Impact of Location Factors ─ Economic, Political, Technological, Cultural and Labour Market Policy ─ on Inward and Outward Foreign Direct Investment (FDI), and the implications of FDI inward and FDI outward on Labour Markets” (Cite 84), the Labour Market Policy refers to laws and regulations related to a country's labour market, such as working conditions, labour standards, unemployment laws, restrictions on firing employees, protection against exploitation and discrimination, safety conditions, and more. More specifically, the Labor Market policy aims to limit situations in which employers discriminate against employees, while setting labour standards regarding working conditions, such as statutory regulations regarding weekly working hours, minimum wage, annual leave, daily breaks, and such. On the one hand, excessive Labour Market Regulations significantly increase labour costs, which reduces profitability. On the other hand, extensive Labour Market Regulations contribute to the quality of the production thanks to high labour standards and good working conditions, resulting in high-quality products for exports that can compete in global markets. Although Labour Market Regulations not only contribute to job security and employee motivation through good working conditions, but Labour Market Regulations also contribute to Labour Productivity and Labour Skills. Importantly, job security, reflected in permanent full-time jobs, even contributes to a high level of consumption because it leads to the situation in which workers have stable financing conditions that allow them spending money on various products, while a lack of job security, reflected in part-time jobs/temporary jobs, negatively affects the workers' consumption of even basic products, which hinders economic growth. (Cite 84).
Therefore, high labour standards and good working conditions increase costs, but at the same time, it improve the quality of the production and the motivation of the workers, which is beneficial to the Comparative Competitive Advantages of the country, resulting in increase in exports thanks to the high quality of products and high quality of human resources that can handle successful International Marketing in competitive markets around the world. However, if we look at that from historical perspective, then Communism raised due to the over-exploitation of Capitalists against employees, manifested in the absence of basic working conditions with very low wages that barely cover the basic needs of workers. Thus, a country with a ‘Modern Slavery Labour Market’ may suffer from a decline in the Comparative Competitive Advantages in the long-run, regardless of the possibility of a regime transformation from ‘Hard Capitalism’ into ‘Soft Capitalism’ or even into ‘Socialism’ or unexpectedly into ‘Soft Communism’ (Cite 40 and Cite 88), such as the current Socialist trend in the USA, as the example of the recent elected Mayor of New York from the Democratic Socialists of America (DSA) (Cite 86), with the aim of correcting the 'Hard Capitalism' in the USA due to the suffering of Middle Class, which is reminiscent of the socialist trend in Europe during the Industrial Revolution that led to the establishment of Labour Unions in Europe (Cite 87).
Section 2. Methodology
Monitoring International Trade by Dr. Ziva Rozen-Bakher for the Year 2024 covers 263 Home Countries, either UN Members or Non-UN Members, as follows:
UN Members – 193 Home Countries
UN Observer States - 1 Home Country
Special Administrative Regions (SARs) of China - 2 Home Countries
Disputed Countries - 12 Home Countries
Colonies - 55 Home Countries
Colonies/Non-Contiguous State of USA - 2 Home Countries
Keep in mind that some Colonies have separate data on International Trade, while others included in the data of their Sovereign States. For full details about it, please see Section 5. Methodological Notes.
Furthermore, ‘Monitoring International Trade by Dr. Ziva Rozen-Bakher’ aims to give important information about International Trade to the general public, so the testing of the research model is based on Comparison by Ranks, Comparison by Average or Total, and Comparison by Average of Categories. However, if you would like to see how the Location Factors of a country affect International Activity (FDI or International Trade), including their Implications on Labour Market, through sophisticated statistical methods (e.g., Regressions), then please see Cite 30, Cite 84, Cite 91 that also include countless citations of research works that used various statistical methods.
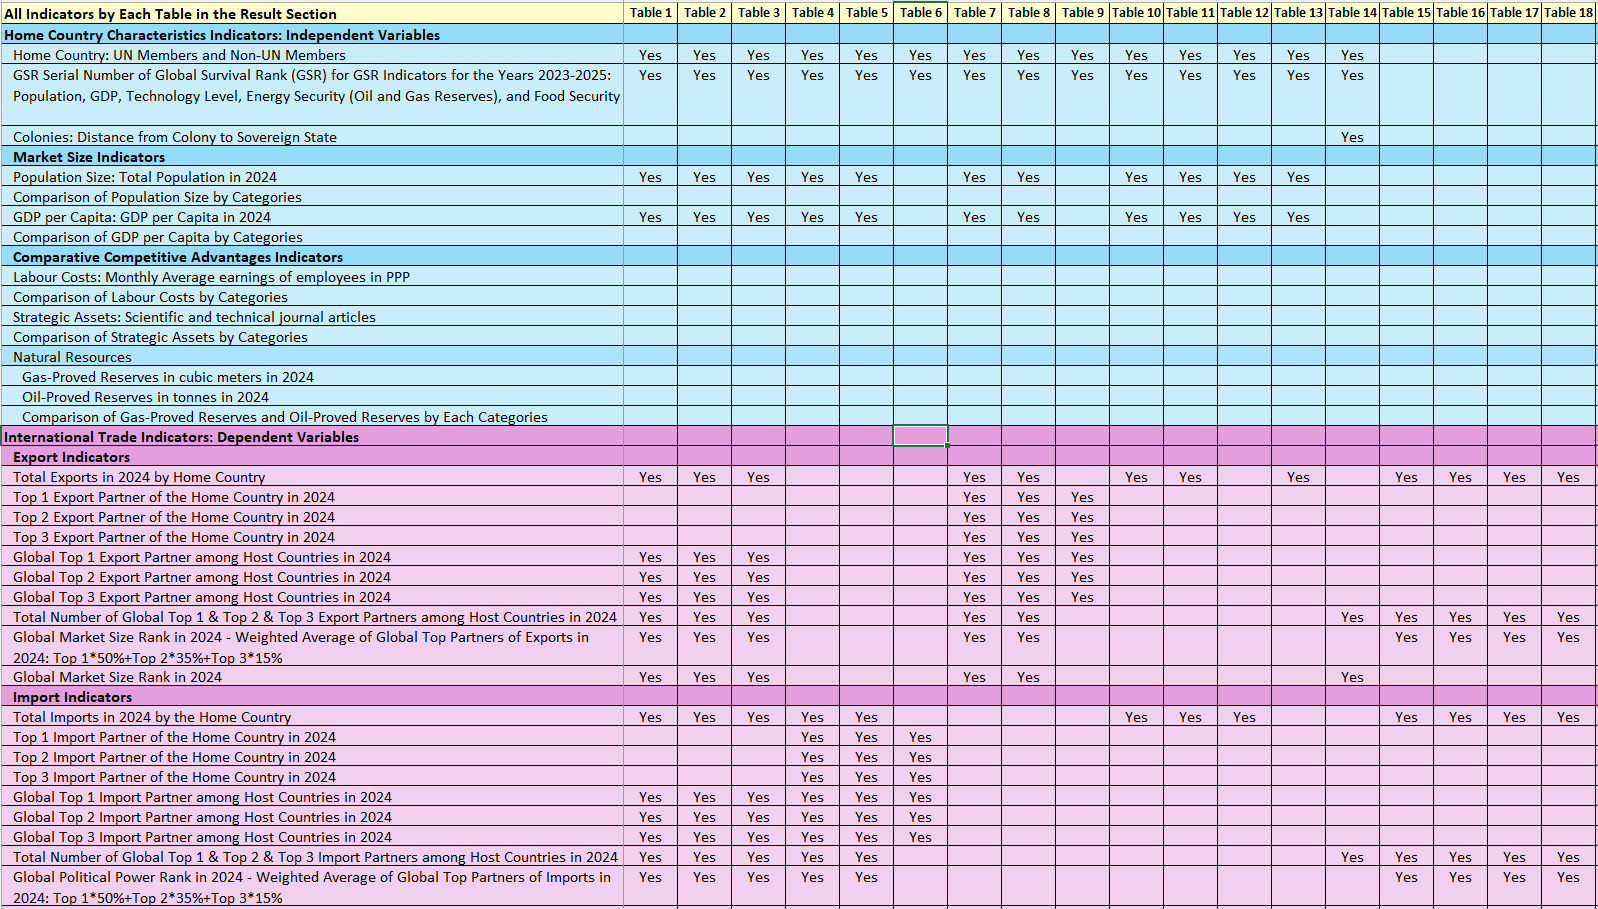
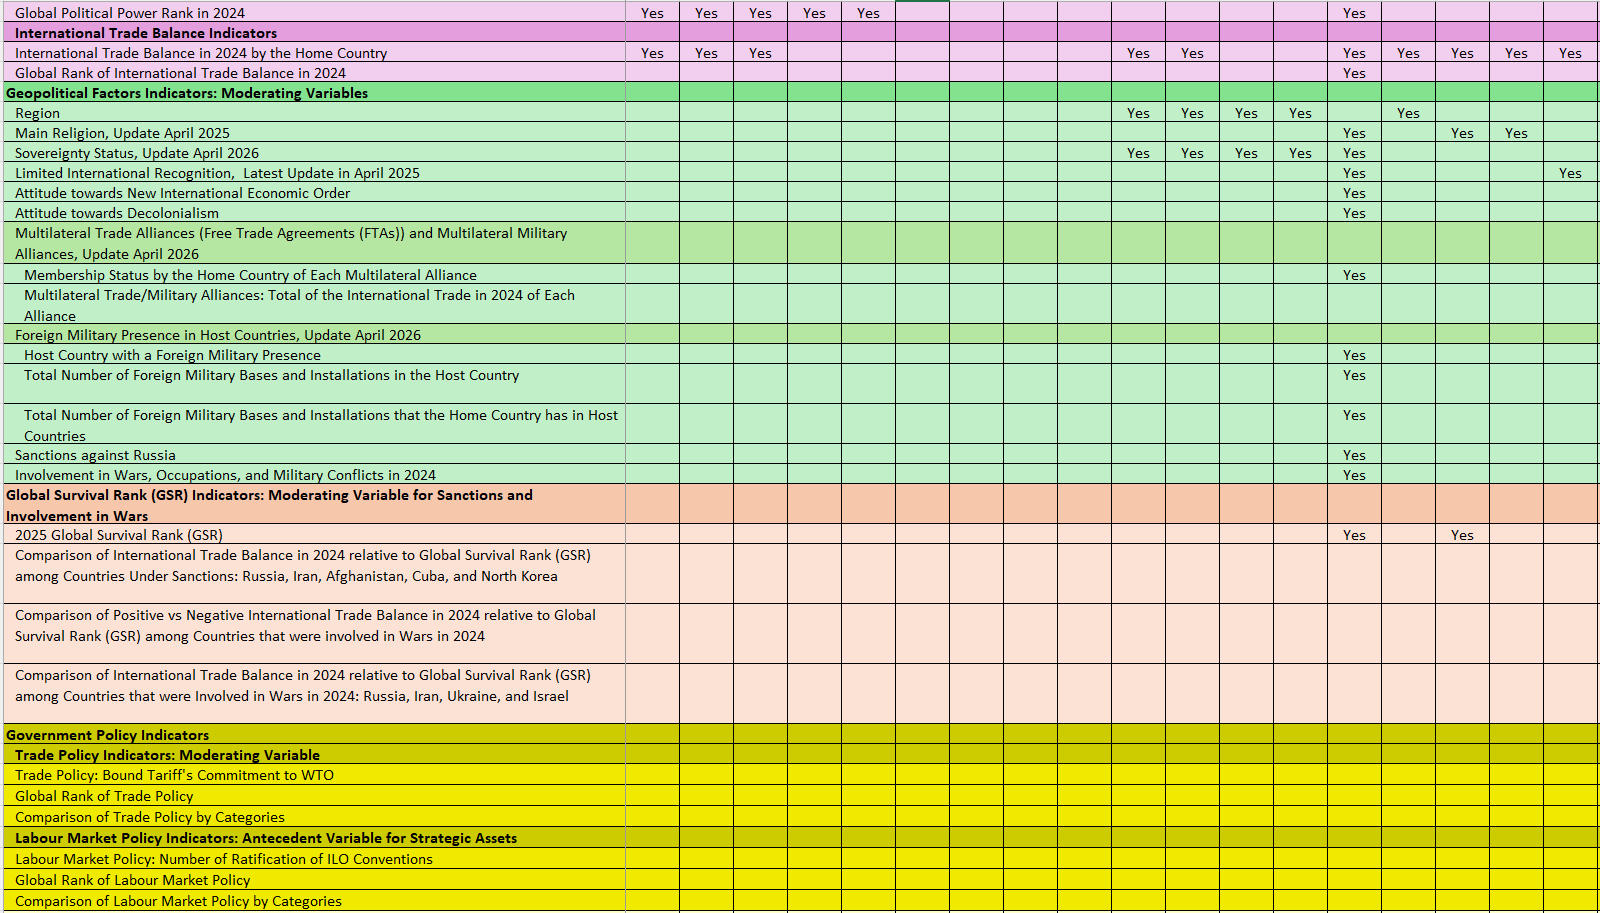
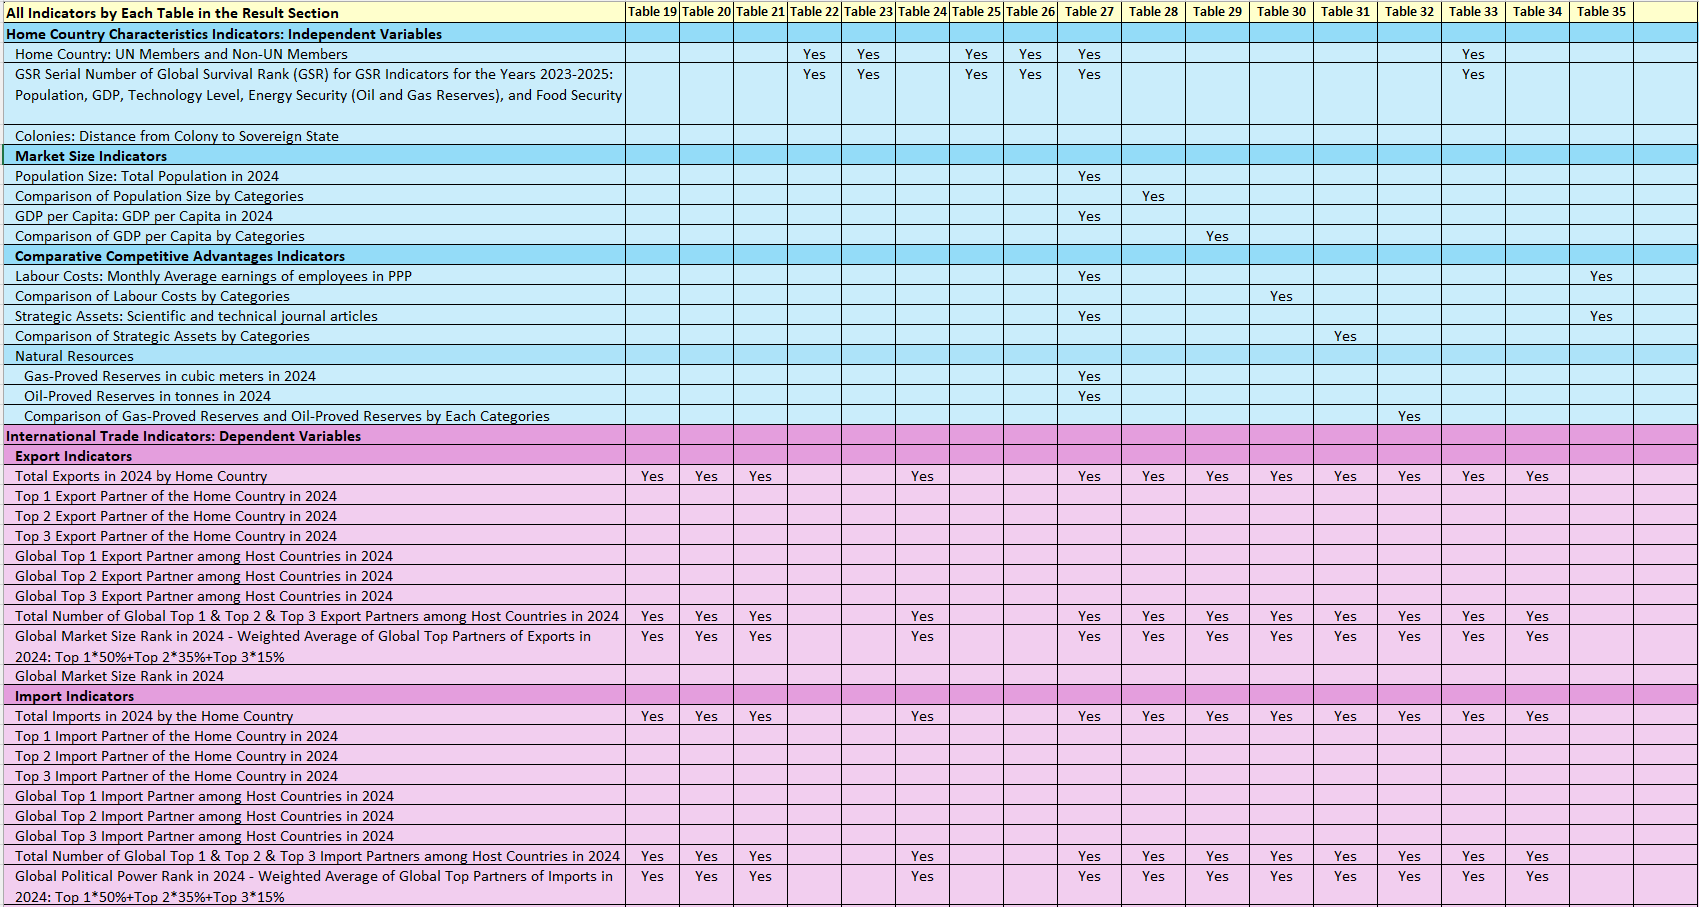
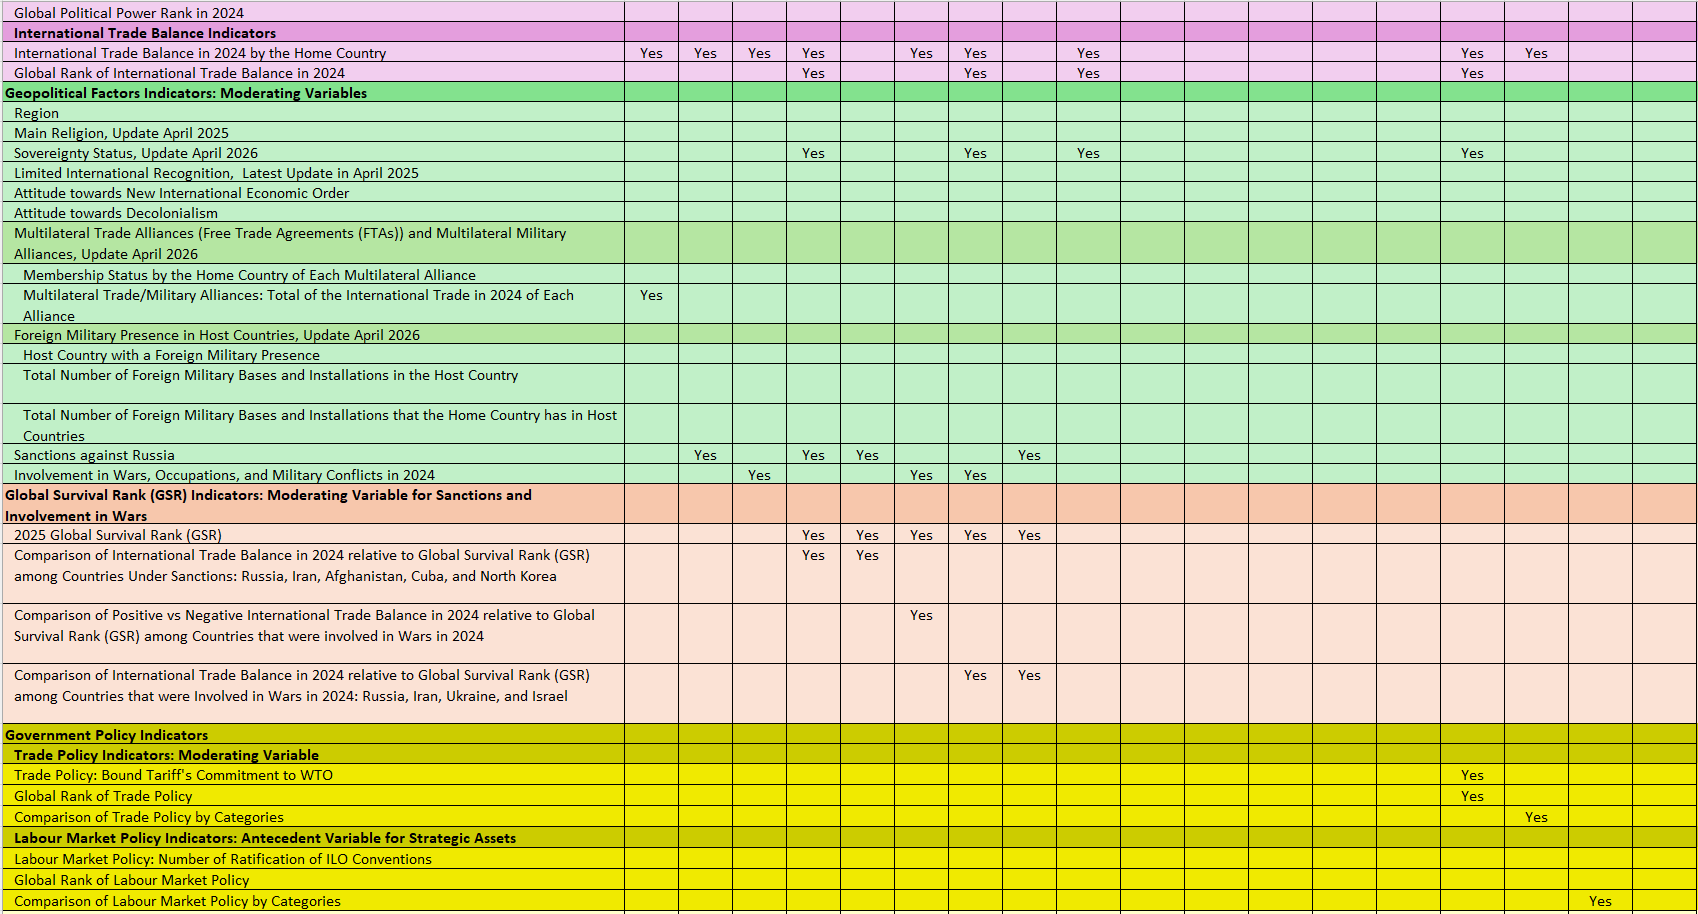
Moreover, Monitoring International Trade by Dr. Ziva Rozen-Bakher for the Year 2024 includes five sets of Variables: Home Country Characteristics as Independent Variables (Section 2.1), International Trade as Dependent Variables (Section 2.2), Geopolitical Factors as Moderating Variables (Section 2.3), the Global Survival Rank (GSR) as a Moderating variable for two Geopolitical factors: Sanctions and Involvement in Wars (Section 2.4), Trade Policy as a Moderating Variable (Section 2.5.1), and Labour Market Policy as an Antecedent Variable for Strategic Assets (Section 2.5.2). Thereby, Table D presents all the indicators included in the Monitoring International Trade for the Year 2024 by each table included in the Results section, which makes it possible to know which indicators are included in each Result Table.
Table D. All indicators included in the Results Tables 1-35: Each Indicator by Each Table
Section 2.1 Home Country Characteristics as Independent Variables
Home Country: UN Members and Non-UN Members. The Monitoring International Trade for the Year 2024 includes all UN Members and all Non-UN Members included in the 2025 Global Survival Rank (GSR) (Cite 72), so the Home Country indicator refers to either a UN Member or a Non-UN Member. More specifically, the Home Country refers to all the types of Sovereignty Status namely, UN Members, UN Observer States, Disputed Countries, Colonies, and Special Administrative Regions (SARs) of China (Cite 73). However, in the case of a Colony, the name of the Colony also includes the name of the Sovereign State, such as Gibraltar, UK. It is important to note that certain Sovereign States maintain distinct data for their colonies, while others incorporate the colonies into their overall data, so in cases of integrated data, the data on the Colony is often classified as 'Missing Data'. Therefore, please look at Section 5. Methodology Notes to get full details about the data of each UN member and Non-UN Member.
GSR Serial Number of Global Survival Rank (GSR) for GSR Indicators for the Years 2023-2025: Population, GDP, Technology Level, Energy Security (Oil and Gas Reserves), and Food Security. All the results tables that were included in the Monitoring International Trade include the GSR Serial Number in order to look for more Home Country Characteristics in the Global Survival Rank (GSR). More specifically, each country or colony included in the Global Survival Rank (GSR) by Dr. Ziva Rozen-Bakher is assigned with a GSR serial number that remains the same in all subsequent years, so any particular country can be tracked by using its GSR serial number across different years of the Global Survival Rank (GSR) (Cite 76). Thereby, the GSR Serial Number allows finding any Country/Colony/Territory in the Global Survival Rank (GSR) to see the Indicators (R1-R7) of Global Survival Rank (Cite 68, Cite 74, and Cite 75), as follows: Area Size (R1), Population and Army Size (R2), Domestic Economic Activity (GDP) and Ability of Military Expenditure in Long Wars (R3), Technology Level (R4a), Natural Gas-Proved Reserves (R5), Oil-Proved Reserves (R6), and Food Security (R7).
Colonies: Distance from Colony to Sovereign State. Long distance from a colony to its Sovereign State poses a High Risk during wars, but it also poses challenges regarding International Trade because most of the Colonies today are located on isolated islands, so taking care even of their Food and Energy involves high costs and can be a risky task when the Sea Routes are blocked or not safe (Cite 77 and Cite 78), such as what happened during the recent USA-Israel War against Iran. The Distance Risk from a Colony to its Sovereign State is tested via the indicator of the 'Straight Line Distance on the Global Map' from capital to capital in Km.
Market Size Indicators
Population Size
Population Size: Total Population in 2024. The Population was tested via the World Bank's Indicator of Total Population in 2024 or the latest available. The Total Population refers to all residents in a country, regardless of legal status or citizenship, and it is based on midyear estimates. However, the database of CityPopulation was used for Colonies and Disputed Countries that are not included in the database of the World Bank, which was retrieved in March-April 2026.
Comparison of Population Size by Categories. The comparison of Population Size by categories is based on the indicator Total Population in 2024. This comparison includes six categories, as follows:
Tiny Home Countries (up to 100K)
Very Small Home Countries (above 100K-1M)
Small Home Countries (above 1M-7M)
Medium Home Countries (above 7M-40M)
Big Home Countries (above 40M-100M)
Very Big Home Countries (above 100M)
GDP per Capita
GDP per Capita in 2024. The GDP per Capita was tested via the World Bank's Indicator of GDP per Capita (current international $US) in 2024 or the latest available, while missing data in the World Bank was retrieved from TerraVisor.Com for the year 2024; All sources were retrieved in March-April 2026.
Comparison of GDP per Capita by Categories. The comparison of GDP per Capita by categories is based on the indicator GDP per Capita in 2024. This comparison includes seven categories, as follows:
Very Poor Home Countries (Up to 4K)
Poor Home Countries (above 4K-10K)
Home Countries with Problems (above 10K-20K)
Emerging Home Countries (above 20K-40K)
Middle Class Home Countries (40K-70K)
Rich Countries (above 70K)
Missing Data
Comparative Competitive Advantages Indicators
Labour Costs
Labour Costs: Monthly Average earnings of employees in PPP. Differences in manufacturing and operating costs among various countries, especially labour costs, motivate MNEs to relocate production activities to host countries where the production costs are lower relative to those in the home country, with the aim of exporting their products to the rest of the world (Cite 30 and Cite 83). Thereby, Labour Costs were tested using the ILO’s Indicator of the Monthly Average earnings of employees in PPP in USD for the most recent year available for each country, which allow to compare the Labour Costs across countries. The data was retrieved in August 2026 from the ILOSTAT database of the ILO.
Comparison of Labour Costs by Categories. The comparison of Labour Costsby categories is based on the indicator Monthly Average earnings of employees in PPP in USD. This comparison includes seven categories, as follows:
Home Countries with Very Low Labour Costs (Up to 500)
Home Countries with Low Labour Costs (Above 500 to 1,000)
Home Countries with Low-Medium Labour Costs (Above 1,000 to 2,000)
Home Countries with Medium Labour Costs (Above 2,000 to 3,000)
Home Countries with High Labour Costs (Above 3,000-5,000)
Home Countries with Very High Labour Costs (Above 5,000)
Missing Data
Strategic Assets
Strategic Assets: Scientific and technical journal articles. As I discussed in my research book titled: Rozen-Bakher, Z. “Trade Wars: Foreign Direct Investment (FDI) and International Trade” (Cite 83), Strategic Assets refers to the resources, assets and capabilities that enable a company to increase its potential value and competitive advantages such as, reputation, customer base, tactical knowledge, R&D capabilities, trade names, know-how, and technological assets. Strategic assets contribute to solving commercial difficulties, increasing the firm's value, and contributing to its competitive advantages over competitors. Obtaining strategic assets also contributes to synergy in R&D activities, distribution channels, reducing competition, and diversification of products and services. Considering that, Strategic Assets was tested via the World Bank’s Indicator of Scientific and Technical Journal Articles in 2023. This indicator refers to the Number of Scientific and Engineering Articles Published in the following fields: Physics, Biology, Chemistry, Mathematics, Clinical Medicine, Biomedical Research, Engineering and Technology, and Earth and Space Sciences. Thus, this indicator gives well-founded indication about the R&D, Scientific and Technical capabilities of the country.
Comparison of Strategic Assets by Categories. The comparison of Strategic Assetsby categories is based on the indicator Scientific and technical journal articles. This comparison includes six categories, as follows:
Home Countries with Strategic Assets of Up to 100
Home Countries with Strategic Assets of above 100 to 1K
Home Countries with Strategic Assets of above 1K to 10K
Home Countries with Strategic Assets of above 10K to 100K
Home Countries with Strategic Assets of above 100K to 1M
Missing Data
Natural Resources
Natural Resources. One of the traditional motives of MNEs is to obtain natural resources, such as oil, sugar and tobacco (Cite 83). However, the Oil and Gas are going to become rare energy resources unless more significant Reserves will be found in the coming future (Cite 89). Therefore, the natural resources were tested via the Gas and Oil, as follows:
Natural Gas-Proved Reserves in 2024. The Gas as a critical natural resource was tested by the Gas-Proved Reserves in cubic meters in 2024, based on the calculation of the Gas-Proved Reserves that were in 2020 minus the Gas Production that was during the years 2021-2024 (Cite 90), yet it refers to Zero if the calculation reached minus. The database was retrieved from the Energy Institute Statistical Review of World Energy in August 2026. The data for Alaska was retrieved from U.S. Energy Information Administration - EIA.
Oil-Proved Reserves in 2024. The Oil as an important natural resource was tested by the Oil-Proved Reserves in tonnes in 2024, based on the calculation of the Oil-Proved Reserves that were in 2020 minus the Oil Production that was during the years 2021-2024 (Cite 90), yet it refers to Zero if the calculation reached minus. Note, this calculation was used in the 2025 Global Survival Rank (GSR), but some changes appear in the oil production data regarding 2021-2023, so the calculation only added the new data relating to 2024. The database was retrieved from the Energy Institute Statistical Review of World Energy in August 2026. The data for Alaska was retrieved from U.S. Energy Information Administration - EIA.
Comparison of Gas-Proved Reserves and Oil-Proved Reserves by Each Categories.
Comparison of Gas-Proved Reserves by Categories. The comparison of Gas-Proved Reserves by categories is based on the indicator Gas-Proved Reserves in cubic meters in 2024. This comparison includes three categories, as follows:
Home Countries without Gas-Proved Reserves (Zero)
Home Countries with Gas-Proved Reserves (Up to 1,000 Billion Cubic Meters)
Home Countries with Gas-Proved Reserves (above 1,000 Billion to 35,000 Billion Cubic Meters)
Comparison of Oil-Proved Reserves by Categories. The comparison of Oil-Proved Reserves by categories is based on the indicator Oil-Proved Reserves in tonnes in 2024. This comparison includes three categories, as follows:
Home Countries without Oil-Proved Reserves (Zero)
Home Countries with Oil-Proved Reserves (Up to 1 Billion tonnes)
Home Countries with Oil-Proved Reserves (above 1 Billion to 45 Billion tonnes)
Section 2.2 International Trade as Dependent Variables
The data on International Trade refers to the year 2024. Notably, there is always a gap between the published year and the most recent year of data provided by international bodies, so, for example, so, for example, in 2026, the World Bank and the UNCTAD published data on International Trade that refer to the year 2024.
Export Indicators
Total Exports in 2024 by Home Country. This indicator was tested using the World Bank's Indicator for the Total of Export of Goods in current US$ for the year 2024. A Methodology Note was given in Table G where data were based on additional sources, while N/A was indicated in case of Missing Data. All sources were retrieved in June 2026.
Top 1 Export Partner of the Home Country in 2024. Each home country has many Export Partners, but this indicator refers to the Top 1 Export Partner of the Home Country in 2024. This Indicator was retrieved from the database of UN Trade and Development (UNCTAD). A Methodology Note was given in Table G where data were based on additional sources, while N/A was indicated in case of Missing Data. All sources were retrieved in June 2026.
Top 2 Export Partner of the Home Country in 2024. Each home country has many Export Partners, but this indicator refers to the Top 2 Export Partner of the Home Country in 2024. This Indicator was retrieved from the database of UN Trade and Development (UNCTAD). A Methodology Note was given in Table G where data were based on additional sources, while N/A was indicated in case of Missing Data. All sources were retrieved in June 2026.
Top 3 Export Partner of the Home Country in 2024. Each home country has many Export Partners, but this indicator refers to the Top 3 Export Partner of the Home Country in 2024. This Indicator was retrieved from the database of UN Trade and Development (UNCTAD). A Methodology Note was given in Table G where data were based on additional sources, while N/A was indicated in case of Missing Data. All sources were retrieved in June 2026.
Global Top 1 Export Partner among Host Countries in 2024. This indicator is based on the calculation of the total number of the Host Countries where the Home Country is the Top 1 Export Partner in 2024. In other words, this indicator looks at how many countries the home country is the Top 1 Export Partner in 2024, as shown in Table 9.
Global Top 2 Export Partner among Host Countries in 2024. This indicator is based on the calculation of the total number of the Host Countries where the Home Country is the Top 2 Export Partner in 2024. In other words, this indicator looks at how many countries the home country is the Top 2 Export Partner in 2024, as shown in Table 9.
Global Top 3 Export Partner among Host Countries in 2024. This indicator is based on the calculation of the total number of the Host Countries where the Home Country is the Top 3 Export Partner in 2024. In other words, this indicator looks at how many countries the home country is the Top 3 Export Partner in 2024, as shown in Table 9.
Total Number of Global Top 1 & Top 2 & Top 3 Export Partners among Host Countries in 2024. This indicator is based on the calculation of the total number of the Host Countries where the Home Country is the Top 1 Export Partner or Top 2 Export Partner or Top 3 Export Partner. In other words, this indicator looks at how many countries in total the home country is the Top 1 Export Partner or Top 2 Export Partner or Top 3 Export Partner.
Global Market Size Rank in 2024 - Weighted Average of Global Top Partners of Exports in 2024: Top 1*50%+Top 2*35%+Top 3*15%. The indicator of the ‘Total Number of Global Top 1 & Top 2 & Top 3 Export Partners’ (see above) does not take into account the difference between being the Global Top 1 Export Partner versus being the Global Top 2 Export Partner versus being the Global Top 3 Export Partner, but it simply calculated the total of all of them. Considering that, the Global Political Power Rank takes into account that there is a difference between being a Global Top 1 and being a Global Top 2 and being a Global Top 3, so based on that, this indicator refers to the ‘Weighted Average of Global Top Partners of Exports’ based on the following equation: Top 1*50%+Top 2*35%+Top 3*15%.
Global Market Size Rank in 2024. The Global Market Size Rank is based on the ‘Weighted Average of Global Top Partners of Exports’ (see above) in a way that a lower rank indicates a country with the highest ‘Weighted Average of Global Top Partners of Exports’, while a higher rank indicates a country with the lowest ‘Weighted Average of Global Top Partners of Exports’. For example, the USA has the highest ‘Weighted Average of Global Top Partners of Imports’ in 2024 = 35.10, so its Global Political Power Rank in 2024 = 1, while Albania is among the countries that have a ‘Weighted Average of Global Top Partners of Imports’ in 2024 = 0.00, so its Global Market Size Rank in 2024 = 41, the lowest rank in 2024.
Import Indicators
Total Imports in 2024 by Home Country. This indicator was tested using the World Bank's Indicator for the Total of Import of Goods in current US$ for the year 2024. A Methodology Note was given in Table G where data were based on additional sources, while N/A was indicated in case of Missing Data. All sources were retrieved in June 2026.
Top 1 Import Partner of the Home Country in 2024. Each home country has many Import Partners, but this indicator refers to the Top 1 Import Partner of the Home Country in 2024. This Indicator was retrieved from the database of UN Comtrade, either when the Home Country is the Reporter or based on the Partners' Reports. A Methodology Note was given in Table G where data were based on additional sources, while N/A was indicated in case of Missing Data. All sources were retrieved in June 2026.
Top 2 Import Partner of the Home Country in 2024. Each home country has many Import Partners, but this indicator refers to the Top 2 Import Partner of the Home Country in 2024. This Indicator was retrieved from the database of UN Comtrade, either when the Home Country is the Reporter or based on the Partners' Reports. A Methodology Note was given in Table G where data were based on additional sources, while N/A was indicated in case of Missing Data. All sources were retrieved in June 2026.
Top 3 Import Partner of the Home Country in 2024. Each home country has many Import Partners, but this indicator refers to the Top 3 Import Partner of the Home Country in 2024. This Indicator was retrieved from the database of UN Comtrade, either when the Home Country is the Reporter or based on the Partners' Reports. A Methodology Note was given in Table G where data were based on additional sources, while N/A was indicated in case of Missing Data. All sources were retrieved in June 2026.
Global Top 1 Import Partner among Host Countries in 2024. This indicator is based on the calculation of the total number of the Host Countries where the Home Country is the Top 1 Import Partner in 2024. In other words, this indicator looks at how many countries the home country is the Top 1 Import Partner in 2024, as shown in Table 7.
Global Top 2 Import Partner among Host Countries in 2024. This indicator is based on the calculation of the total number of the Host Countries where the Home Country is the Top 2 Import Partner in 2024. In other words, this indicator looks at how many countries the home country is the Top 2 Import Partner in 2024, as shown in Table 7.
Global Top 3 Import Partner among Host Countries in 2024. This indicator is based on the calculation of the total number of the Host Countries where the Home Country is the Top 3 Import Partner in 2024. In other words, this indicator looks at how many countries the home country is the Top 3 Import Partner in 2024, as shown in Table 7.
Total Number of Global Top 1 & Top 2 & Top 3 Import Partners among Host Countries in 2024. This indicator is based on the calculation of the total number of the Host Countries where the Home Country is the Top 1 Import Partner or Top 2 Import Partner or Top 3 Import Partner. In other words, this indicator looks at how many countries in total the home country is the Top 1 Import Partner or Top 2 Import Partner or Top 3 Import Partner.
Global Political Power Rank in 2024 - Weighted Average of Global Top Partners of Imports in 2024: Top 1*50%+Top 2*35%+Top 3*15%. The indicator of the ‘Total Number of Global Top 1 & Top 2 & Top 3 Import Partners’ (see above) does not take into account the difference between the Global Top 1 Import Partner versus the Global Top 2 Import Partner versus the Global Top 3 Import Partner, but it simply calculated the total of all of them. Considering that, the Global Political Power Rank takes into account that there is a difference between being a Global Top 1 and being a Global Top 2 or being a Global Top 3, so based on that, this indicator refers to the ‘Weighted Average of Global Top Partners of Imports’ based on the following equation: Top 1*50%+Top 2*35%+Top 3*15%.
Global Political Power Rank in 2024. The Global Political Power Rank is based on the ‘Weighted Average of Global Top Partners of Imports’ (see above) in a way that a lower rank indicates a country with the highest ‘Weighted Average of Global Top Partners of Imports’, while a higher rank indicates a country with the lowest ‘Weighted Average of Global Top Partners of Imports’. For example, China has the highest ‘Weighted Average of Global Top Partners of Imports’ in 2024 = 66.60, so its Global Political Power Rank in 2024 = 1, while Nepal is among the countries that have a ‘Weighted Average of Global Top Partners of Imports’ in 2024 = 0.00, so its Global Political Power Rank in 2024 = 36, the lowest rank in 2024.
Global Market Size Rank in 2024. The Global Market Size Rank is based on the ‘Weighted Average of Global Top Partners of Exports’ (see above) in a way that a lower rank indicates a country with the highest ‘Weighted Average of Global Top Partners of Exports’, while a higher rank indicates a country with the lowest ‘Weighted Average of Global Top Partners of Exports’. For example, the USA has the highest ‘Weighted Average of Global Top Partners of Imports’ in 2024 = 35.10, so its Global Political Power Rank in 2024 = 1, while Albania is among the countries that have a ‘Weighted Average of Global Top Partners of Imports’ in 2024 = 0.00, so its Global Market Size Rank in 2024 = 41, the lowest rank in 2024.
International Trade Balance Indicators
International Trade Balance in 2024 by the Home Country. The International Trade Balance is based on the rationale that the exports of the country should be higher compared to the Imports of the country, so this indicator is based on the calculation of the total Exports in 2024 minus the total Imports in 2024. Hence, a Positive International Trade Balance indicates that the country has healthy International Trade, while a Negative International Trade Balance indicates that the country has some problems with International Trade.
Global Rank of the International Trade Balance in 2024. The Global Rank of International Trade Balance in 2024 is based on the ‘International Trade Balance in 2024’ (see above), which allows comparing the International Trade Balance among all UN members and Non-UN members. The Range of this Rank is from 1 to 239. The Lowest Rank refers to a Higher Positive Balance, and the Highest Rank refers to a Higher Negative Balance.
Section 2.3 Geopolitical Factors as Moderating Variables:
Region, Religion, Sovereignty Status, Limited International Recognition, New International Economic Order, Decolonialism, Multilateral Alliances, Foreign Military Presence, Sanctions, Involvement in Wars
Region. This indicator includes eight Sub-Regions that reflect the current geopolitics and global order, as follows (by a-b): Africa (excluding North Africa), East-South Asia, Europe-East Oriented and Central Asia, Europe-West Oriented, Latin America and Caribbean, Middle-East and North Africa, North America, and Oceania.
Religion. The religion was tested by two indicators, which both were retrieved in April 2025 from The Association of Religion Data Archives (ARDA), as follows:
Main Religion. This indicator refers to the Main Religion (Relative Majority %) that exists in the country, such as Christianity versus Islam.
Main Religious Denomination. This indicator refers to the Main Religious Denomination of the Main Religion (Relative Majority %) that exists in the country, such as (Christianity-Catholic vs Christianity-Protestant or Islam-Sunni vs Islam-Shia). In other words, we first look at which religion is the main religion and, after that, which is the Main Religious Denomination among the main religion. For example, if Islam is the main religion in a country, then we look at which is the Main Religious Denomination in the country, namely, Islam-Sunni or Islam-Shia, while if Christianity is the main religion in a country, then we look at which is the Main Religious Denomination in the country, namely, Catholic vs Protestant vs Orthodox.
Sovereignty Status. This indicator includes four types of Sovereignty Status, which were retrieved from various sources in April 2026, as follows:
UN Members and UN Observer States. A UN Member refers to an Independent Country that has Full Membership in the United Nations (UN). Membership in the UN gives a clear indication that a country has Sovereignty over a certain territory at the Formal Level. However, a status of UN Observer State signals that the Disputed Country already has enough International Recognition to be in the process of becoming an Independent Country, such as in the case of Palestine that has the status of a UN Observer State because it already has International Recognition from around 150 UN Members and Non-UN members, while Kosovo still does not have the status of a UN Observer State like Palestine because only 111 UN Members and Non-UN members recognised the Self-Declaration of Independent Country (Cite 65).
Disputed Countries. A Disputed Country refers to a country that proclaims a Self-Declaration of Independent Country, including running its territory as an independent country. However, a Disputed Country lacks the status of a UN Member or UN Observer State, but has Limited International Recognition from other UN Members and Non-UN Members. Importantly, a Disputed Country has an ongoing conflict over sovereignty with the country that claims sovereignty for its territory.
Colonies. A Colony refers to a 'Non-Contiguous Territory' under the sovereignty of a distant State without that the territory declaring a 'Self-Declaration of an Independent Country'. Colonialism started in the 15th century as part of the Imperialism and Mercantilism Doctrine, but since then, most of the Colonies became Independent Countries, so currently, most of the remaining Colonies are small and vulnerable, yet most of them have aspirations for 'Self-Determination', especially following the UN resolution on Decolonialism (Granting Independence to Colonies) from 04 December 2024.
Special Administrative Regions (SARs) of China. China has two Special Administrative Regions (SARs): Hong Kong and Macau. Both of them are former Colonies that were handed over to their ‘Home Country’, China, yet after their handover, Hong Kong and Macau got the status of Special Administrative Region in China. Hong Kong was a Colony of the UK from 1841 until 1997 when it was handed over to China, while Macau was a Colony of Portugal from 1557 until 1999 when it was handed over to China.
Limited International Recognition. The International Recognition was assessed by counting the number of UN members and Non-UN members that have already formally recognised the UN Member or the Self-Declaration of Independence of the Disputed Country. This indicator is based on various sources that were retrieved in April 2025. Notably, there is a significant dynamic regarding the International Recognition of the State of Palestine, so for its latest data, please see International Recognition of the State of Palestine https://www.rozen-bakher.com/monitoringrisks/palestine-recognition . Therefore, this indicator includes four categories, as follows:
No International Recognition. 0 - Not recognised yet by any UN member or Non-UN Member.
Minor International Recognition. Recognition by 1-10 UN Members or Non-UN Members.
Significant Limited International Recognition. Recognition by 11-180 UN Members.
Almost Full International Recognition. Recognition by 180-192 UN Members.
Attitude towards the New International Economic Order. The UN Resolution on the New International Economic Order that was brought to a vote by Russia on 14 December 2022, gives a clear indication about which countries would like to preserve the economic dominance of the USA or, vice versa, which countries would like to replace the economic dominance of the USA with other alternatives. However, keep in mind that after the vote on the resolution, transformation in leadership took place in some countries, which changed the attitude towards the dominance of the USA in these countries, such as Argentina that has become a close ally of the USA since President Javier Milei assumed office in December 2023. Therefore, this indicator includes five options, as follows:
Against – Preserving the economic dominance of the USA.
In-Favour – Replacing the economic dominance of the USA with other alternatives.
Abstain – 'Sitting on the Fence' countries
Not Voted – Usually it serves as a tactical tool in UN Votes to avoid pressure from powerful countries, which is mainly implemented by small or weak countries (Cite 7).
Not Applicable (N/A) – refers to Non-UN members that have no right to participate in UN Votes.
Attitude towards Decolonialism. The UN Resolution on Decolonialism by Granting Independence to Colonies was brought to a vote on 04 December 2024, which gives a clear indication about which countries would like to preserve the Colonies or, vice versa, which countries would like to abolish the colonies by Granting Independence to the remaining Colonies. Therefore, this indicator includes five options, as follows:
In-Favour of Decolonialism
Abstain as 'Soft-Against'. No country was voted Against but rather 'Soft-Against' via Abstain, likely because it seems more 'politically correct' compared to Against, which is done mainly by Western countries that some of them still have Colonies.
Not Voted – Usually it serves as a tactical tool in UN Votes to avoid pressure from powerful countries, which is mainly implemented by small or weak countries (Cite 7).
Not Applicable (N/A) – refers to Non-UN members that have no right to participate in UN Votes.
Multilateral Trade Alliances (Free Trade Agreements (FTAs)) and Multilateral Military Alliances. The Multilateral Alliances includes two indicators, as follows:
Membership Status by the Home Country of Each Multilateral Alliance. The Monitoring International Trade for the Year 2024 includes all the Multilateral Alliancesincluded in the 2025 Global Survival Rank (GSR) (Cite 72). Thereby, this indicator presents the home country's membership status in each Multilateral Alliance, with the aim of giving information about the scope of the FTAs that each Home Country has, namely multiple membership in several FTAs is supposed to have a more positive impact on International Trade compared to membership in a single FTA or not having them at all. Thereby, this indicator includes several types of Membership Status, as follows: Member – when only the name of the Alliance is mentioned, while adding abbreviations in the cases of Associated Member (AM), Partner State (PS), Candidate for Full Membership (C), Applicant for Full Membership (A), Suspended Member (S), Agreement (AG), Unilaterally (U). The data for Trade Alliances were retrieved from the WTO-Regional Trade Agreements Database. All sources were retrieved in April 2026. For full information about Each Multilateral Alliance, Please see Rozen-Bakher, Z. Monitoring Alliances by Dr. Ziva Rozen-Bakherhttps://www.rozen-bakher.com/monitoring-alliances
Multilateral Trade/Military Alliances: Total of the International Trade in 2024 of Each Alliance. This indicator summarises the total of Exports/Imports/International Trade Balance in 2024 of each Multilateral Trade/Military Alliance to compare the International Trade among the Multilateral Trade/Military Alliances. However, keep in mind that there is a limitation with this indicator due to the multiple memberships. More specifically, in the last two decades, too many Multilateral Trade Alliances were formed, so too many countries became members of several FTAs in parallel, which limits the ability to determine which trade alliance contributes more to the country, especially if the export partners are also members in the same multiple trade alliances, such as Russia and China, which are both members in SCO and BRICS, or in the case of Russia and Kazakhstan, which are both members in SCO, BRICS, CIS, OPEC+, OIC, EAEU. Therefore, this indicator presents the comparison of International Trade in 2024 among the Multilateral Trade/Military Alliances, but keep in mind that most of the Home Countries belongs to more than one Multilateral Trade/Military Alliances, as shown in Map 6.
Foreign Military Presence in Host Countries. The data on Foreign Military Presence refer to a formal army that has Foreign Military Bases or Installations with Combat Forces (e.g., Land, Air, Navy) that carry out Military Operations or Exercises for operational readiness, including Logistics Bases, yet it does not include Training, Research, and Testing Bases. The data was retrieved from World BEYOND War in April 2026. The Foreign Military Presence includes three indicators, as follows:
Host Country with a Foreign Military Presence. It was tested via a dichotomous indicator, as follows: YES – Exists a Foreign Military Presence in the Host Country; NO – Not Exists a Foreign Military Presence in the Host Country.
Total Number of Foreign Military Bases and Installations in the Host Country. This indicator includes not only the total number of Military Bases or Installations in the Host Country with Combat Forces or with Logistics but also the total number of military bases and Installations with Training, Research, and Testing activities.
Total Number of Foreign Military Bases and Installations that the Home Country has in Host Countries. This indicator refers to the Military Bases and Installations that the Home Country has in Host Countries. It includes not only the total number of Military Bases or Installations in the Host Country with Combat Forces or with Logistics but also the total number of military bases and Installations with Training, Research, and Testing activities. In the cases of Sovereign State with Colonies, it also includes the total number of military bases and Installations that the Sovereign State has in its Colonies, but keep in mind that in some colonies, there is missing data about the exact number of the military bases and Installations that the Sovereign State has in the Colony.
Sanctions. Any sanction is supposed to impact negatively the International Trade of the country, but a Sanction-War at the regional or global levels can impact negatively the Internationl Trade of many countries, either if the sanctions are imposed against the country or if the sanctions are imposed by the country against other countries. Therefore, this indicator is tested by the Sanctions against Russia that cover many countries with significant impact not only on the global economy but also on the global order. More specifically, the Sanctions Against Russia following the Russia-Ukraine War have affected significantly the International Trade at the global level because the Sanctions have led to a Shift in Trade, namely it splits the world into two camps: those countries that joined the Sanctions Against Russia and those countries that did not join the Sanctions Against Russia. Therefore, this variable was tested by a dichotomous indicator, as follows: YES – Joined the Sanctions against Russia; NO – Not Joined the Sanctions against Russia. The data were retrieved in April 2025 from Russia's list of Unfriendly Countries.
Involvement in Wars, Occupations, and Military Conflicts in 2024. This variable was tested by a dichotomous indicator, as follows: YES – Involvement in Wars, Occupations, and Military Conflicts; NO – No Involvement. This indicator refers to the year of 2024 because the data on International Trade also refer to this year, but keep in mind that ongoing conflicts may have a negative impact years after the end of the war. This indicator refers to the following types of conflicts: i) UN members that have been involved in Wars, either as the Aggressors or as the countries that were under attack, including UN Members that their territories have been used to carry out military attacks. ii) Military Resistance against Occupation/Annexation (e.g., the Palestinian resistance against the Israeli occupation or the Lebanese resistance against the Israeli invasion of Lebanon). iii) Wars against Disputed Countries due to a Self-Declaration of Independence. iv) Civil Wars. v) Riots in Colonies that include curfew or State of Emergency, while handling them by military forces. Nevertheless, it excludes military combat against Terror Groups (e.g., Islamic State). The data was retrieved from various sources.
Section 2.4 Global Survival Rank (GSR):
Moderating Variable for Two Geopolitical Factors - Sanctions and Involvement in Wars
2025 Global Survival Rank (GSR). The Global Survival Rank (GSR) serves as a Moderating variable for two Geopolitical factors: Sanctions and Involvement in Wars. The Monitoring International Trade for the Year 2024 used the Global Survival Rank (GSR) in 2025, but it is also possible to look for other years via the GSR Serial Number (Cite 79).
Global Survival Rank (GSR) as a Moderator for Sanctions
Comparison of International Trade Balance in 2024 relative to Global Survival Rank (GSR) among Countries Under Sanctions: Russia, Iran, Afghanistan, Cuba, and North Korea. his comparison includes five countries that were subject to significant sanctions in 2024, as follows: Russia, Iran, Afghanistan, Cuba, and North Korea. The testing among these five countries includes two comparisons: i) Comparison of the International Trade Balance in 2024 relative to the Global Survival Rank (GSR). ii) Comparison of the Indicators (R1-R7) of 2025 Global Survival Rank (GSR).
Global Survival Rank (GSR) as a Moderator for 'Involvement in Wars, Occupations, and Military Conflicts'
Comparison of Positive vs Negative International Trade Balance in 2024 relative to Global Survival Rank (GSR) among Countries that were involved in Wars in 2024. This indicator includes only Home countries that were involved in Wars, Occupations, and Military Conflicts in 2024. This indicator is based on acomparison that includes two Categories, as follows: YES – Positive International Trade Balance in 2024; NO – Negative International Trade Balance in 2024.
Comparison of International Trade Balance in 2024 relative to Global Survival Rank (GSR) among Countries that were Involved in Wars in 2024: Russia, Iran, Ukraine, and Israel. This comparison includes four countries that were involved in wars in 2024, as follows: Russia, Iran, Ukraine, and Israel. The testing among these four countries includes two comparisons: i) Comparison of the International Trade Balance in 2024 relative to the Global Survival Rank (GSR). ii) Comparison of the Indicators (R1-R7) of 2025 Global Survival Rank (GSR).
Section 2.5 Government Policy: Trade Policy and Labour Market Policy
Section 2.5.1 Trade Policy as a Moderating Variable
Trade Policy: Bound Tariff's Commitment to WTO. TheTrade Policy has two opposite doctrines: Nationalism-Mercantilism by imposing Restrictions on International Trade versus Trade Liberalisation by removal of Restrictions on International Trade and Encouragement of International Trade, so when a country has higher import tariffs, then it means that its Trade Policy is based on Nationalism-Mercantilism, while when a country has lower import tariffs, then it means that its Trade Policy is based on Trade Liberalisation. Therefore, the Trade Policy was examined using the Bound Tariff's Commitment to World Trade Organization (WTO), which refers to the commitment of each WTO member not to increase the Import Tariffs above the Simple Average Bound Tariffs. Thus, when a country has a low Simple Average of Bound Tariffs, it means that the country has implemented Trade Liberalisation policy, while when a country has a high Simple Average of Bound Tariffs, it means that the country has implemented a Nationalism-Mercantilism policy. Notably, the USA's commitment to WTO on Simple Average Bound Tariffs is 3.4%, but Trump’s ‘Reciprocal Tariffs policy’ has violated this commitment because the import tariffs of the USA on Liberation Day were in the range of 10%-54% (Cite 2) with exemptions for fewer countries. Still, since then, there have been frequent changes with the ‘Reciprocal Tariffs’, reaching even higher import tariffs than it was on Liberation Day. Therefore, to overcome this dynamic change in the import tariffs of the USA, the Simple Average Bound Tariffs of the USA was referred as 54%, the highest tariffs on Liberation Day. Moreover, if a country is not a member of WTO, then it is treated as ‘NO Commitment to WTO’. The data was retrieved from WTO in May 2025.
Global Rank of Trade Policy. This rank is based on the indicator of Bound Tariff's Commitment to WTO (see above).The Range of this Rank is from 1 to 123. The Lowest Rank refers to the Minimum Percentage of Bound Tariff, and the Highest Rank refers to the Maximum Percentage of Bound Tariff.
Comparison of Trade Policy by Categories. The comparison of Trade Policy by categories is based on the indicator of Bound Tariff's Commitment to WTO. This comparison includes eight categories, as follows:
Home Countries with No Commitment to Bound Tariffs - No Members in WTO
Home Countries with Exorbitant Bound Tariffs (above 100%-160%)
Home Countries with Very High Bound Tariffs (above 50%-100%)
Home Countries with High Bound Tariffs (above 30%-50%)
Home Countries with Meduim-High Bound Tariffs (above 20% to 30%)
Home Countries with Meduim Bound Tariffs (above 10% to 20%)
Home Countries with Low Bound Tariff (Up to 10%)
Missing Data
Section 2.5.2 Labour Market Policy as an Antecedent Variable for Strategic Assets
Labour Market Policy: Number of Ratification of ILO Conventions. The most important element of the Labour Market Policy is the Labour Market Regulations, which include set of laws and regulations related to how the government manages the national labour market in terms of labour standards, working conditions, workers' safety, job security, and more. The International Labour Organisation (ILO) publishes regularly conventions that are actually recommendations for standards and conditions on various topics related to the labour market, and each country can decide whether to adopt one or another of the ILO's recommendations. Thereby, a high labour standards and good working conditions exist in a country that adopts the highest number of ILO conventions, while a low labour standards and less good working conditions exists in a country that adopts a fewer number of ILO conventions. Still, minimum number of ILO conventions reflects low labour costs, but it negatively affects labour productivity, labour skills and motivation. Still, a minimum number of ILO conventions reflects low labour costs, but it negatively affects labour productivity, labour skills and motivation, while a maximum number of ILO conventions reflects high labour productivity, high labour skills, and high motivation. Hence, the Labour Market Policy was examined using the total number of ratifications of ILO conventions that was ratified by each country until August 2026 when the data was retrieved from ILO. Every country that ratifies the ILO conventions must be a member of ILO, so if a Home Country is not a member of the ILO, then it means that its number of ratifications of ILO conventions is zero.
Global Rank of Labour Market Policy. This rank is based on the indicator of the Number of Ratification of ILO Conventions (see above).The Range of this Rank is from 1 to 89. The Lowest Rank refers to the Maximum Number of Ratifications, and the Highest Rank refers to the Minimum Number of Ratifications.
Comparison of Labour Market Policy by Categories. The comparison of Labour Market Policy by categories is based on the indicator of the Number of Ratification of ILO Conventions. This comparison includes six categories, as follows:
Home Countries that are not members of the ILO, so they have not ratified any ILO convention (Number of Ratifications: 0)
Home Countries with Very Limited Statutory Labour Standards and Working Conditions (Number of Ratifications: 1-10)
Home Countries with Reasonable Statutory Labour Standards and Working Conditions (Number of Ratifications: 11-69)
Home Countries with High Quality of Statutory Labour Standards and Working Conditions (Number of Ratifications: 70-99)
Home Countries with Very High Quality of Statutory Labour Standards and Working Conditions (Number of Ratifications: 100-150)
Missing Data
Section 3. Results
Section 3.1 Highlights
Chart 1. Top 20: Positive International Trade Balance versus Negative International Trade Balance
For full details, please see Tables 10-11 in Section 3.4.1
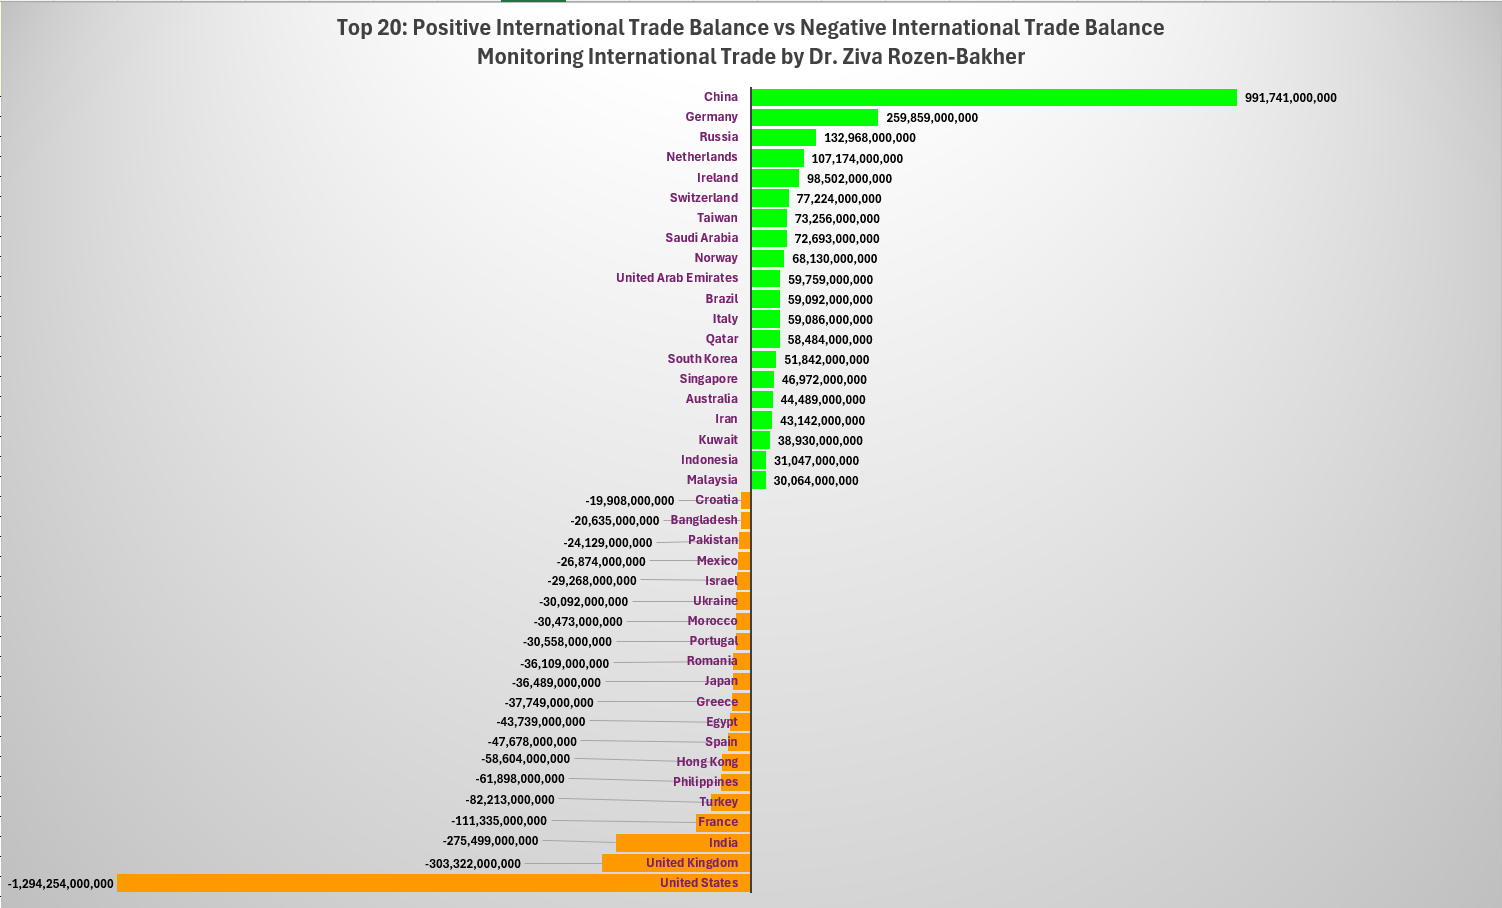
Chart 2. Top 20: Global Political Power Rank versus Global Market Size Rank
For full details, please see Tables 1-3 in Section 3.3
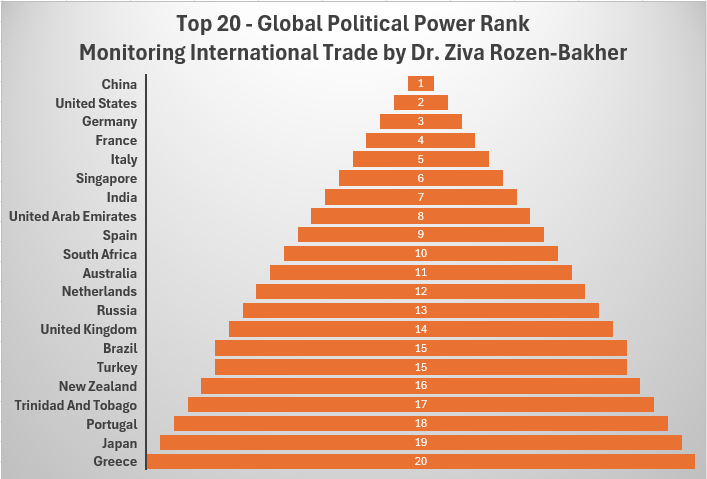
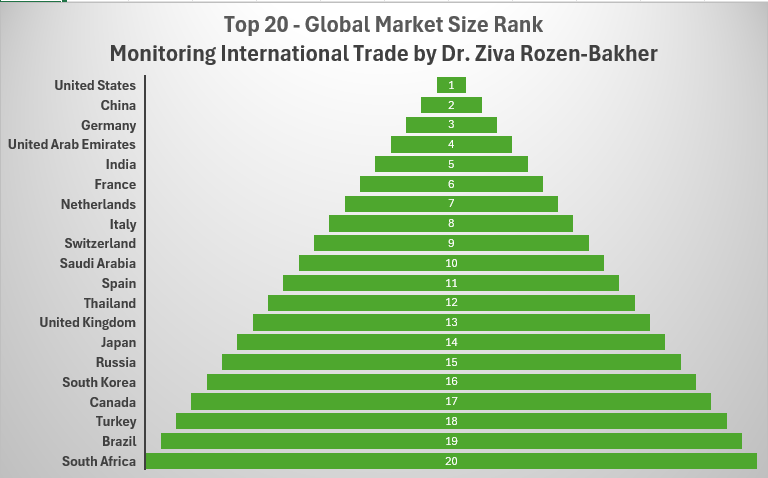
Chart 3. Top 20: Global Top 1 Import Partner versus Global Top 1 Export Partner
For full details, please see Tables 1-3 in Section 3.3
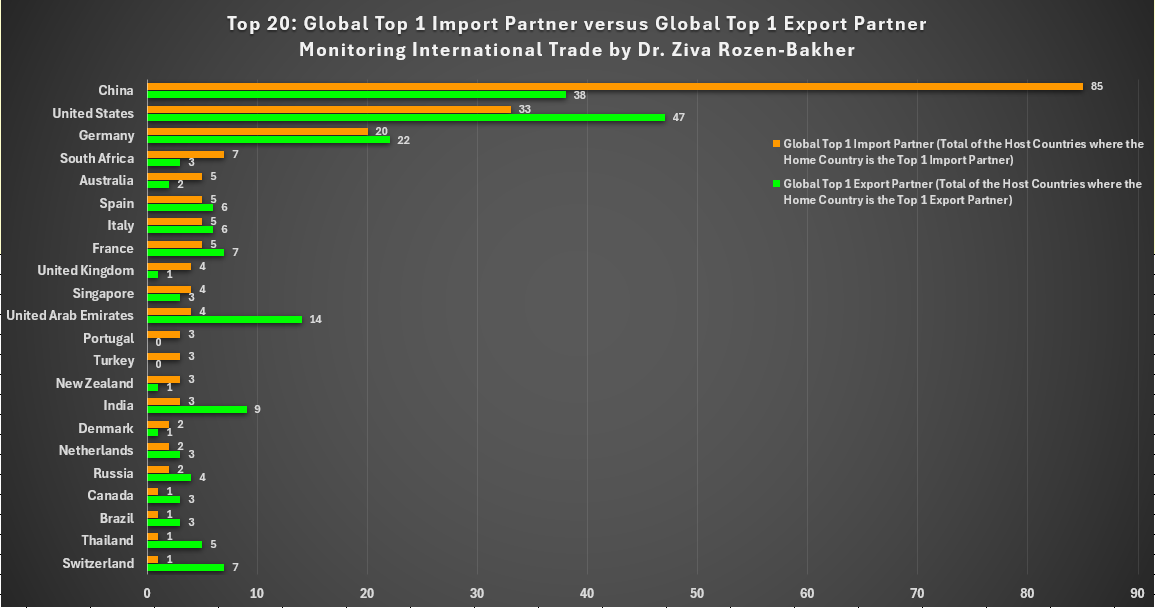
Map 1. Global Political Power - Top 1 Import Partner: China vs USA vs Germany
For full details, please see Tables 4-6 in Sections 3.3.1-3.3.2
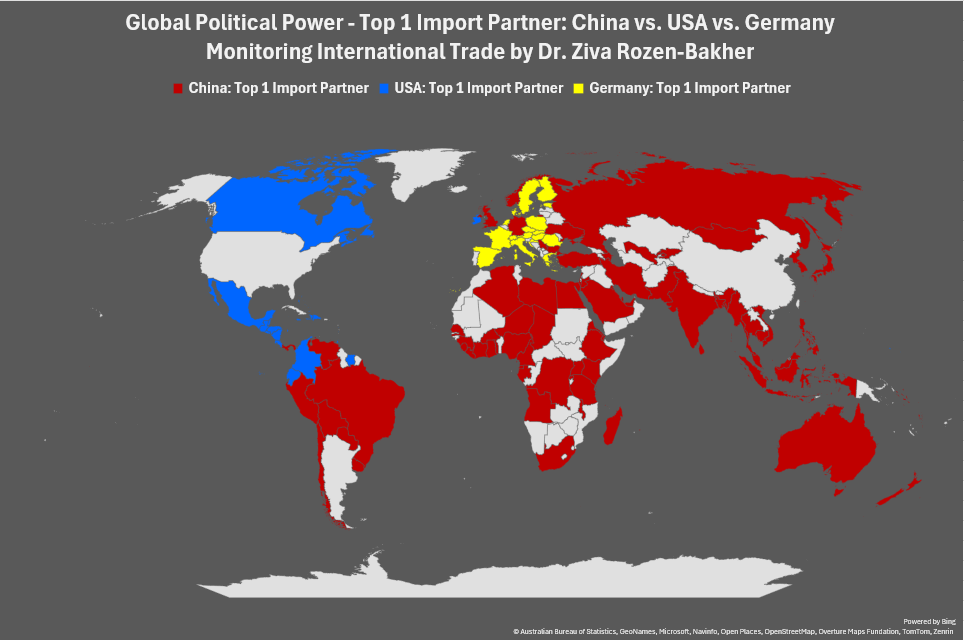
Map 2. Global Market Size - Top 1 Export Partner: USA vs China vs Germany
For full details, please see Tables 7-9 in Sections 3.3.3-3.3.4
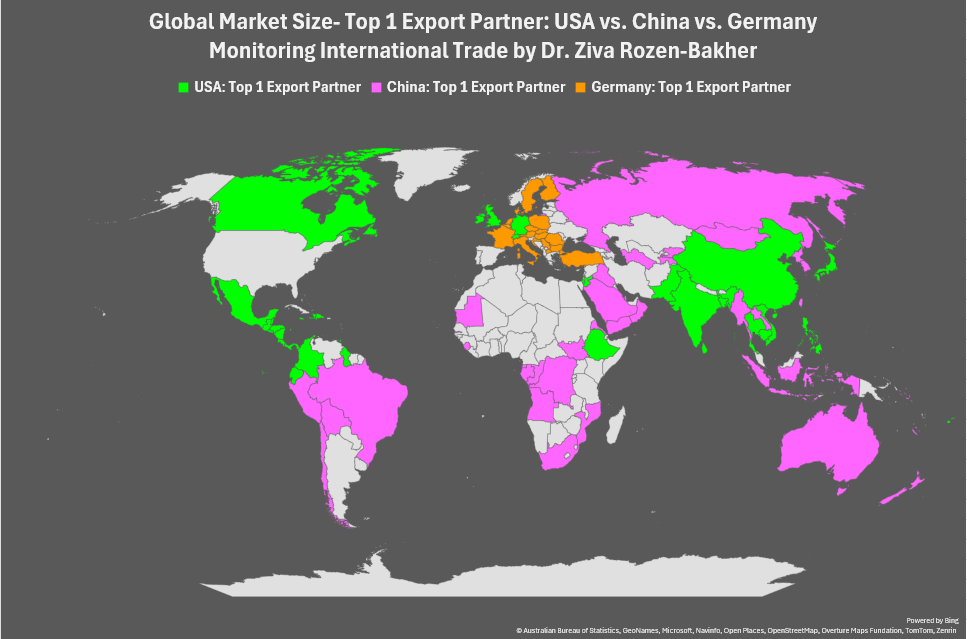
Map 3. Global Political Power - China as a Top Import Partner: Top 1, Top 2, Top 3
For full details, please see Tables 4-6 in Sections 3.3.1-3.3.2
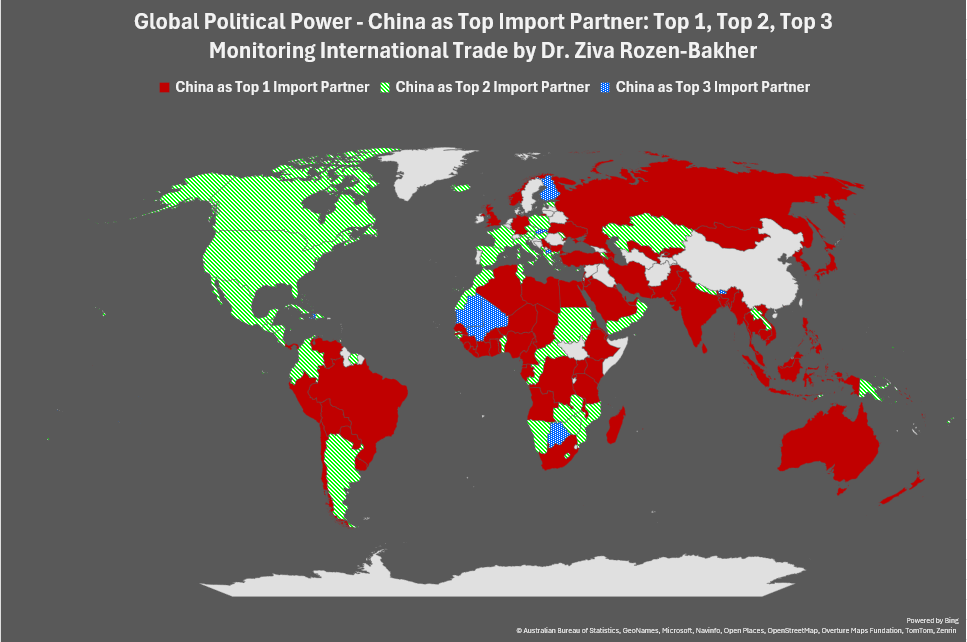
Map 4. Global Political Power - USA as a Top Import Partner: Top 1, Top 2, Top 3
For full details, please see Tables 4-6 in Sections 3.3.1-3.3.2
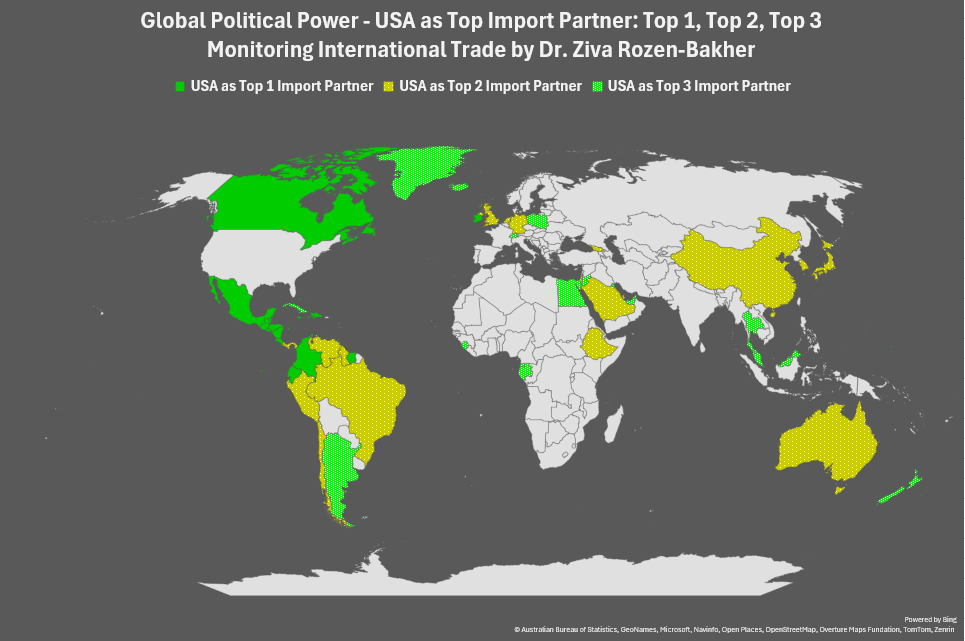
Map 5. Global Political Power - Germany as a Top Import Partner: Top 1, Top 2, Top 3
For full details, please see Tables 4-6 in Sections 3.3.1-3.3.2
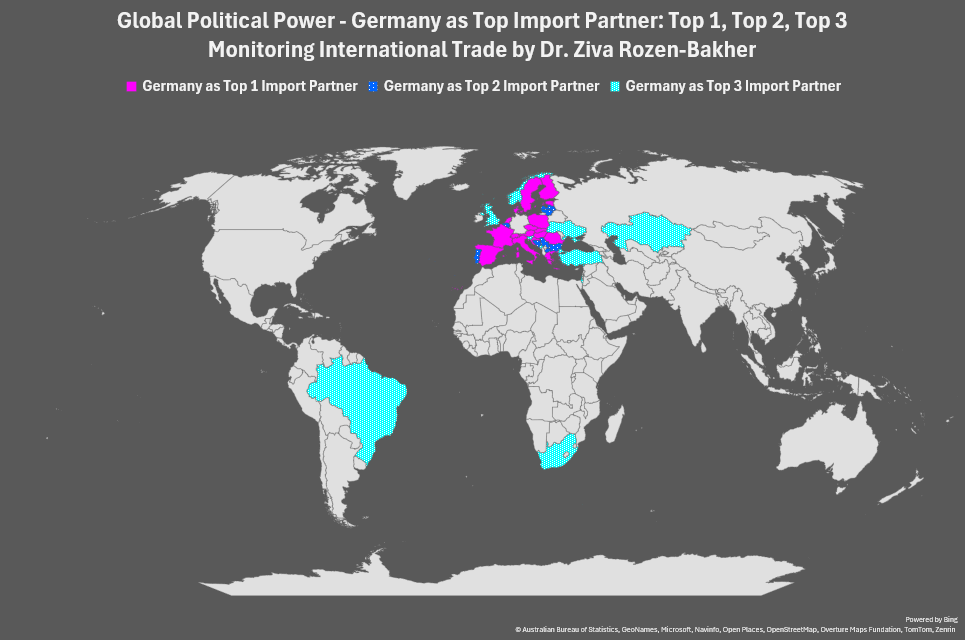
Chart 4. Comparison of International Trade Balance in 2024 among Multilateral Trade/Military Alliances
For full details, please see Table 14 in Section 3.5 and Table XX in section 3.5.7
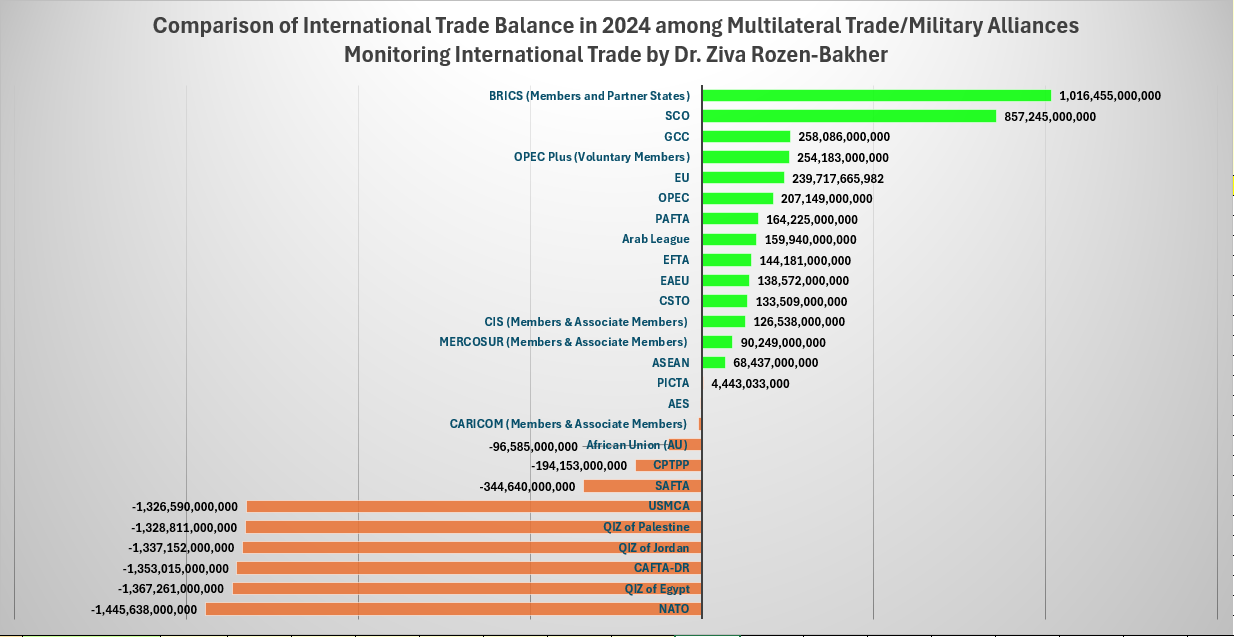
Section 3.2 Analysis of Global Top Partners of Exports and Imports in 2024 - Global Political Power Rank versus Global Market Size Rank: All UN Members and Non-UN Members
Table 1. Global Top Partners of Exports and Imports: All UN Members and Non-UN Members, sorted by Global Political Power Rank
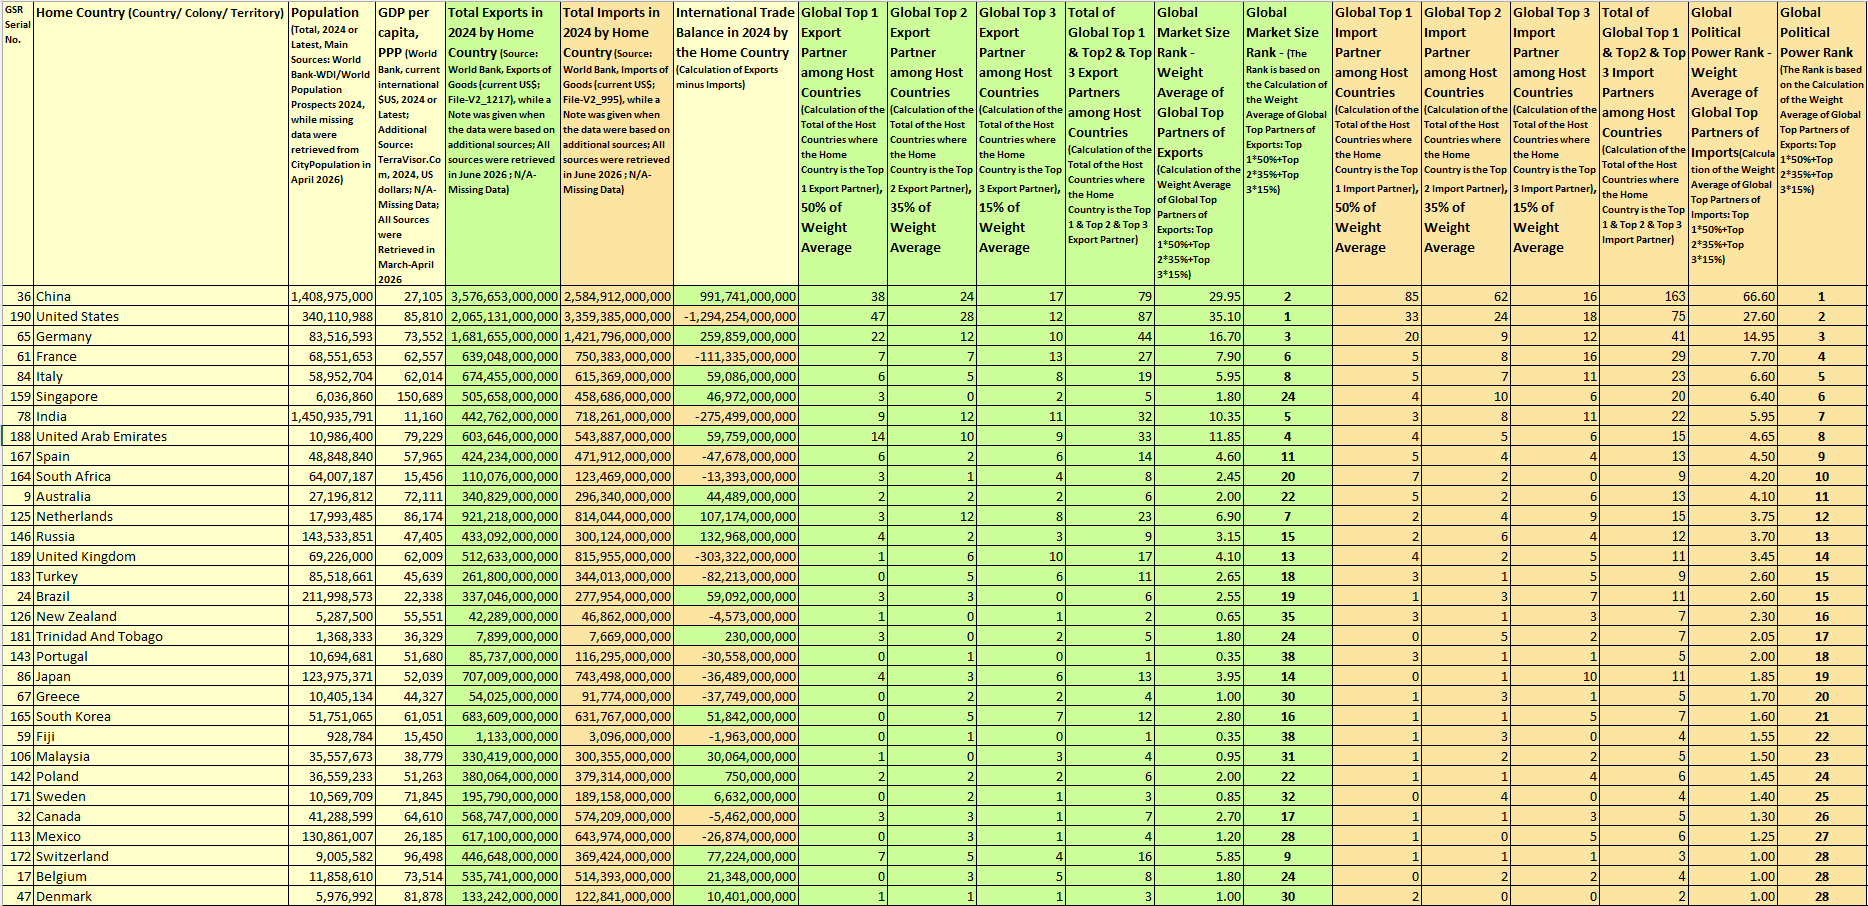
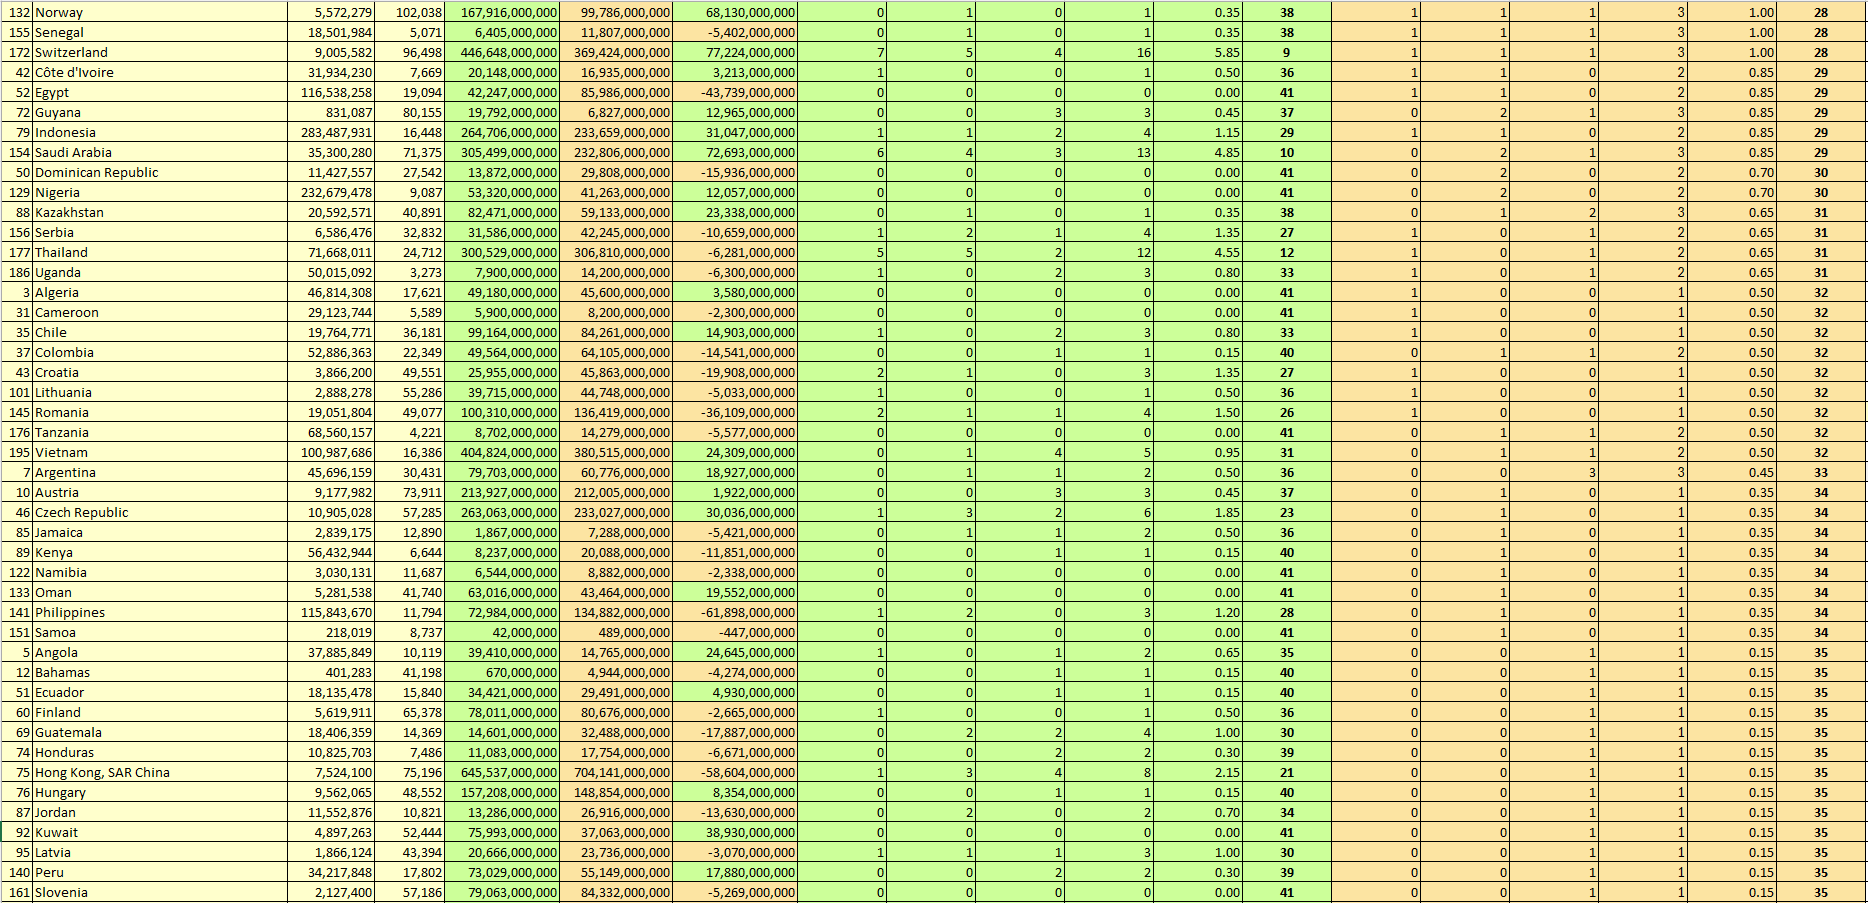
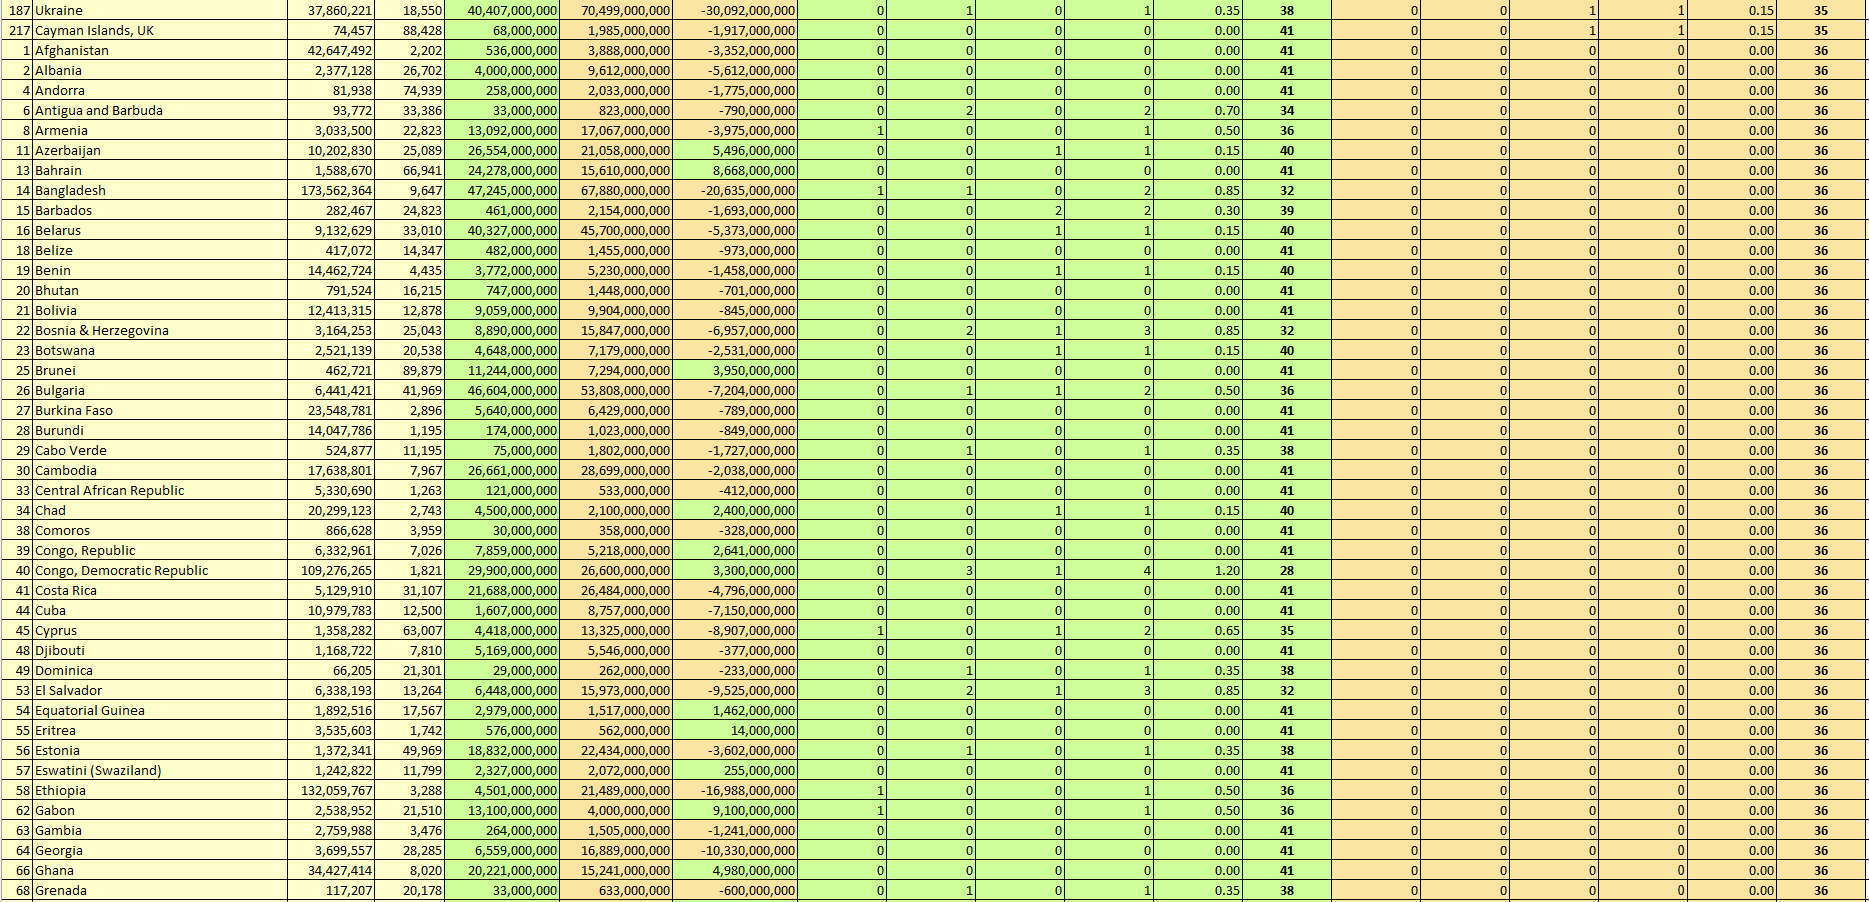
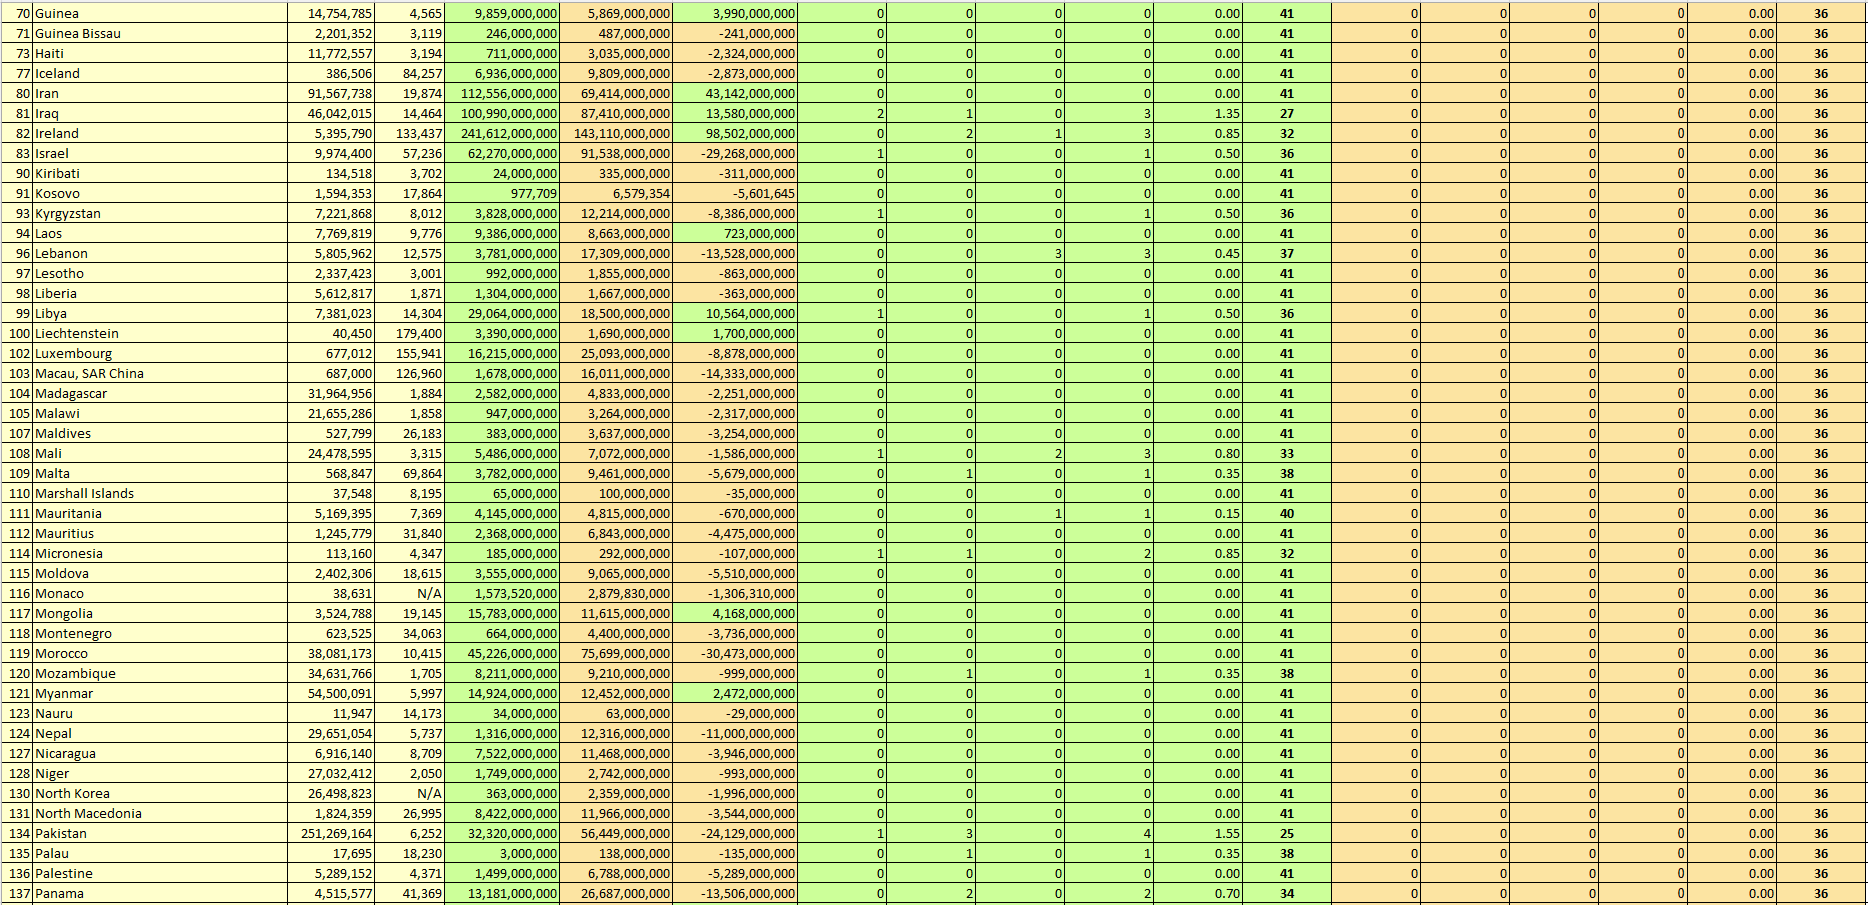
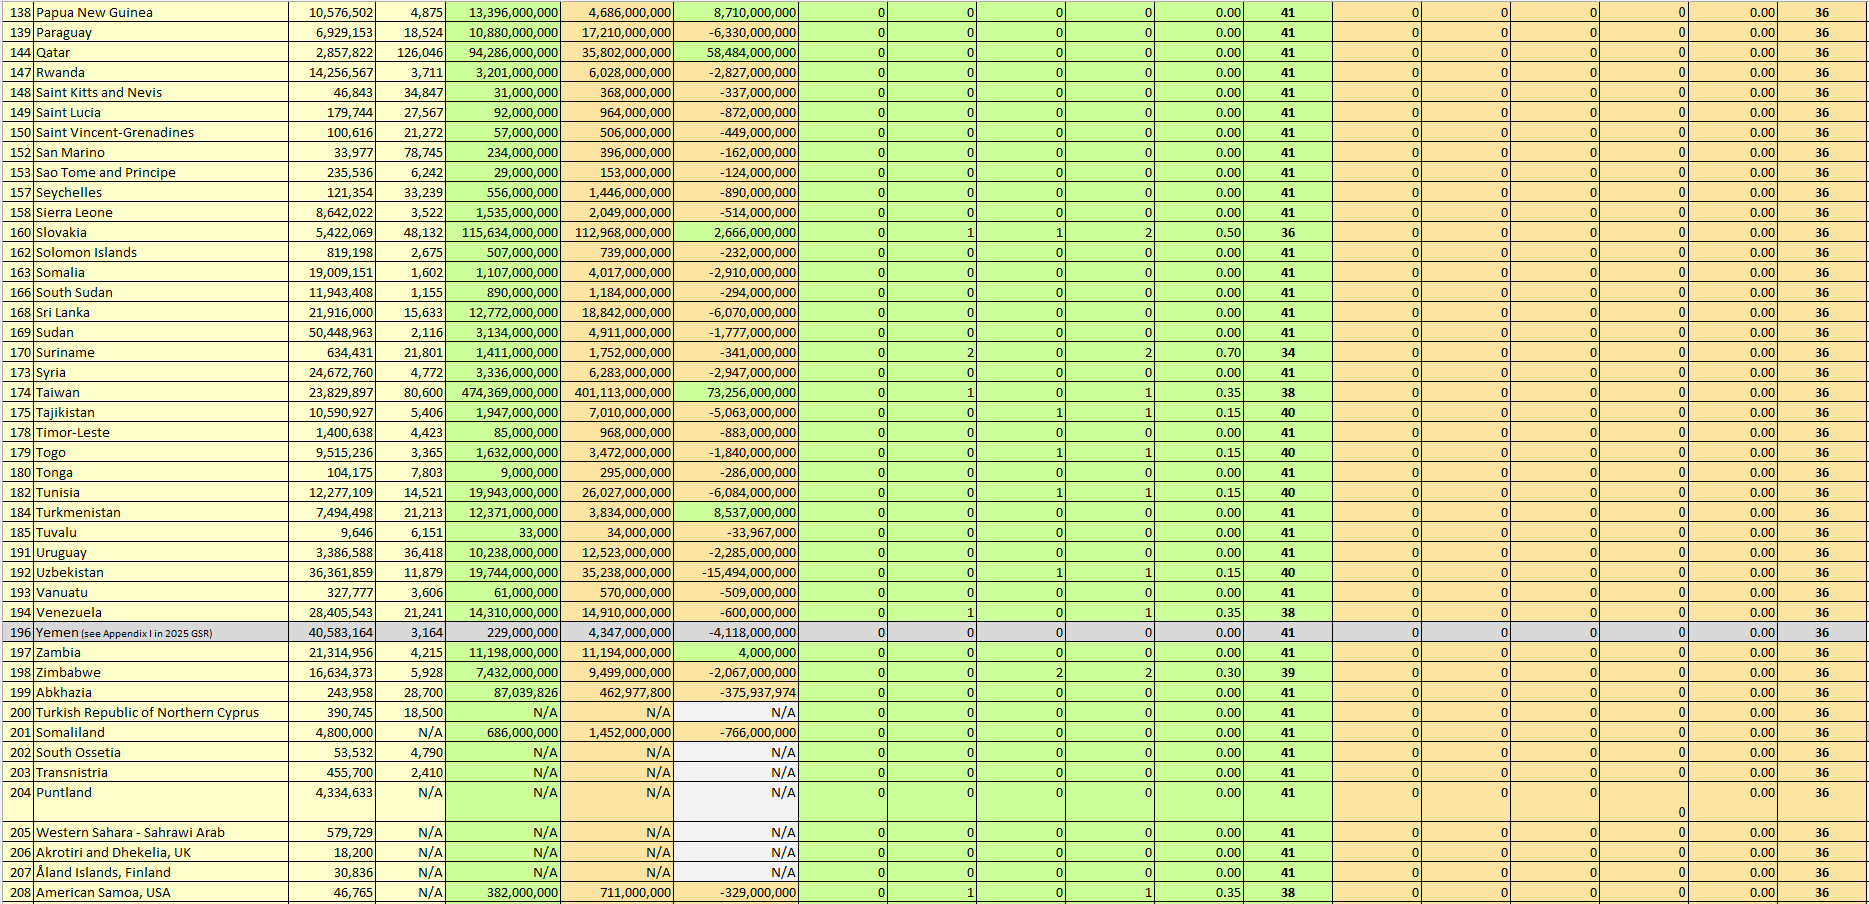
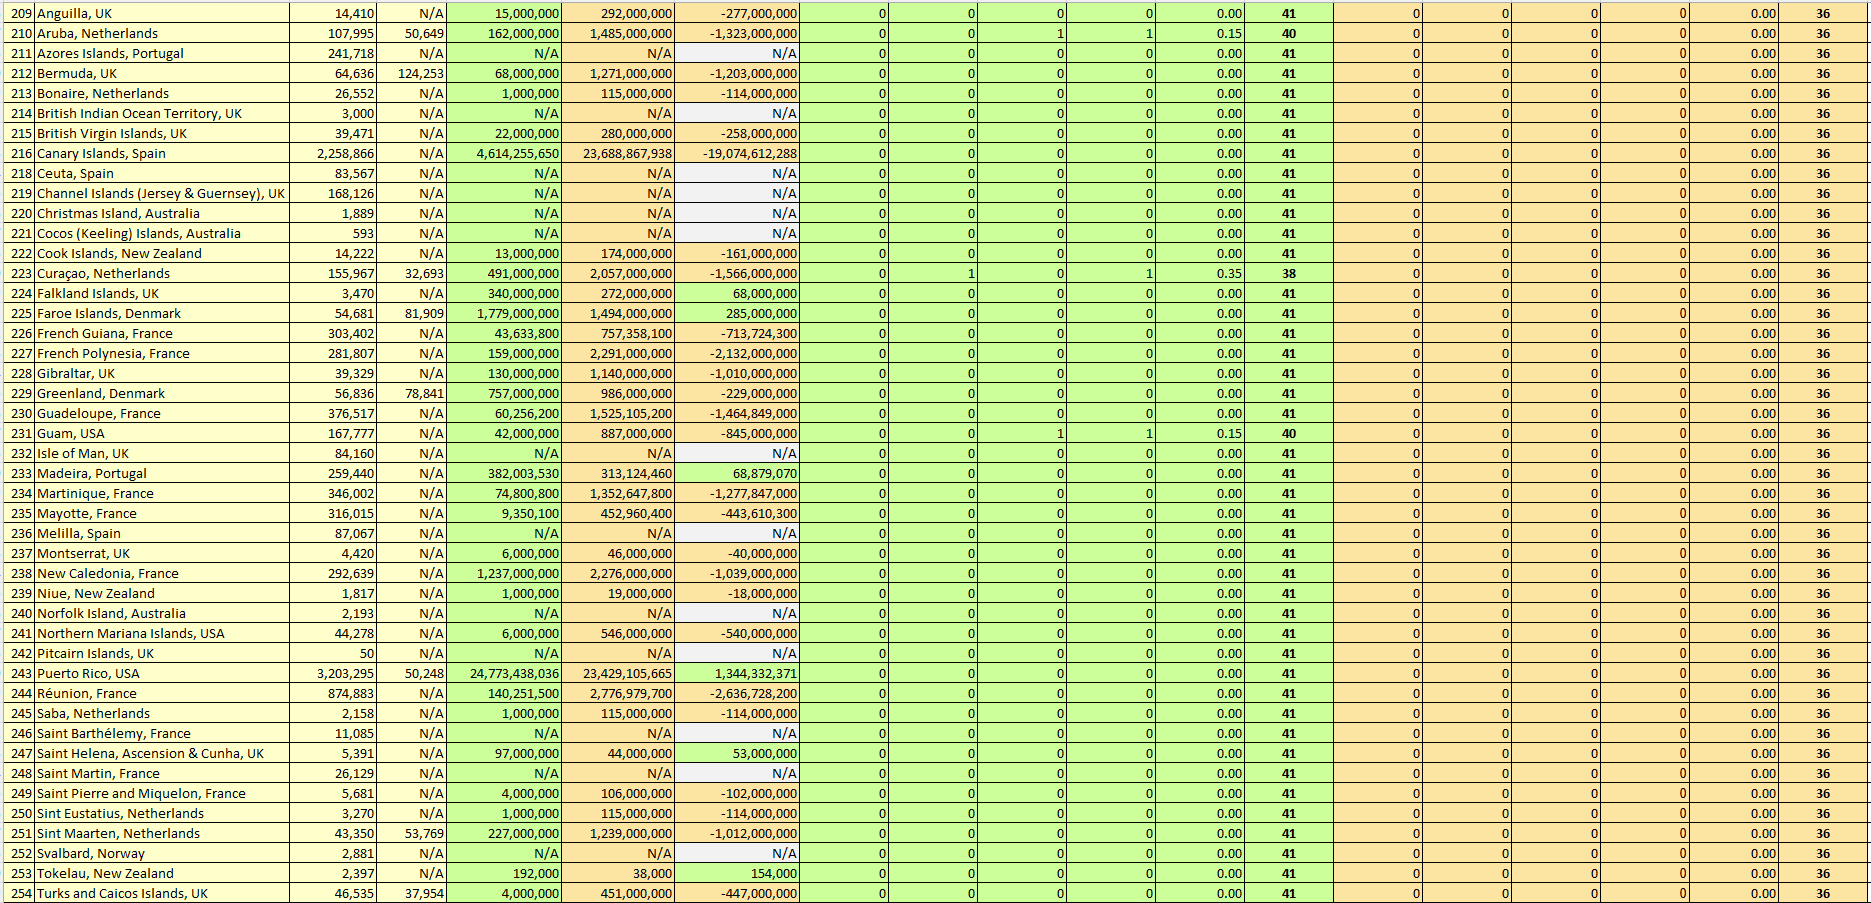

Table 2. Global Top Partners of Exports and Imports: All UN Members and Non-UN Members, sorted by Global Market Size Rank
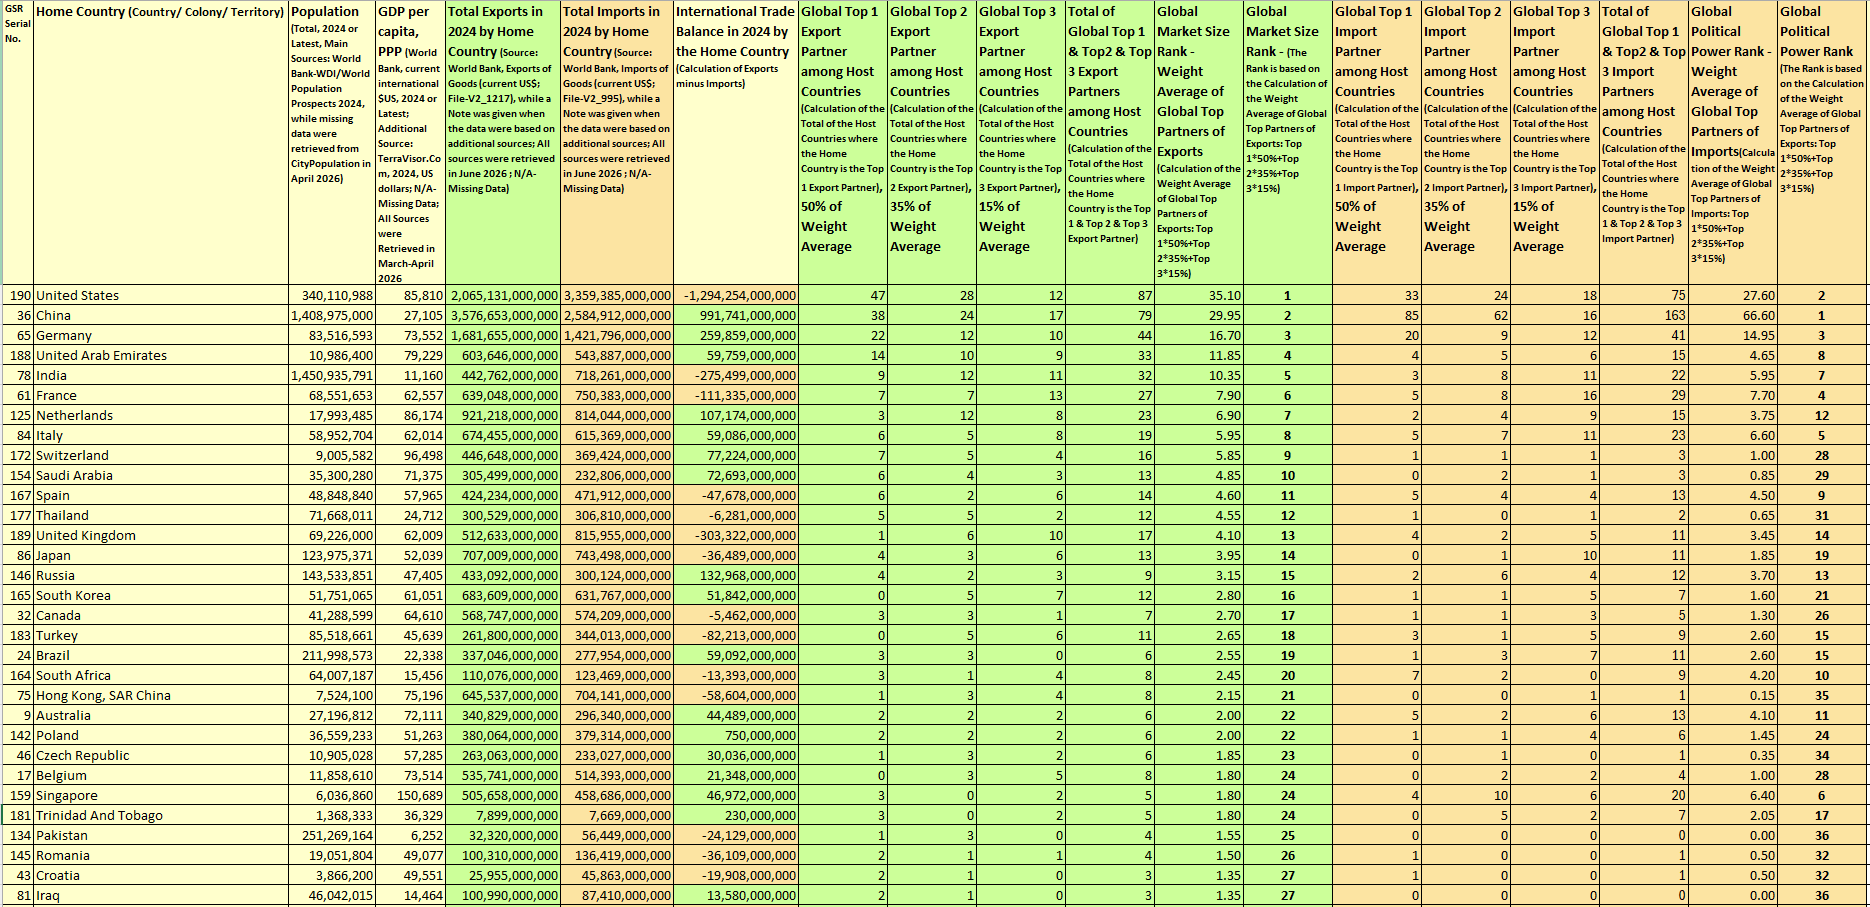
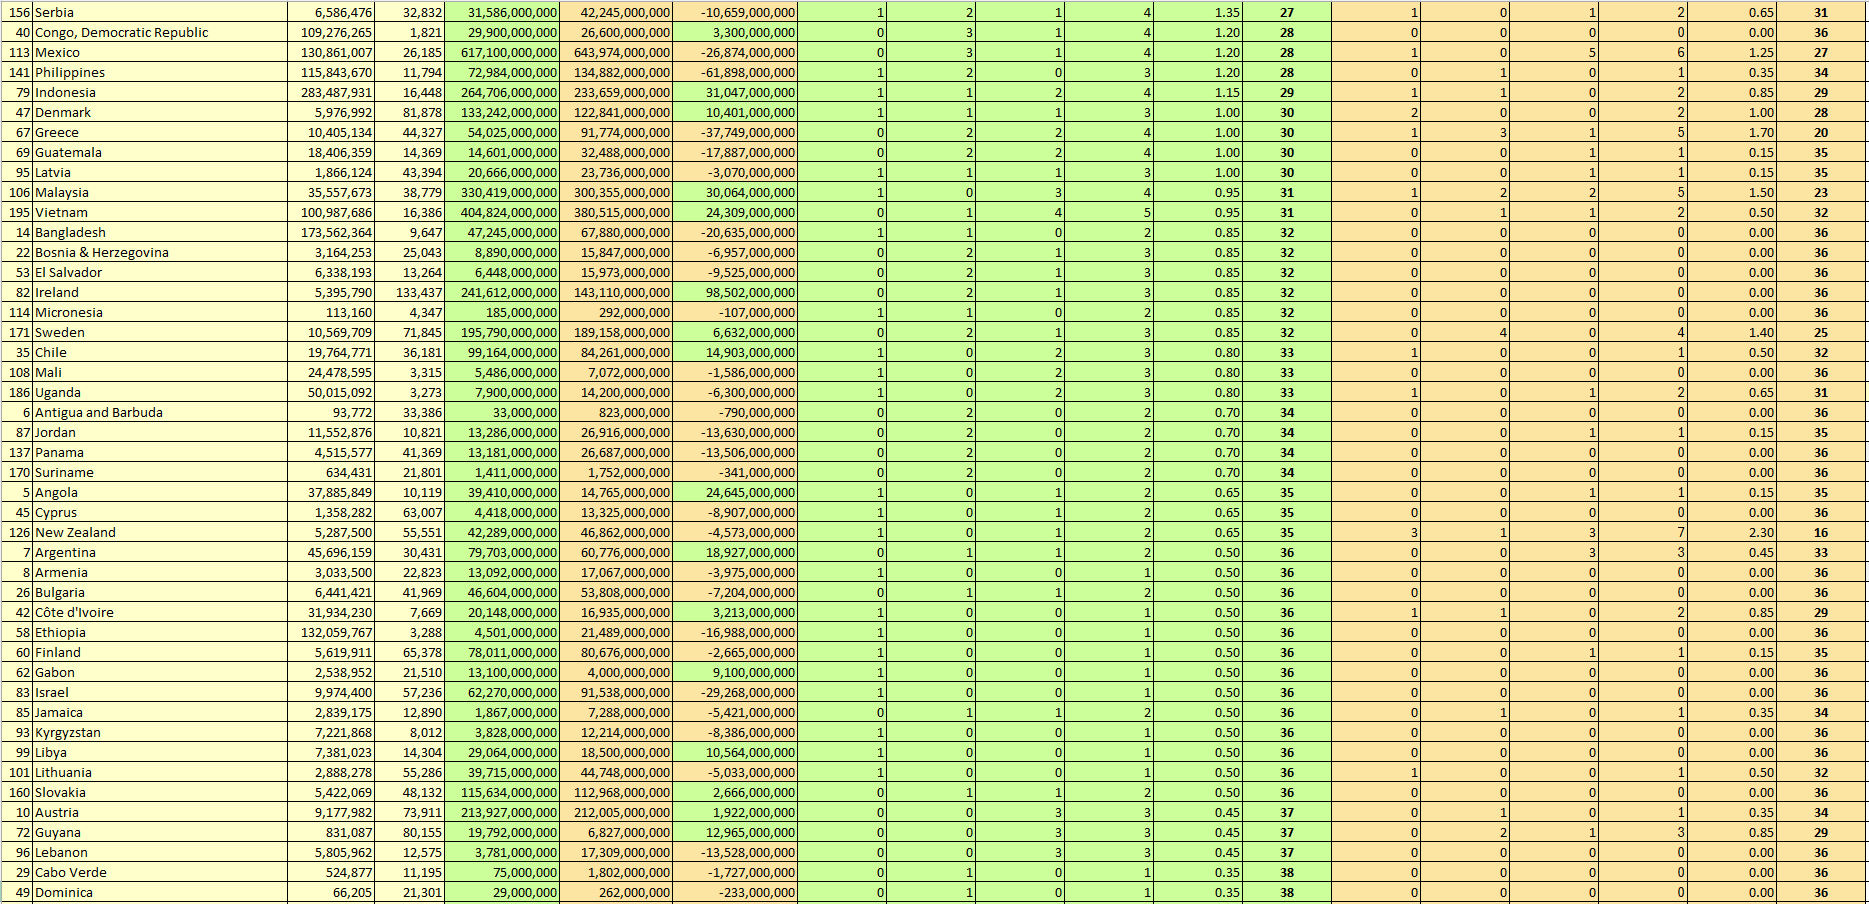
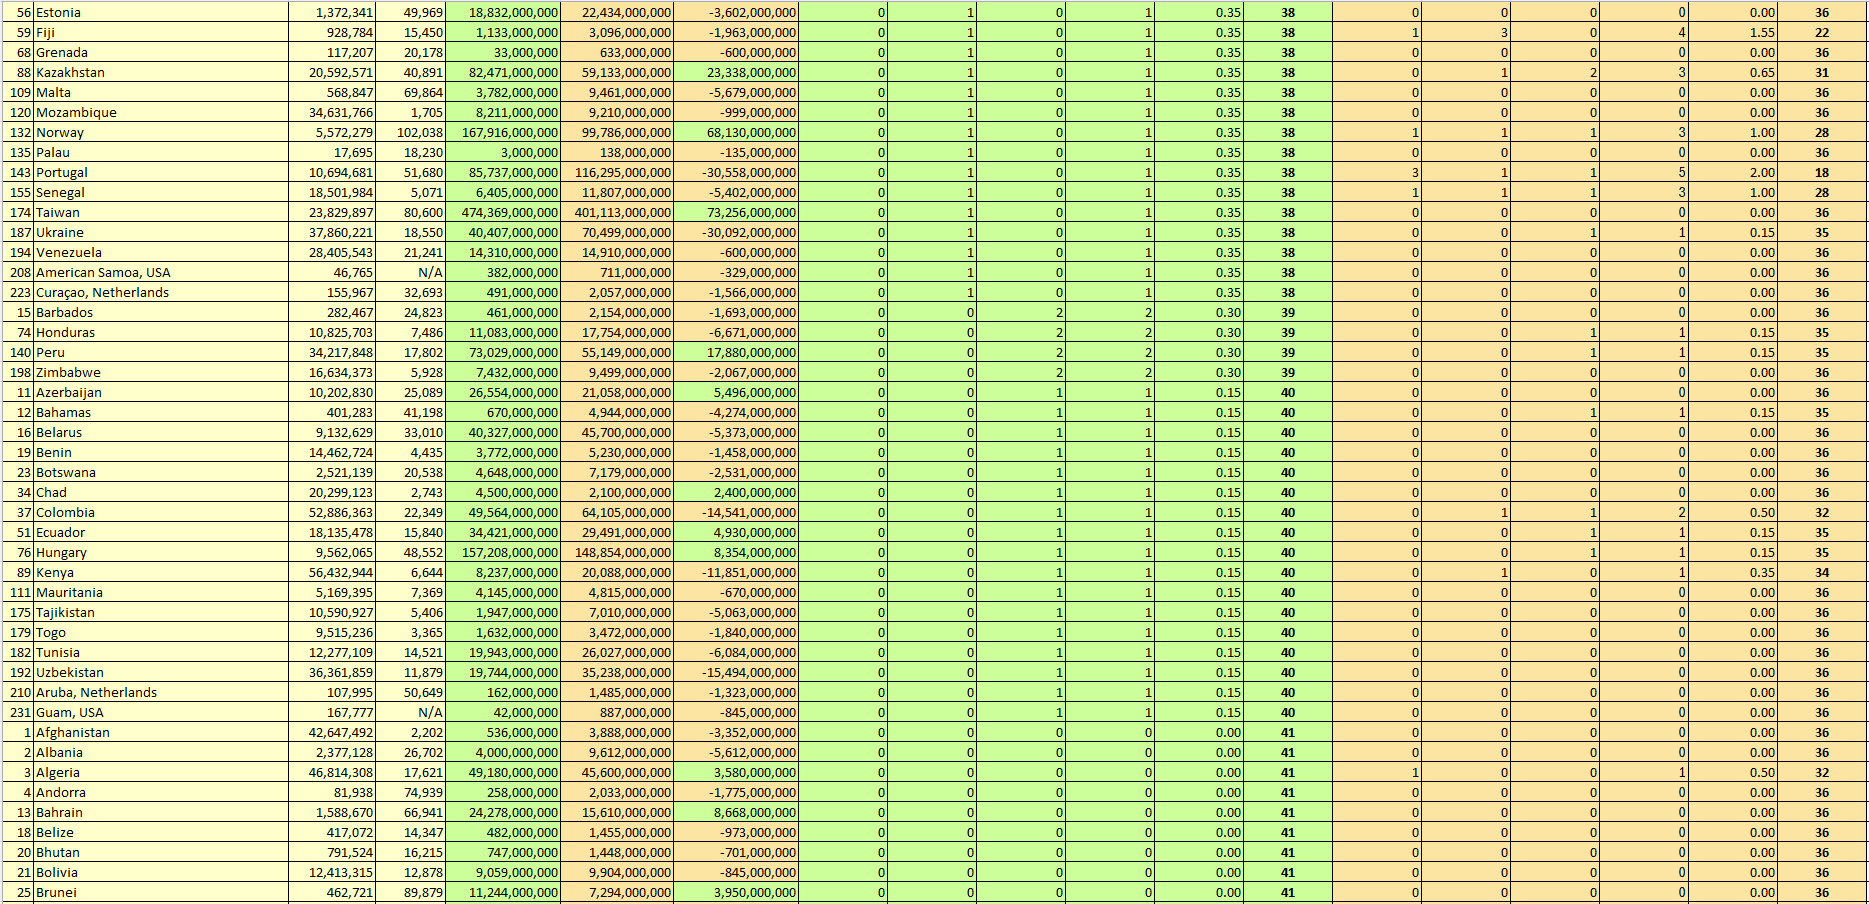
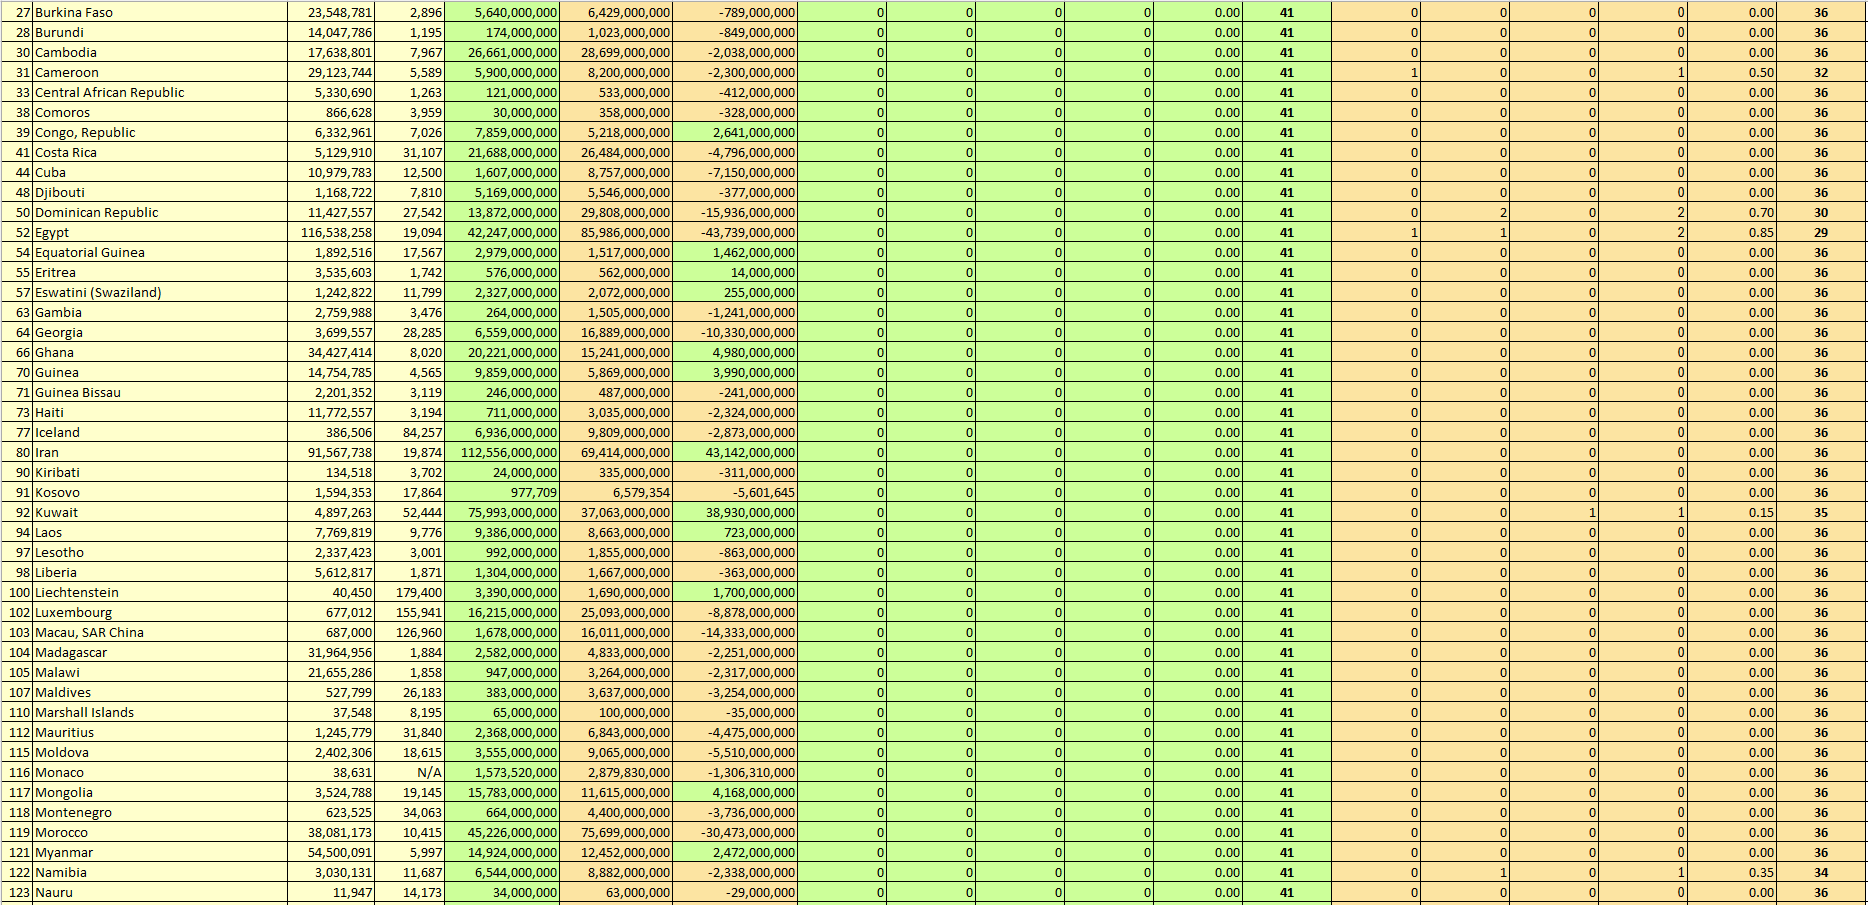
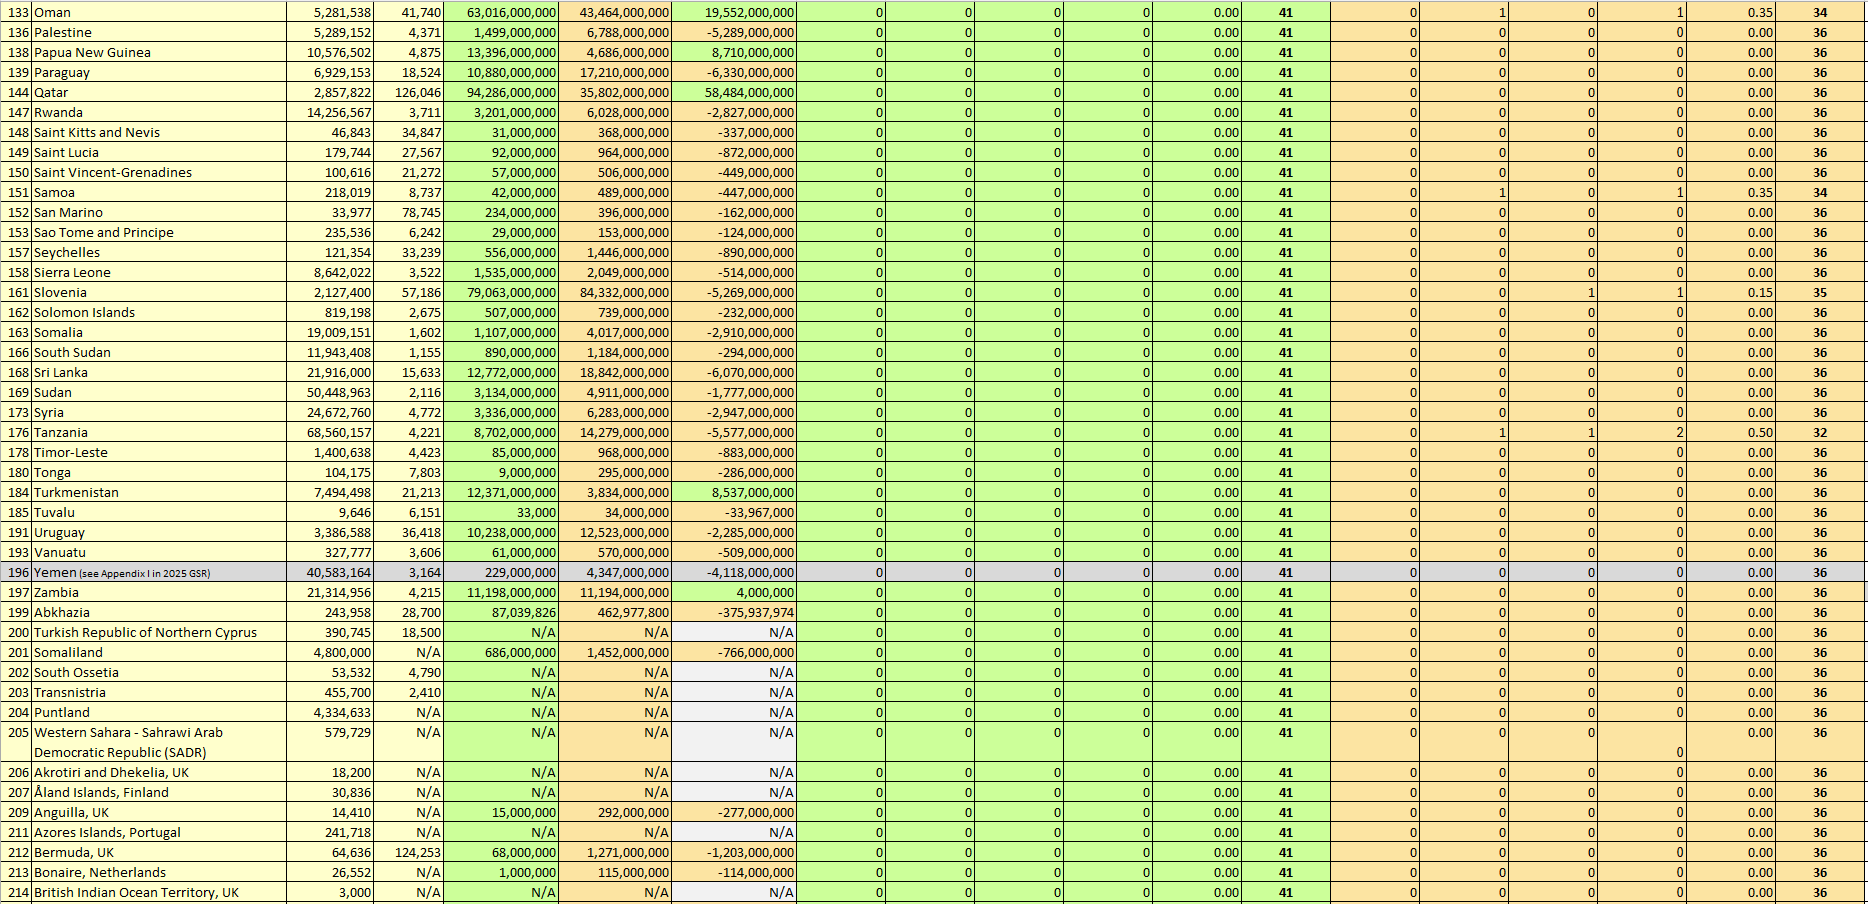
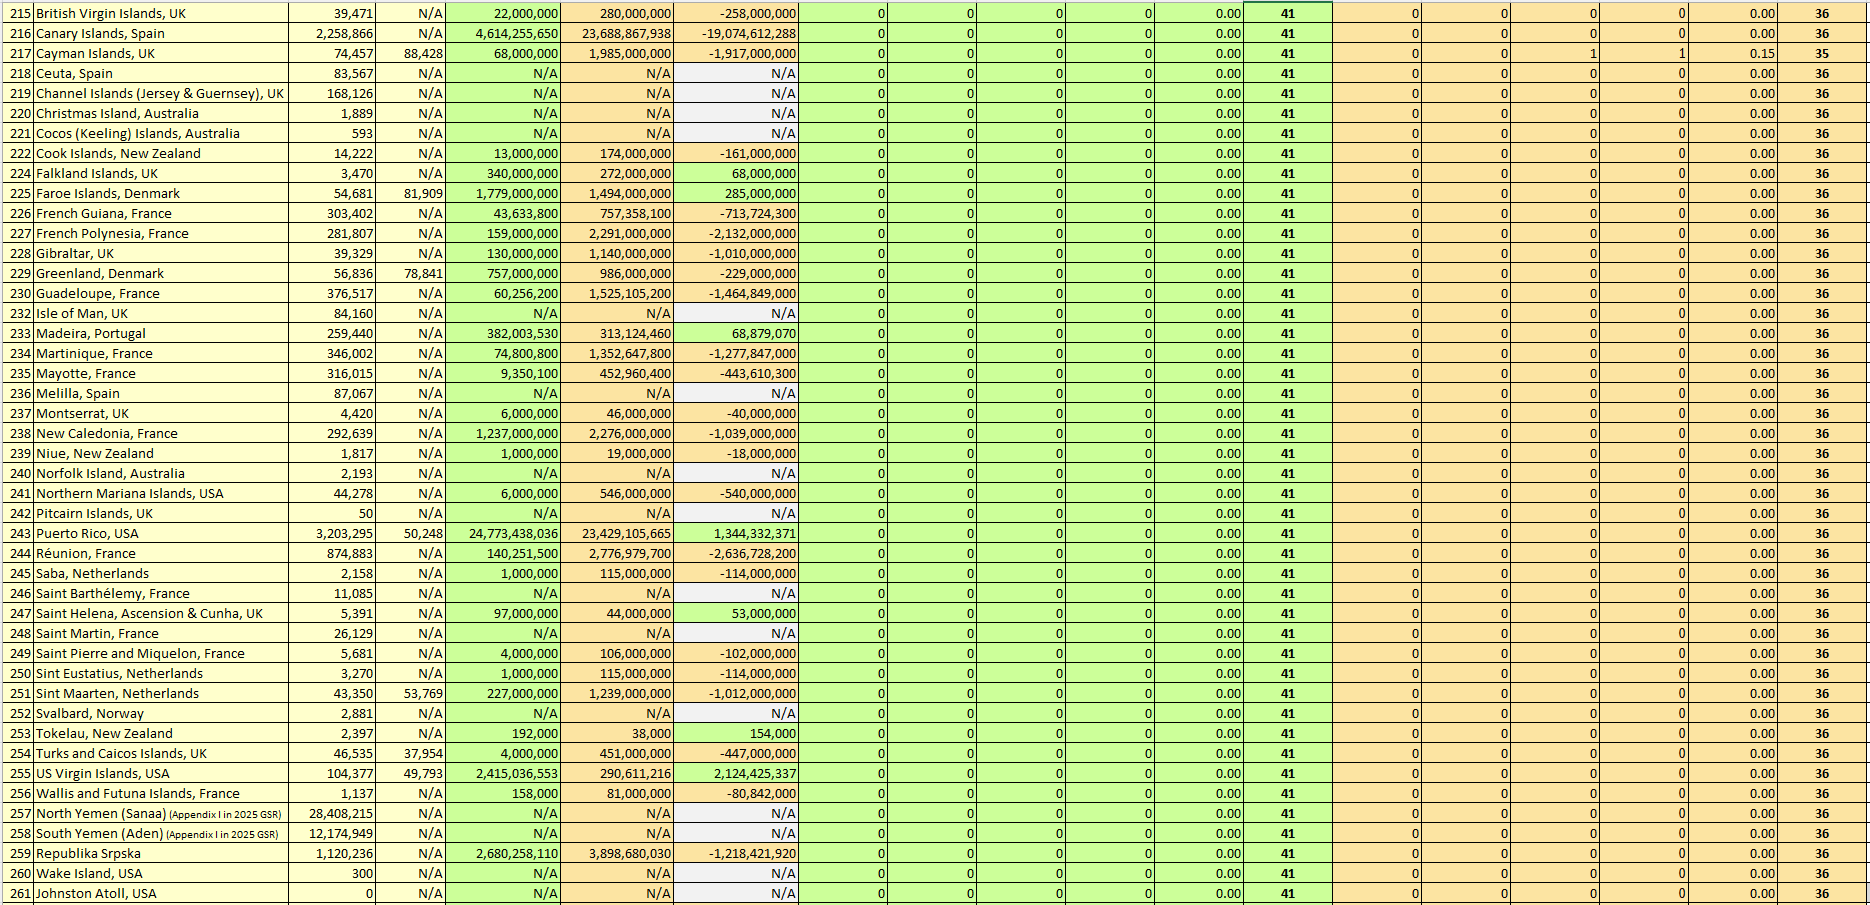

Table 3. Global Top Partners of Exports and Imports: All UN Members and Non-UN Members, sorted by Alphabetical Order
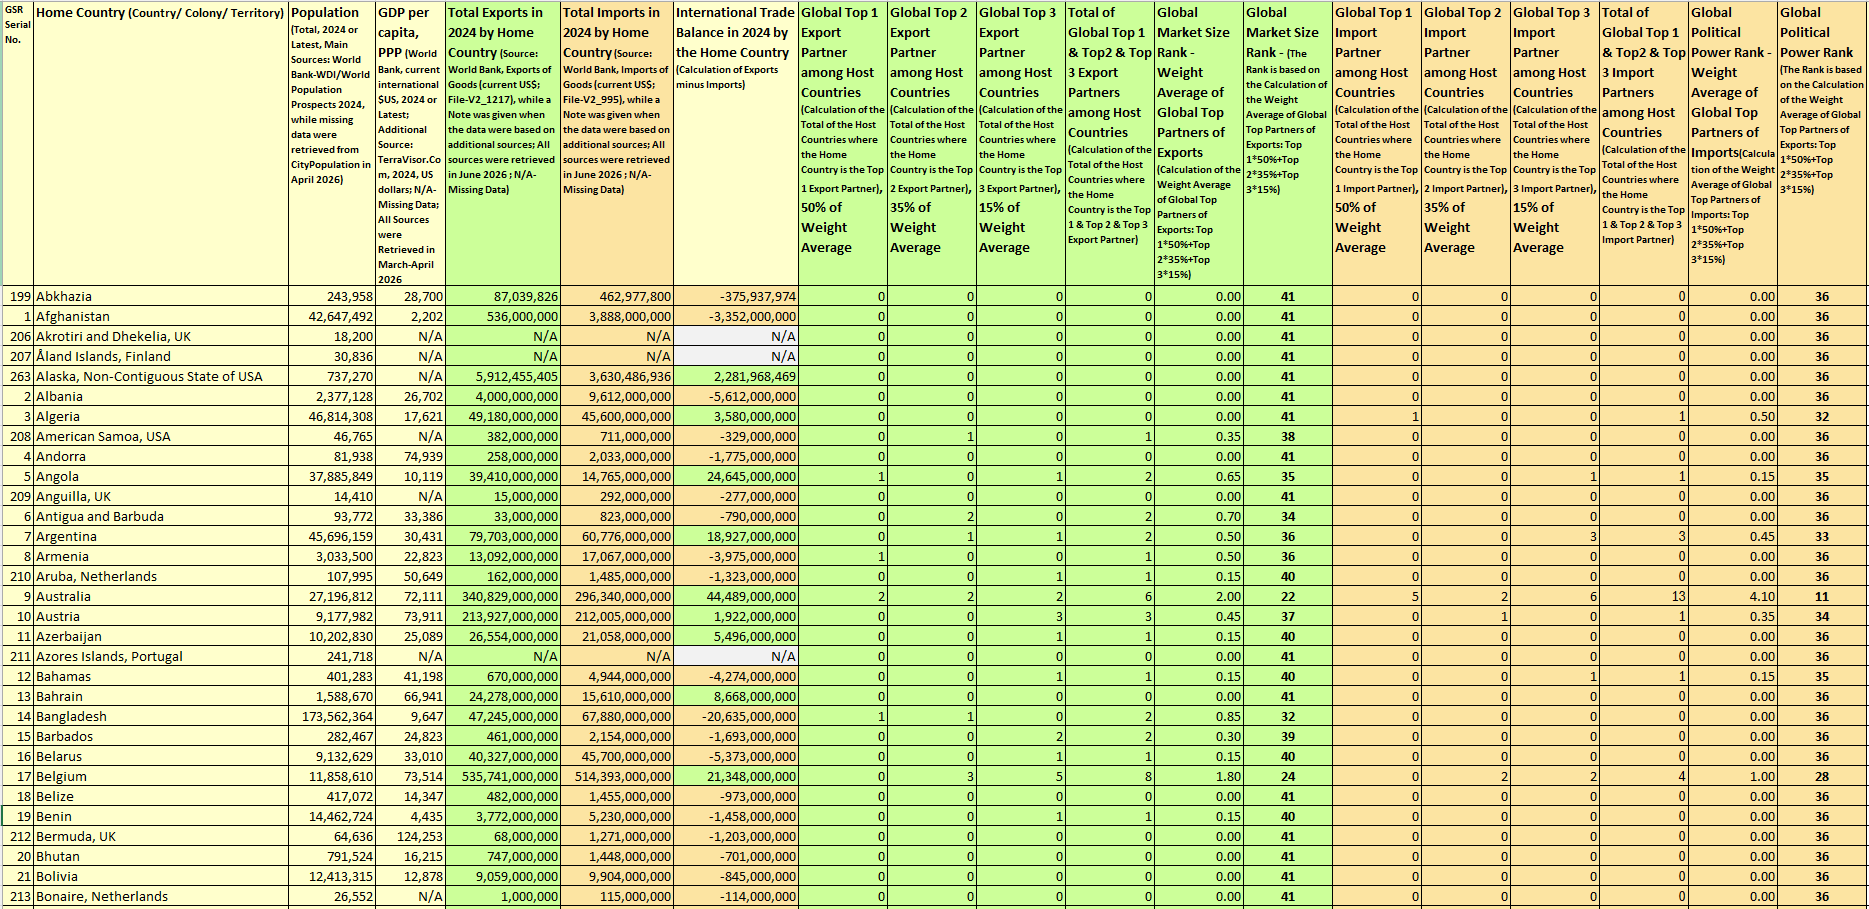
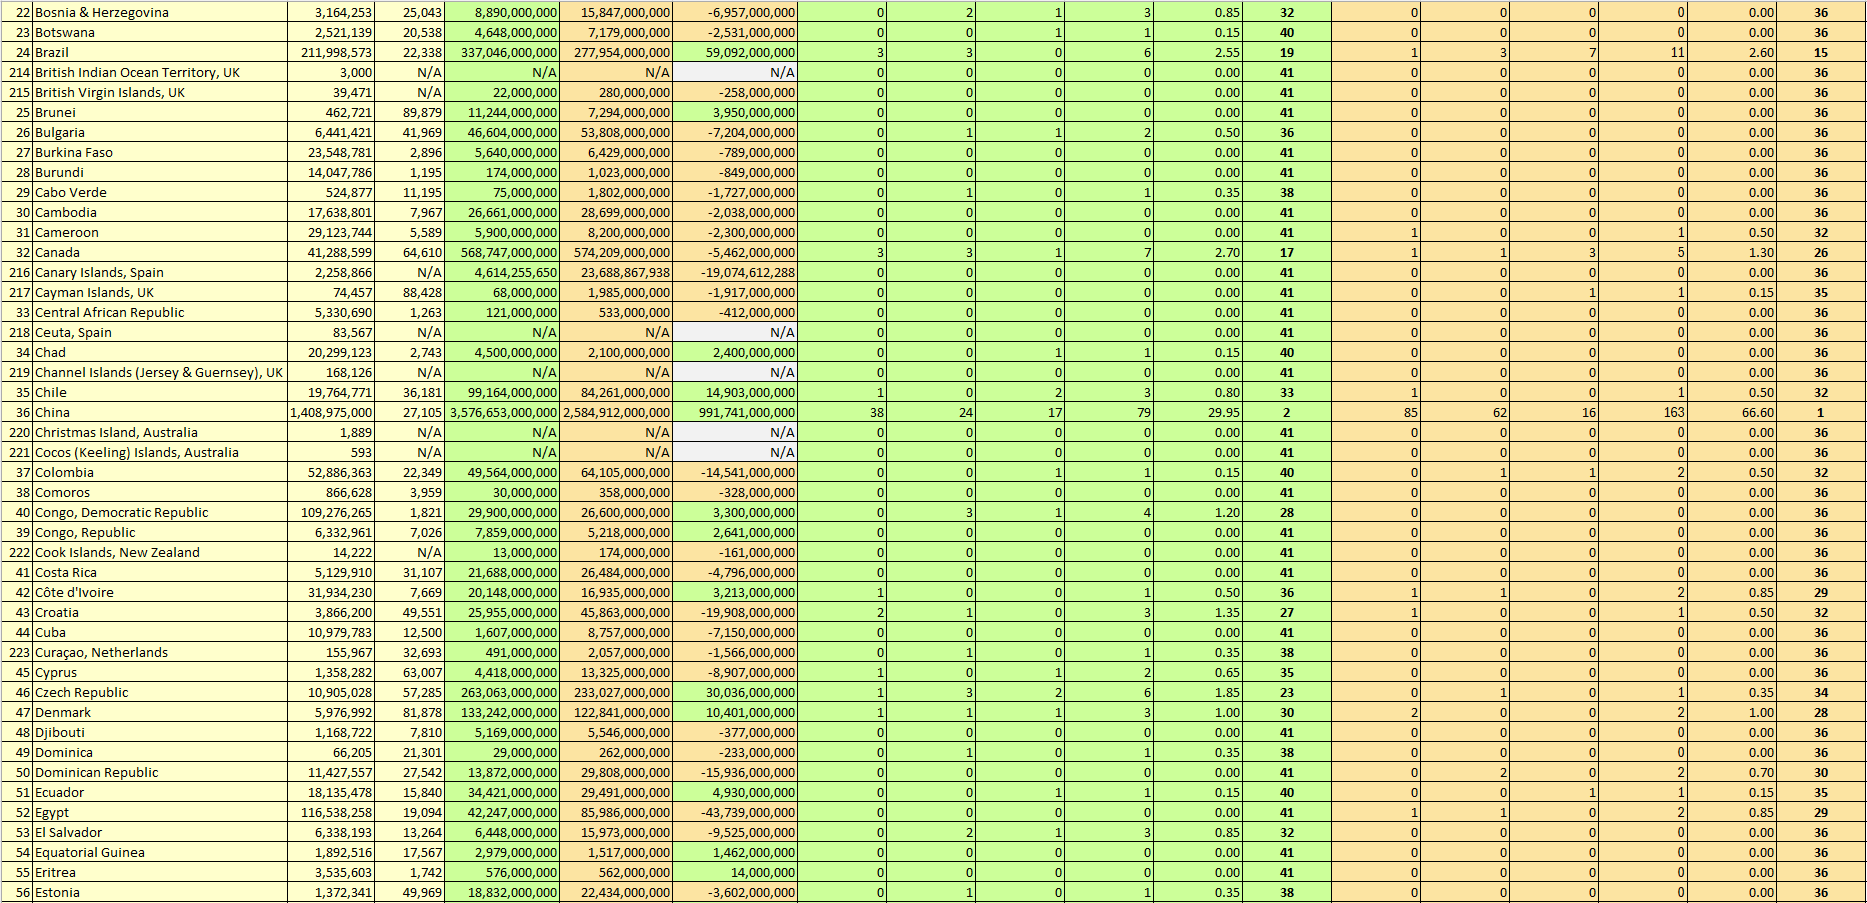
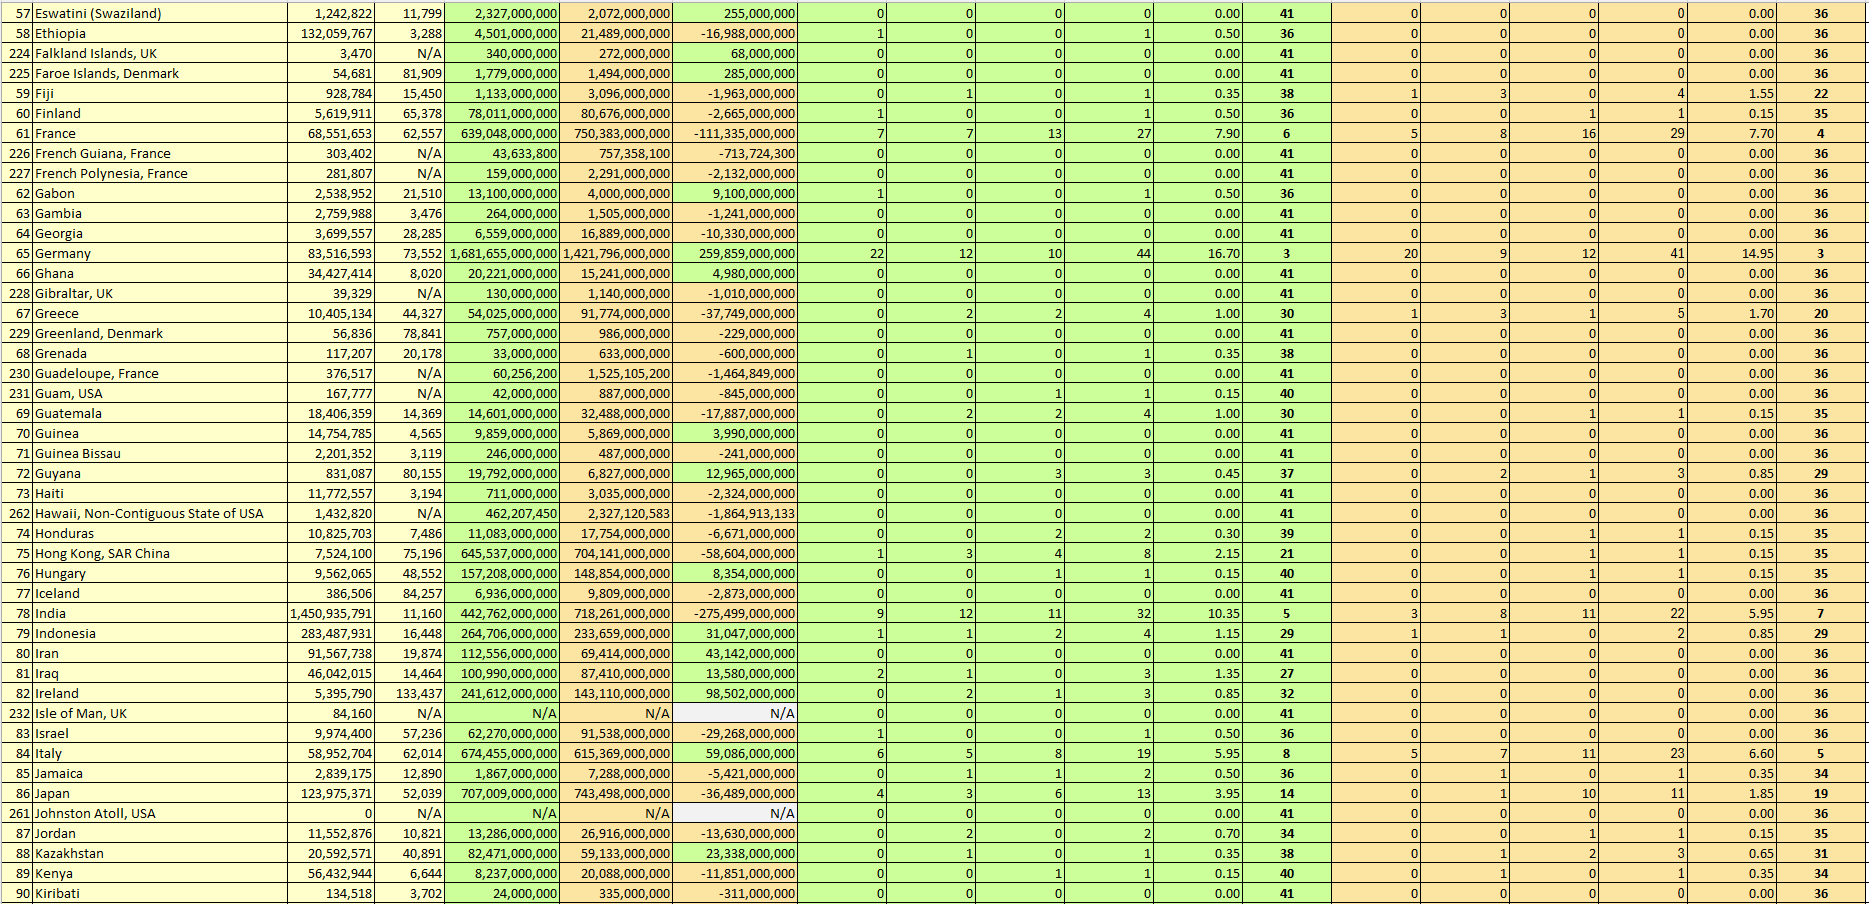
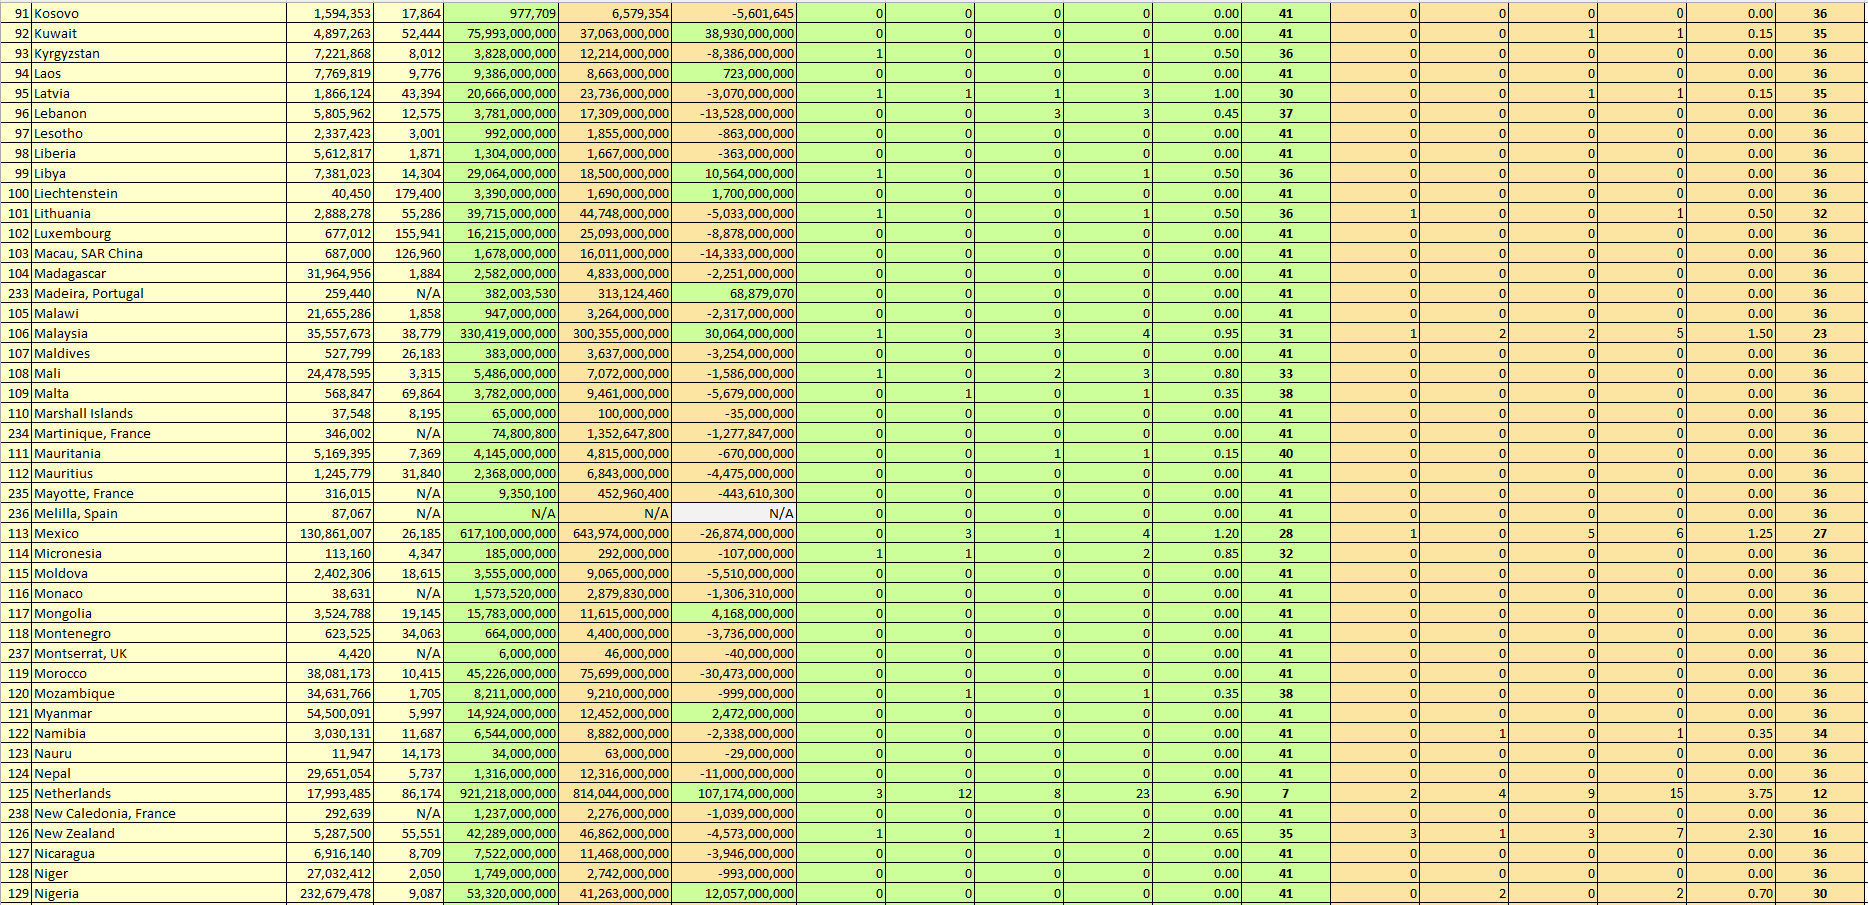
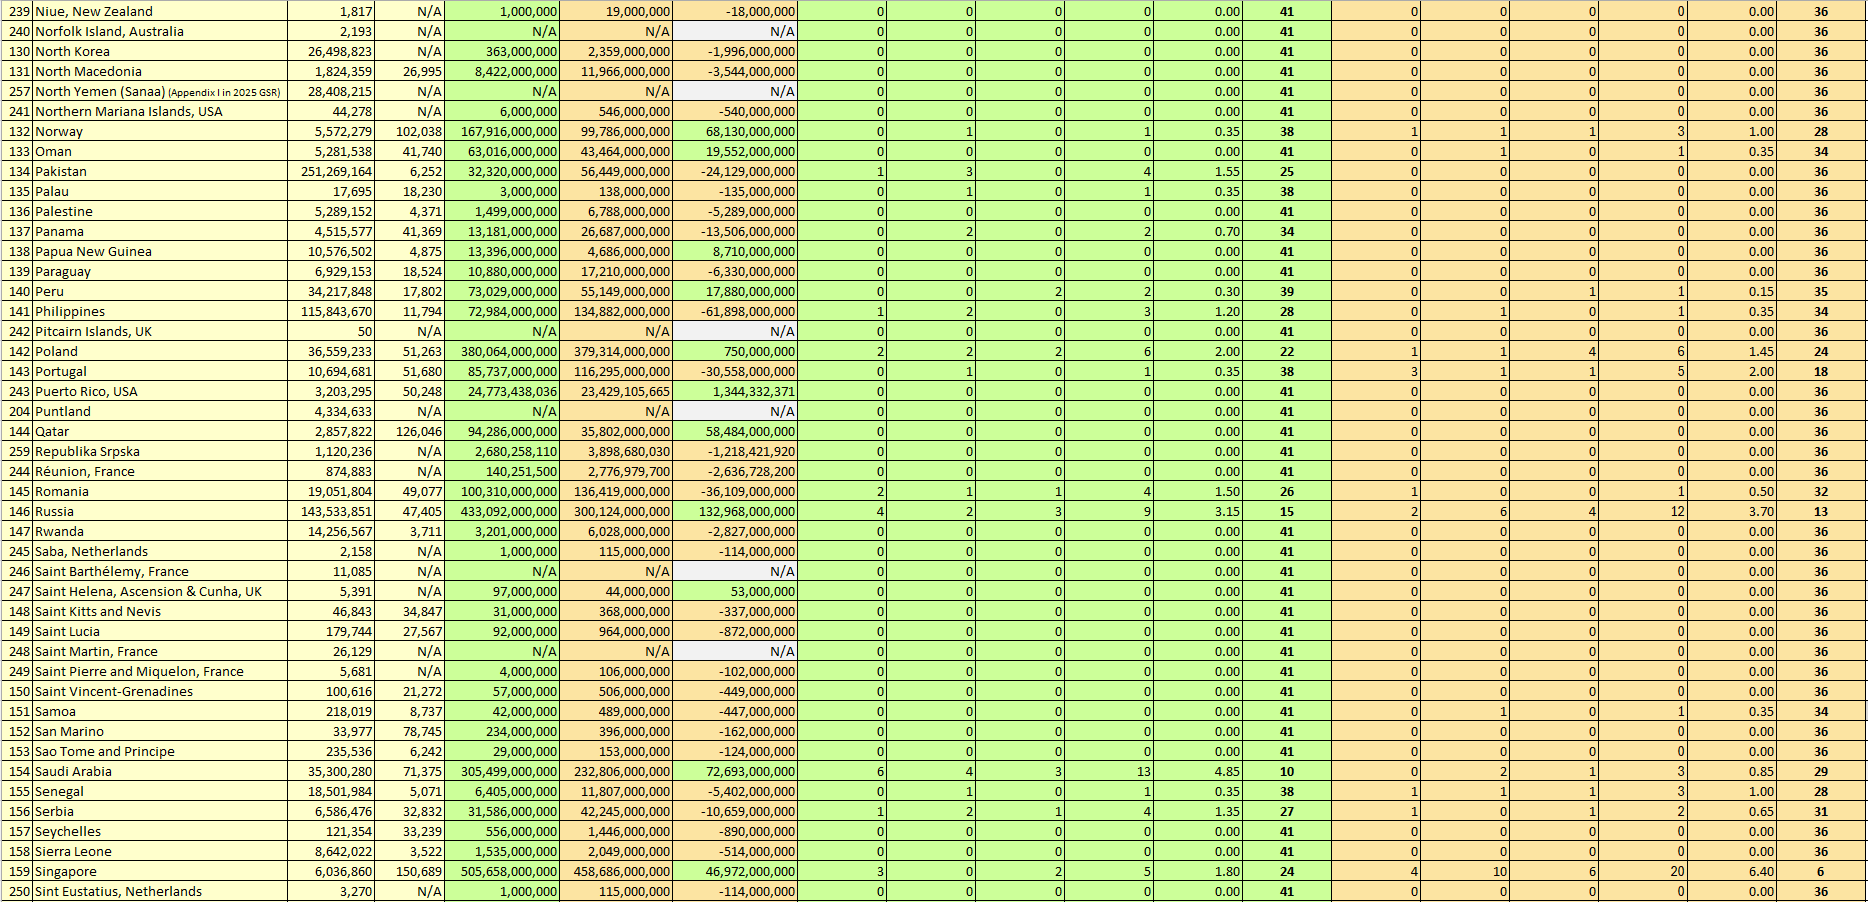
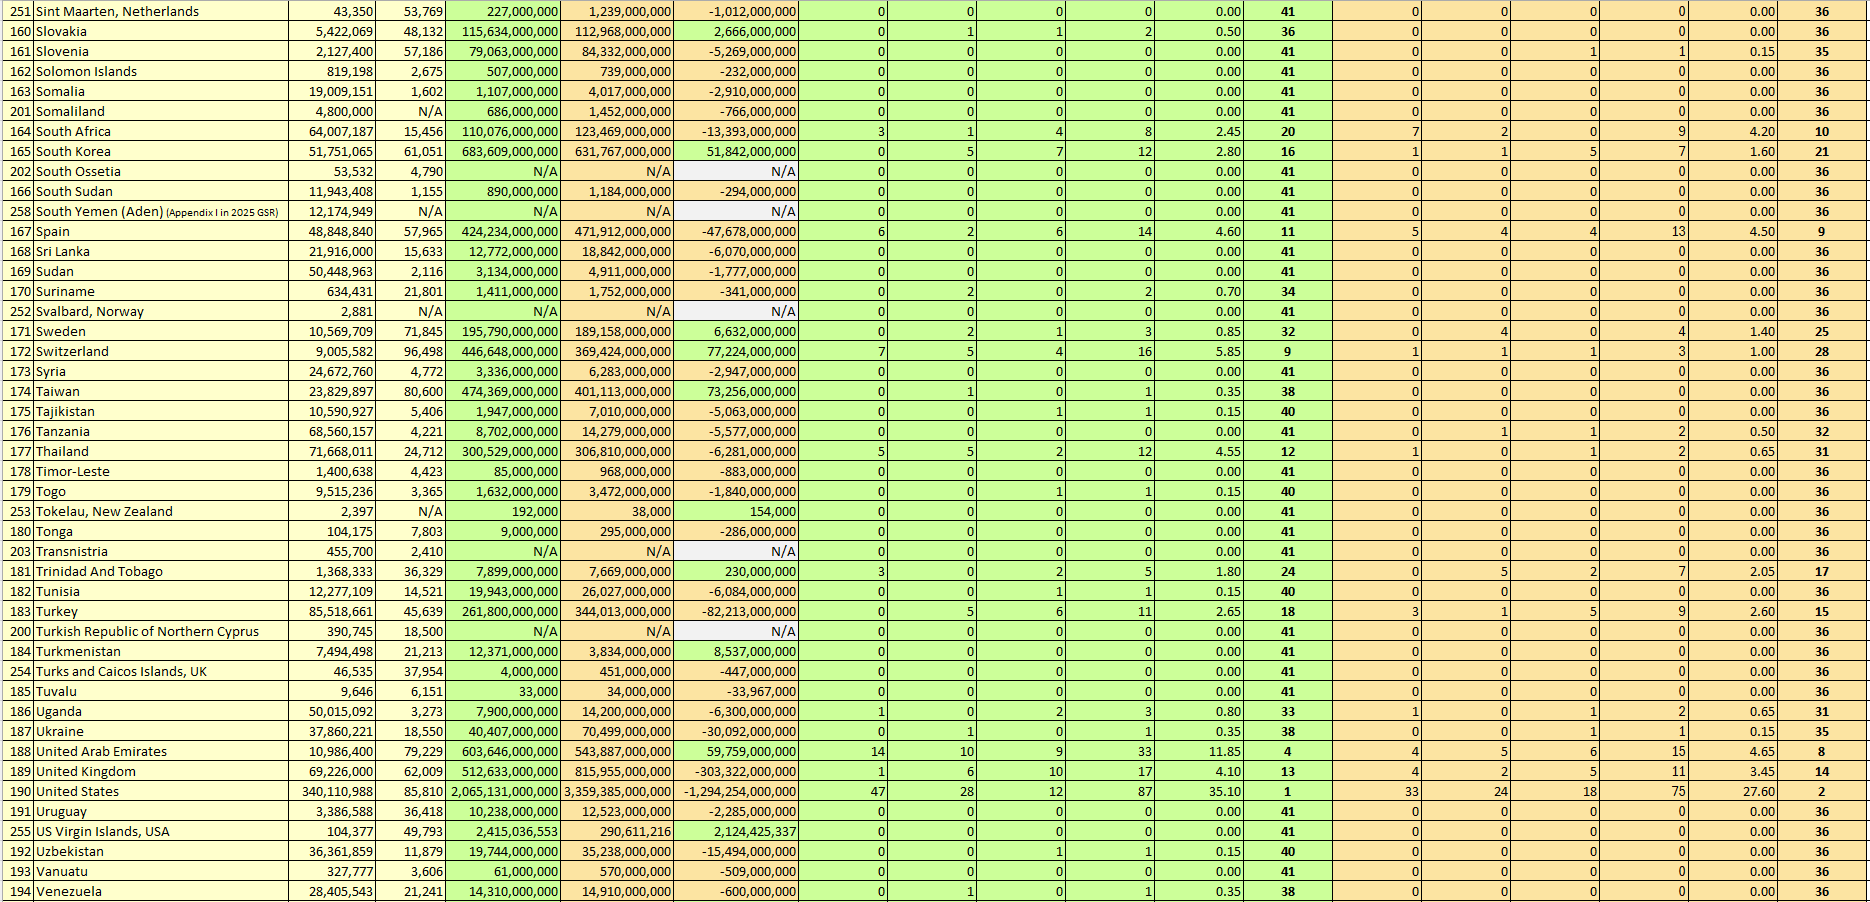

Section 3.3 Analysis of Top Partners of the Home Country versus Global Top Partners in 2024: All UN Members and Non-UN Members
Section 3.3.1 Analysis of Top Import Partners of the Home Country versus Global Top Import Partners
Table 4. Top Import Partners of the Home Country versus Global Top Import Partners: All UN Members and Non-UN Members, sorted by Global Political Power Rank
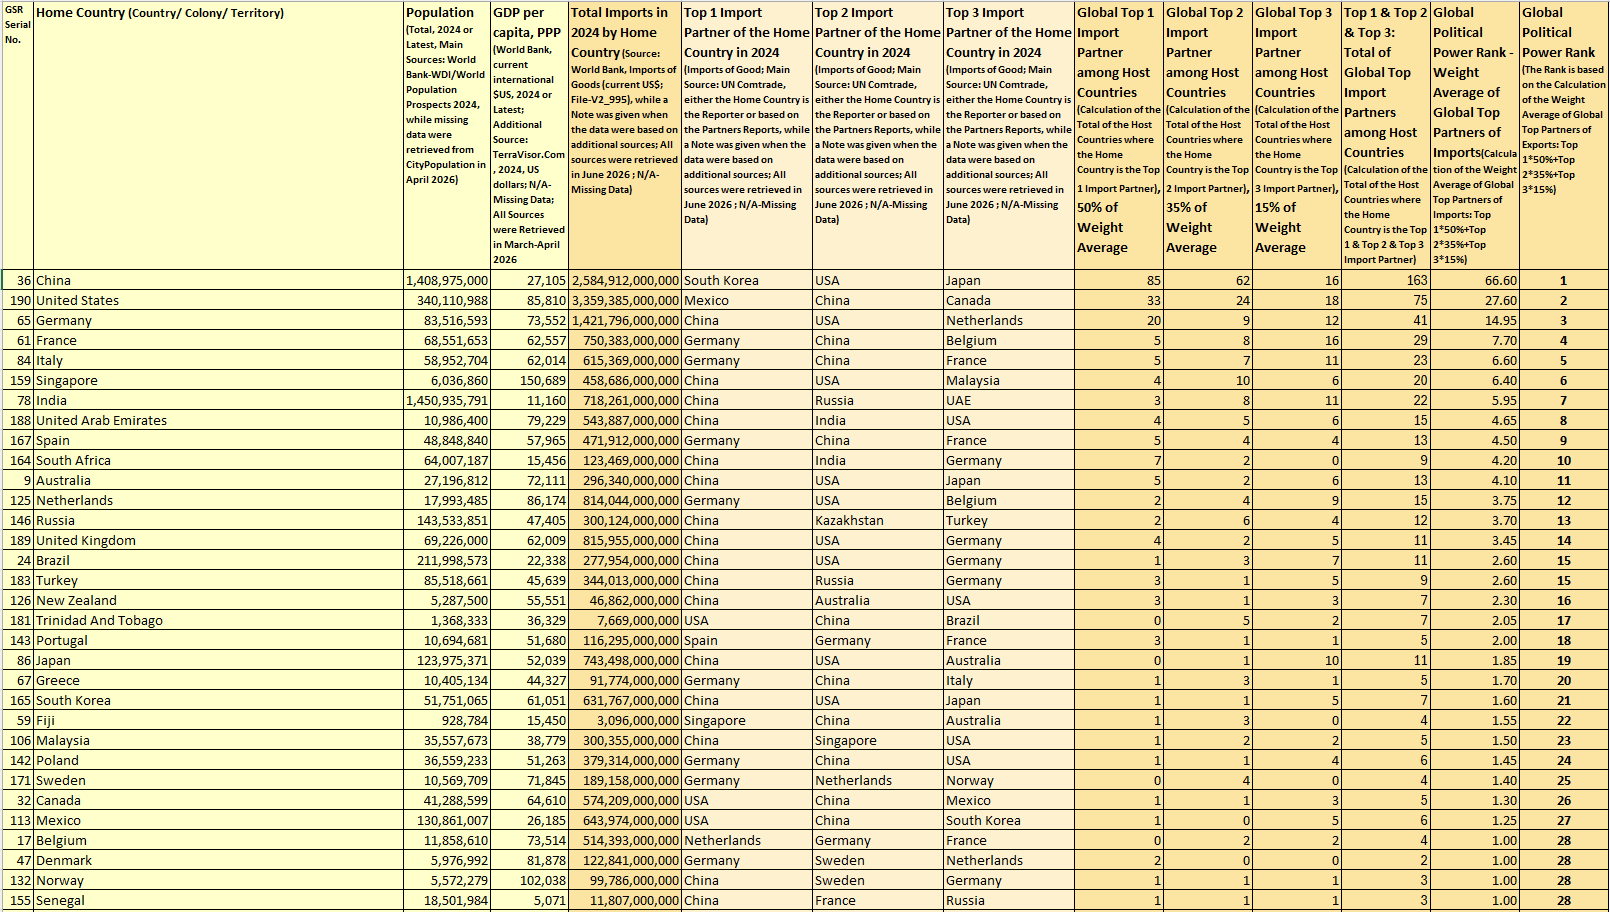
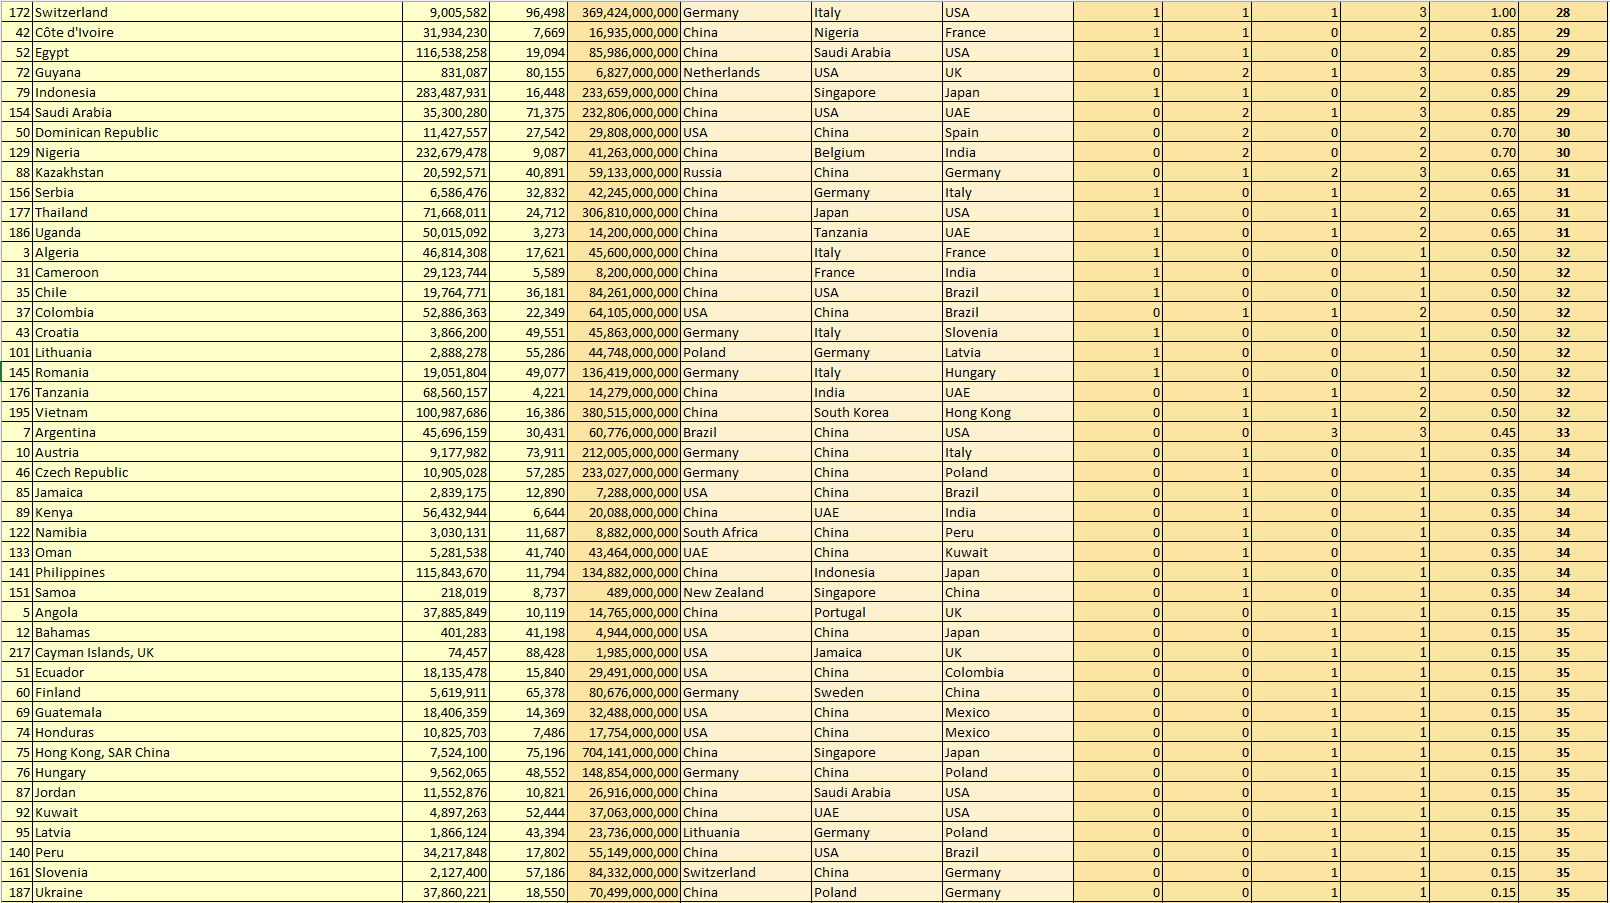
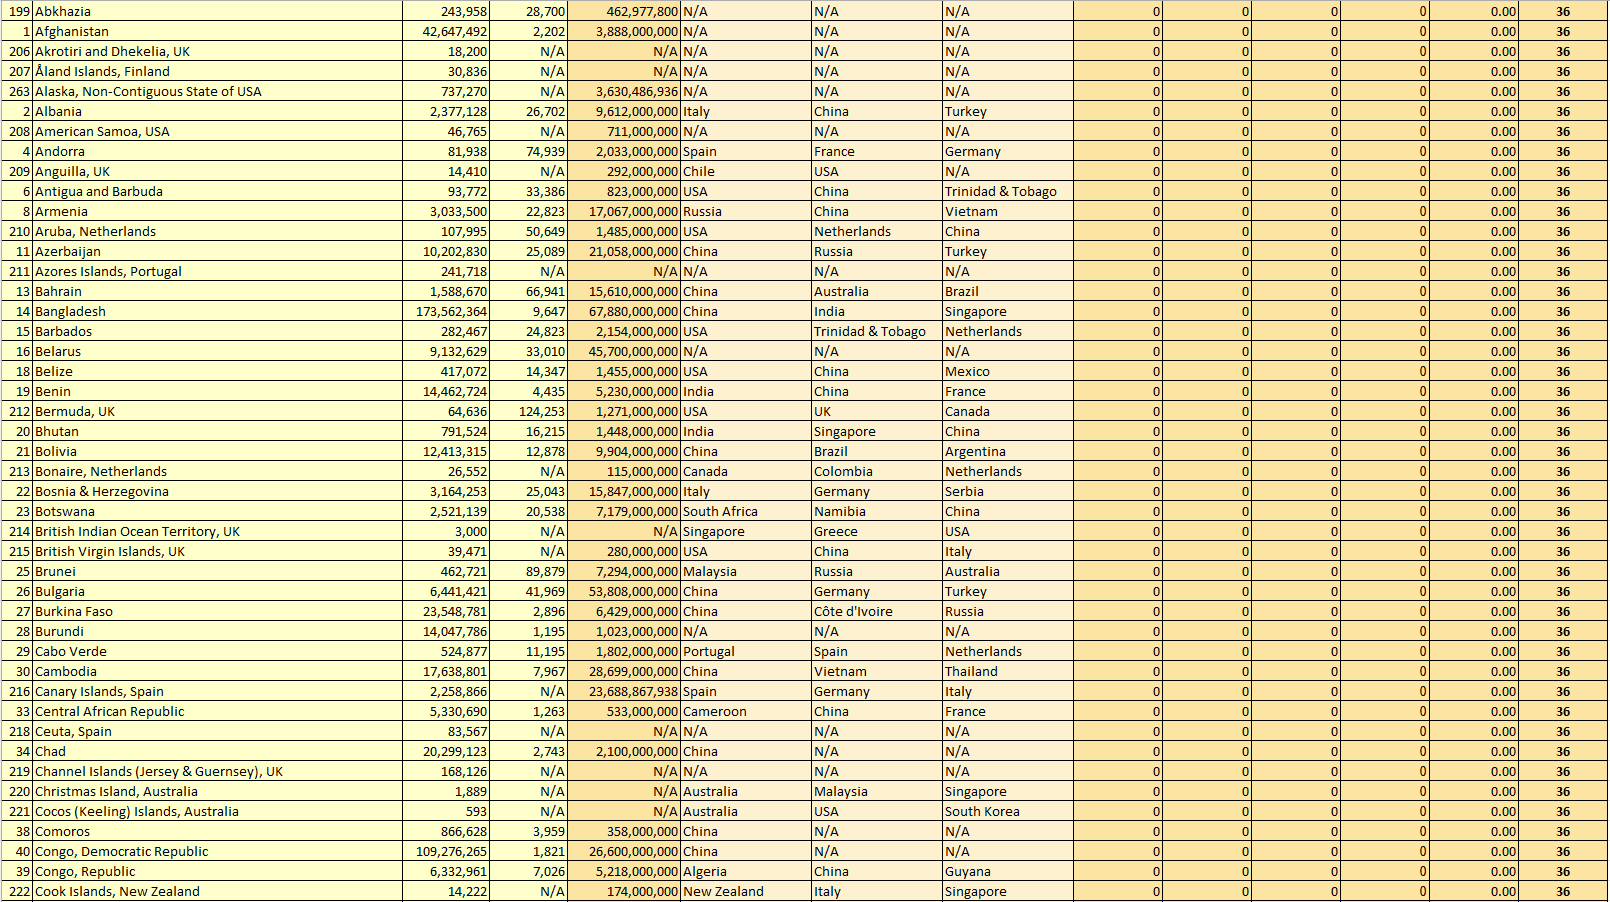
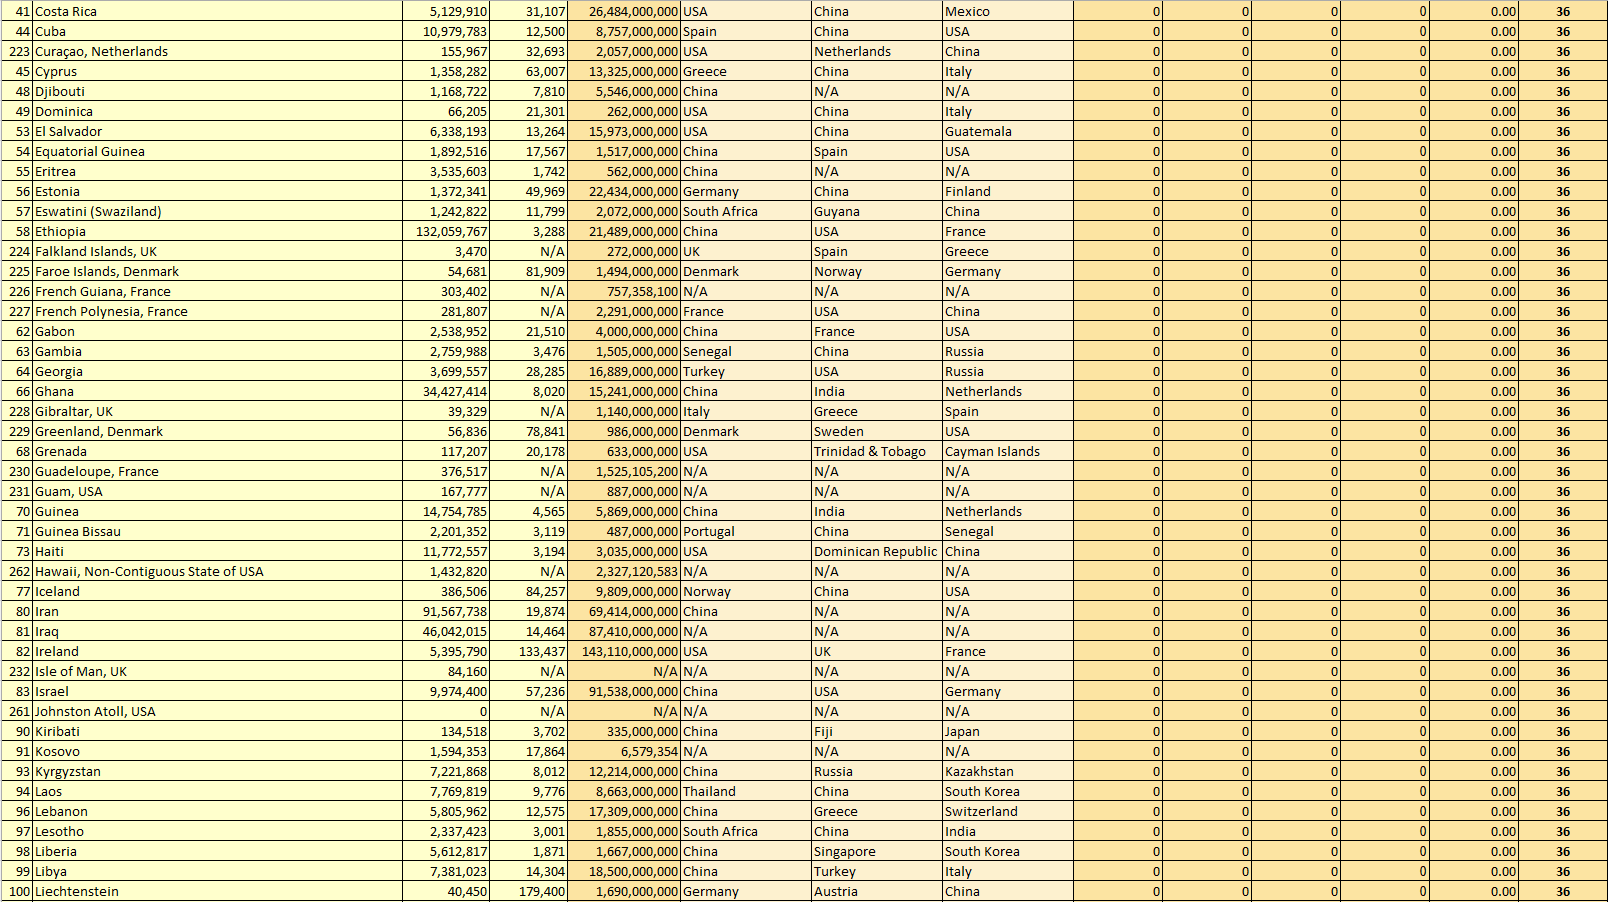
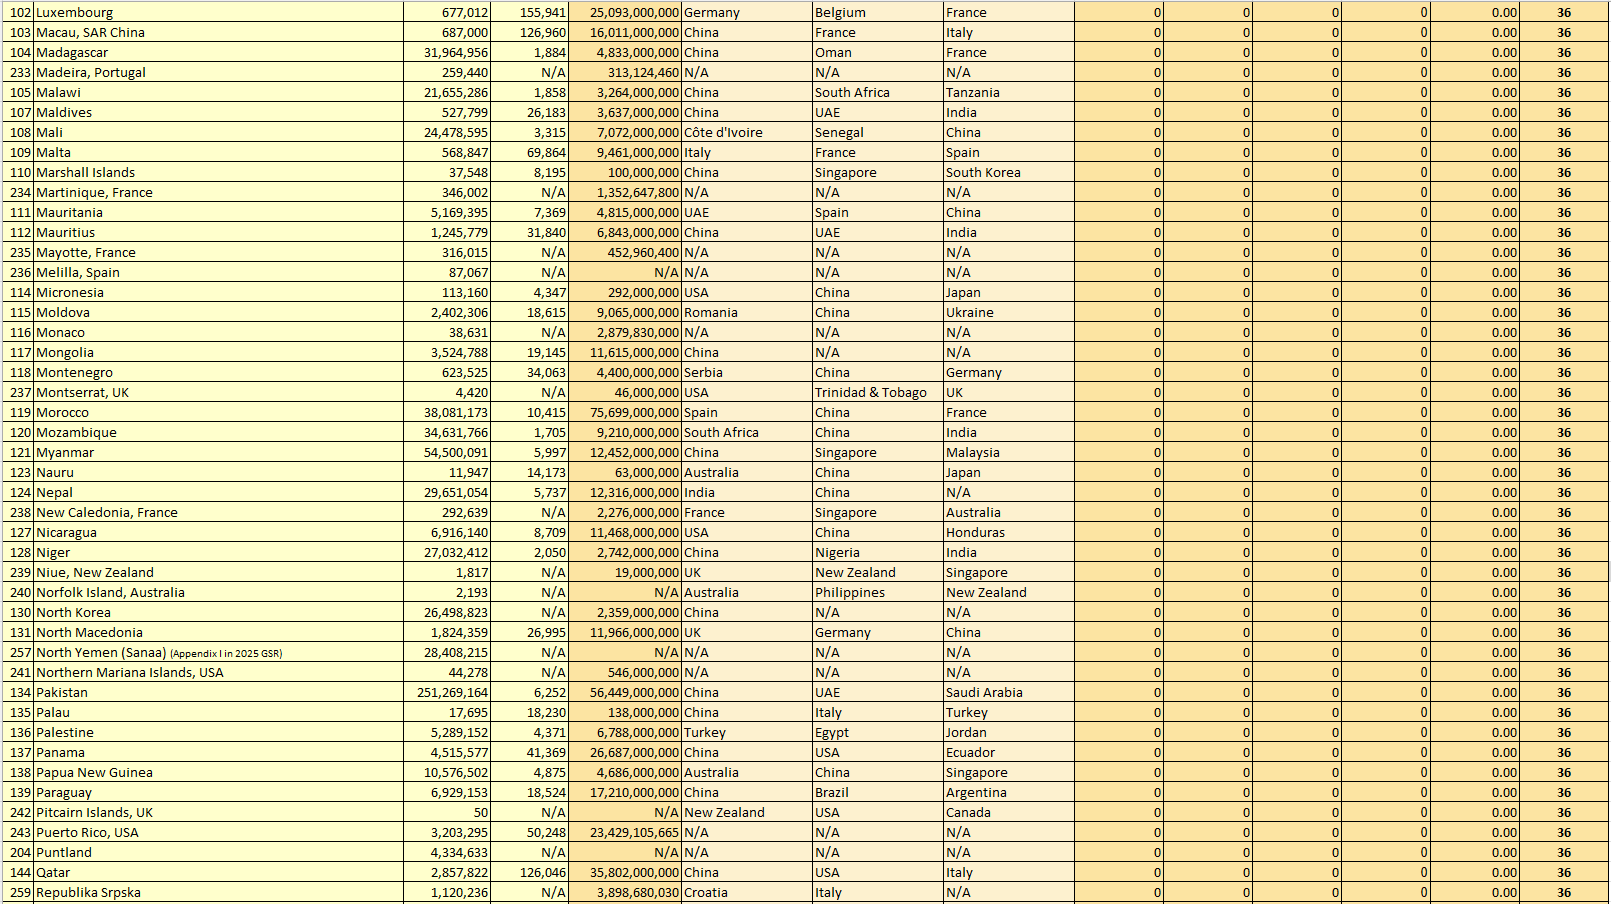
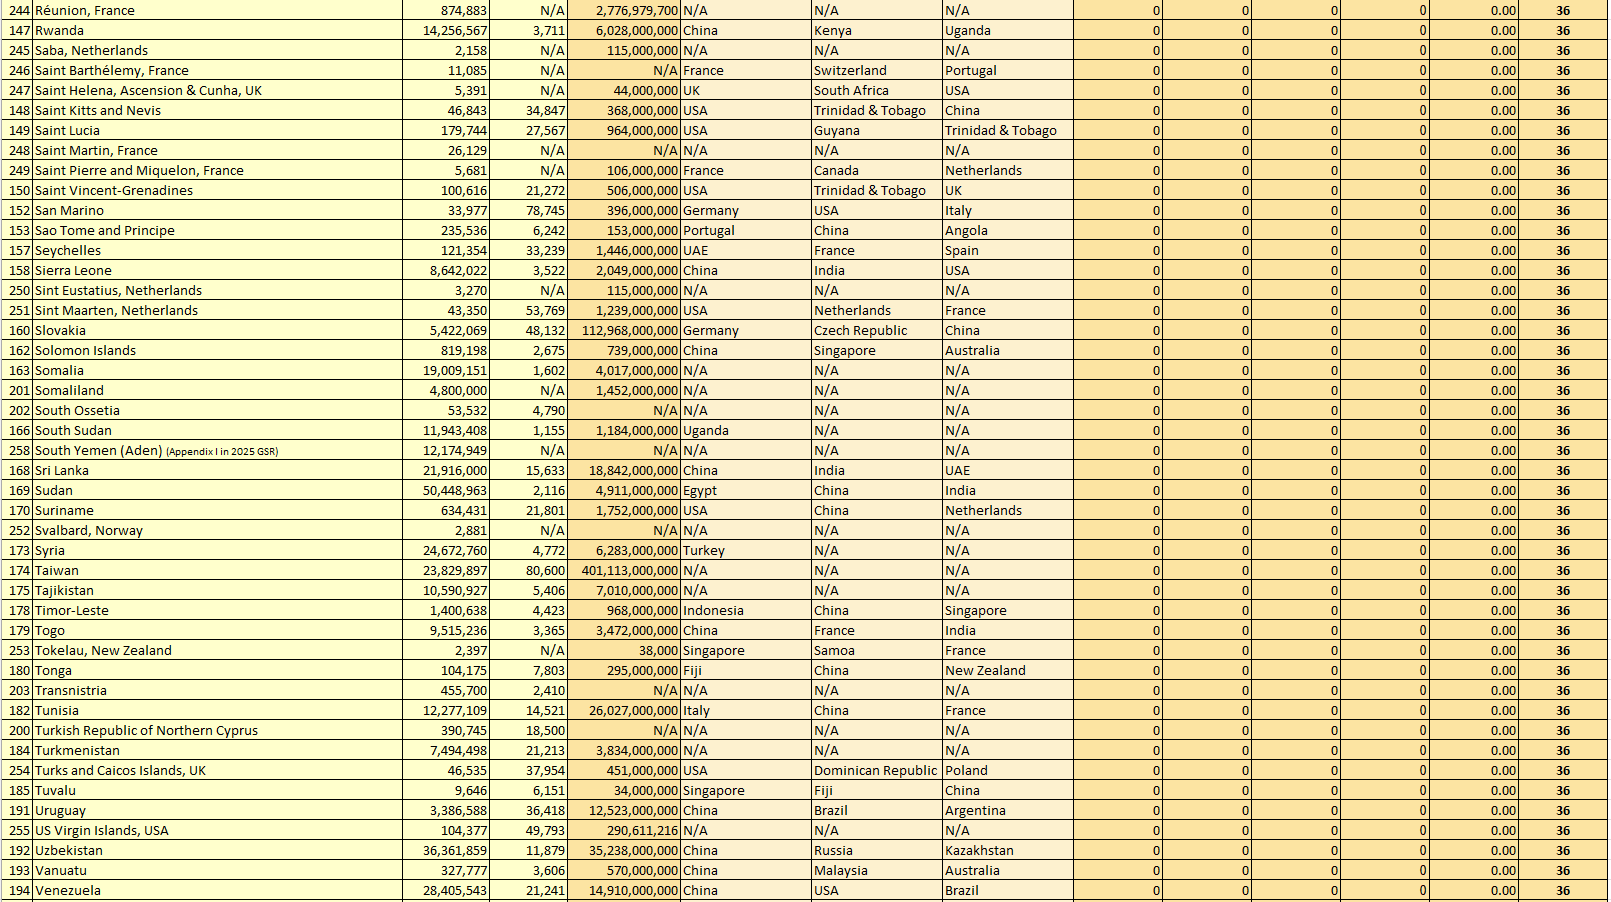

Table 5. Top Import Partners of the Home Country versus Global Top Import Partners: All UN Members and Non-UN Members, sorted by Alphabetical Order
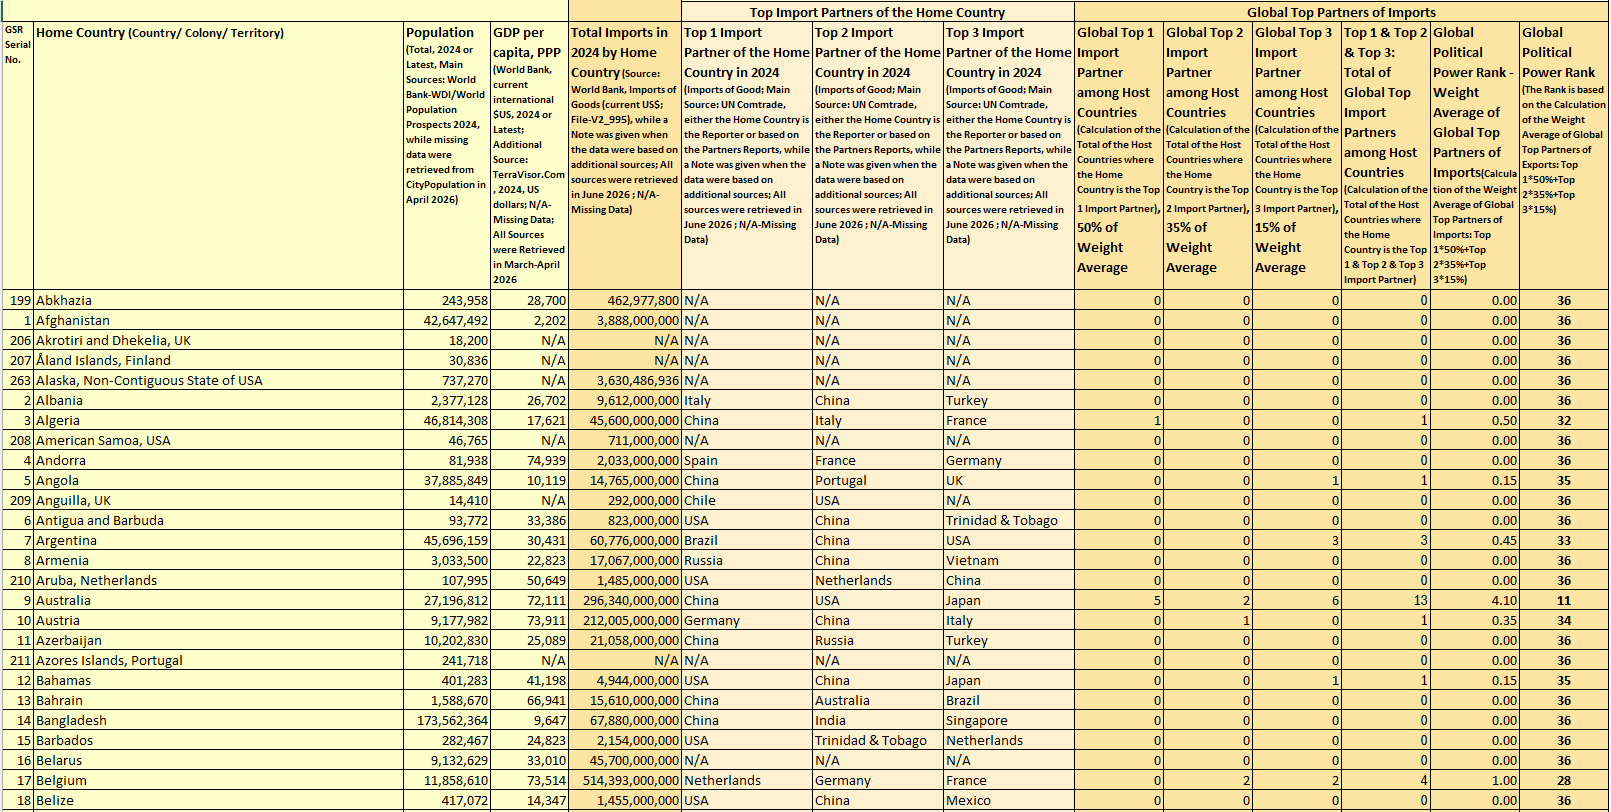
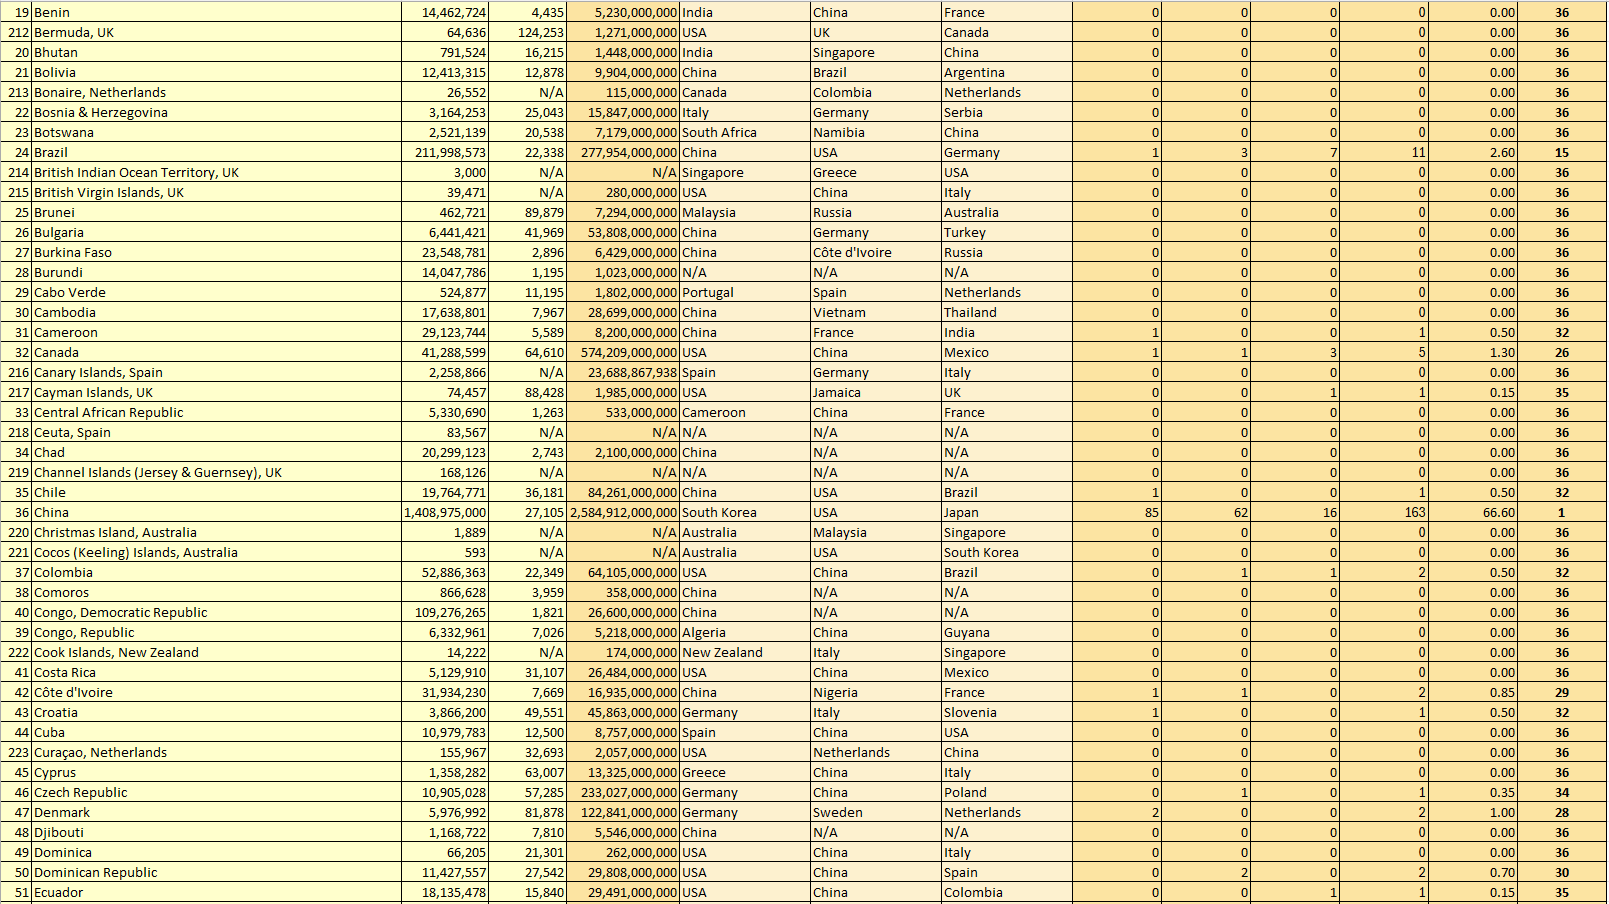
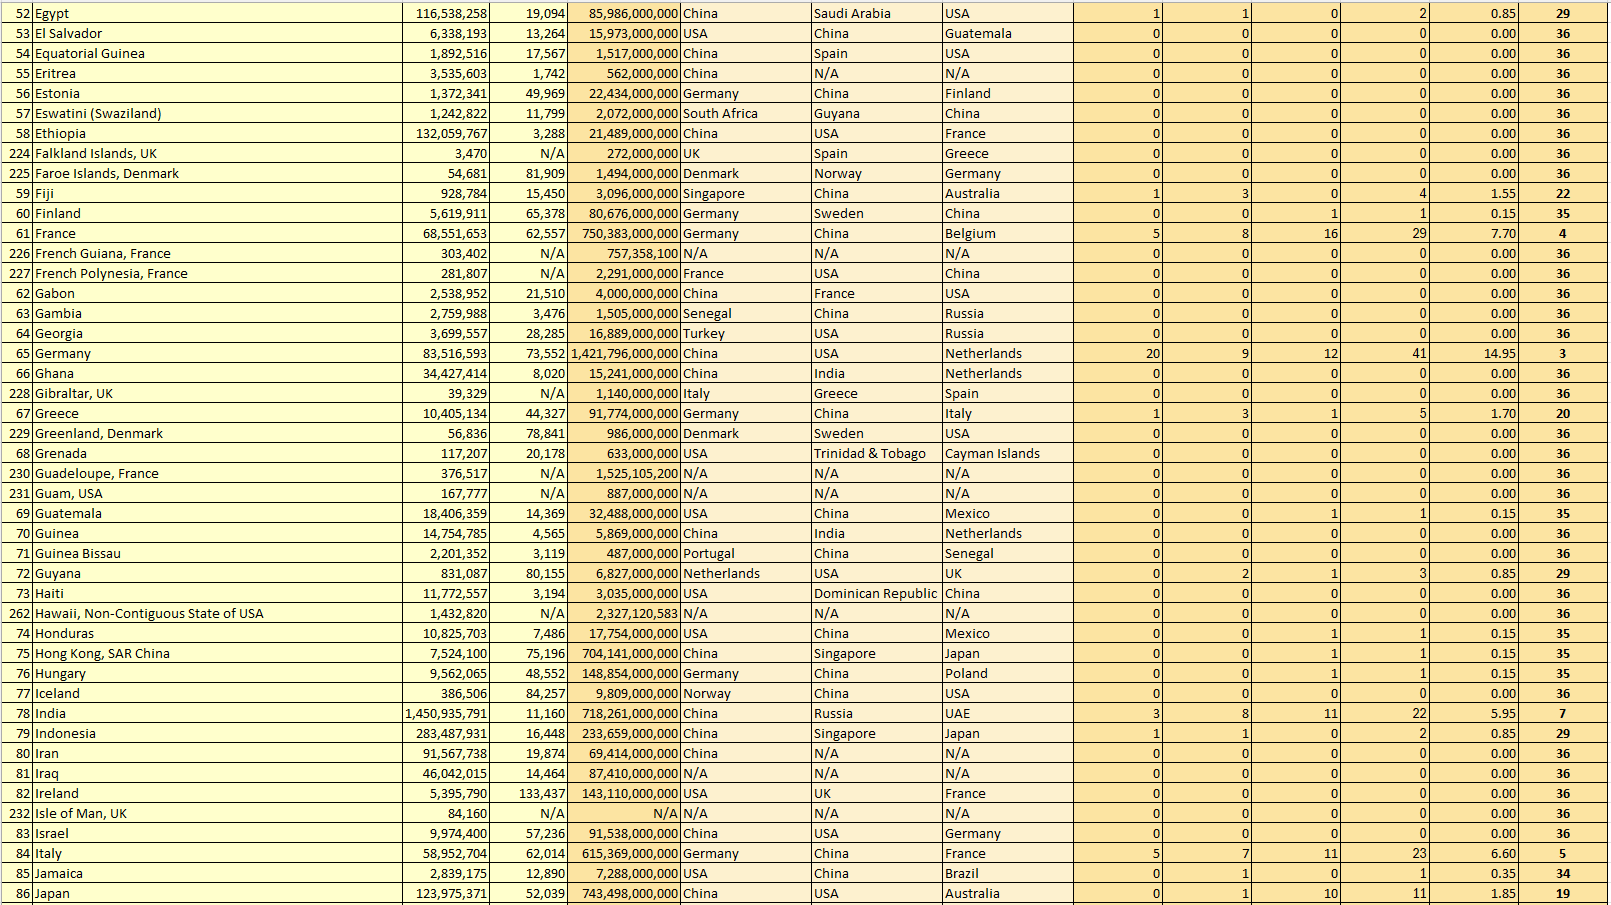
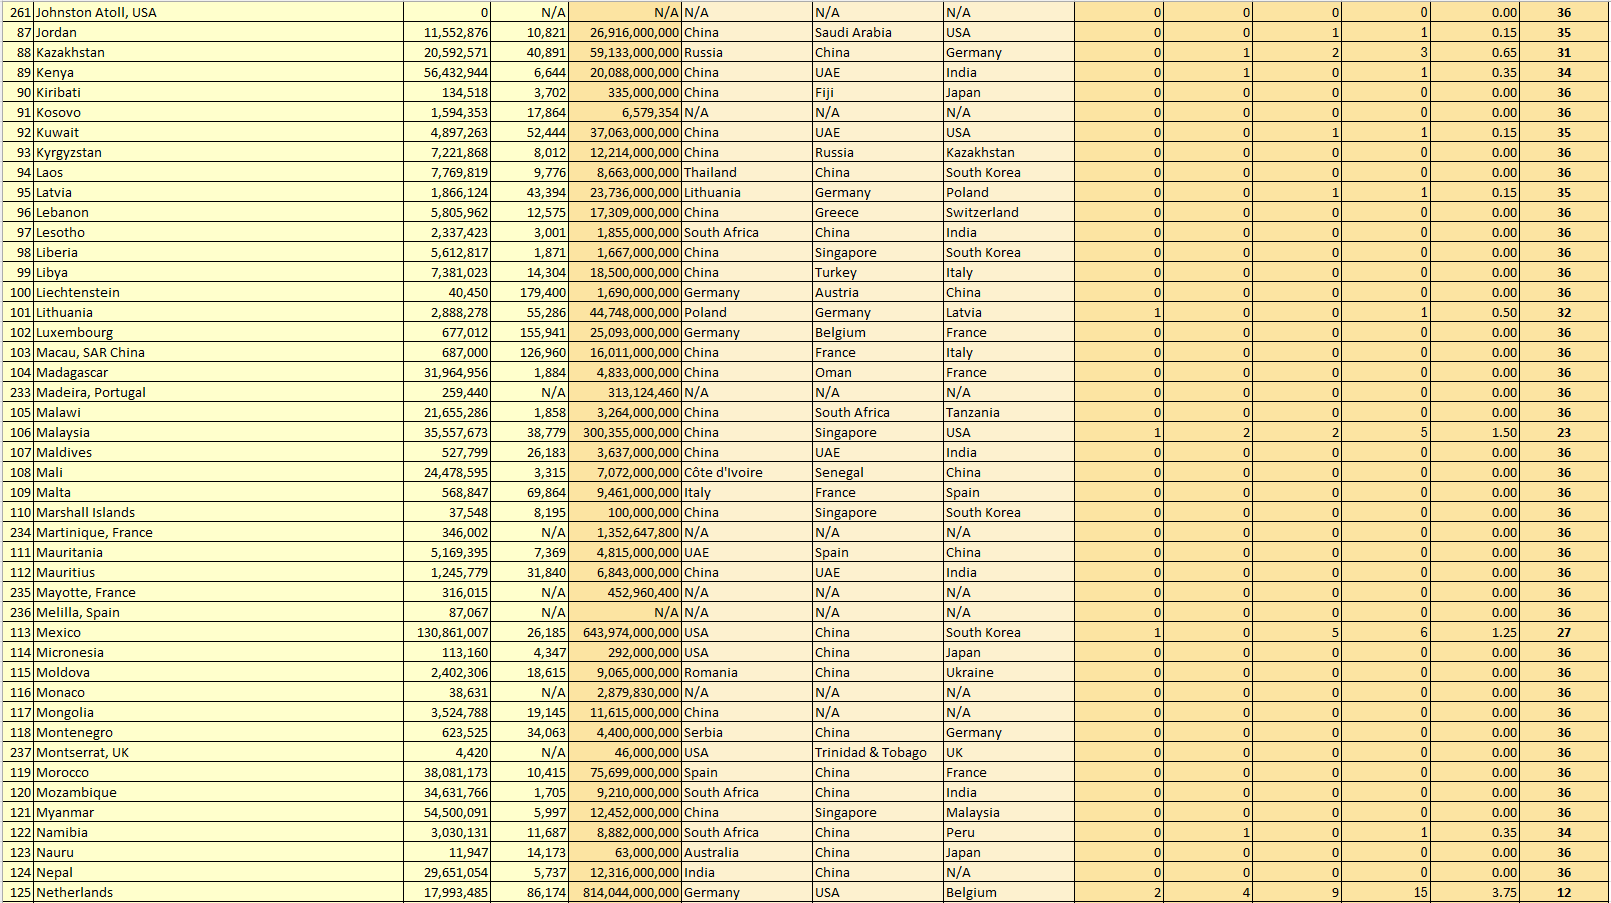
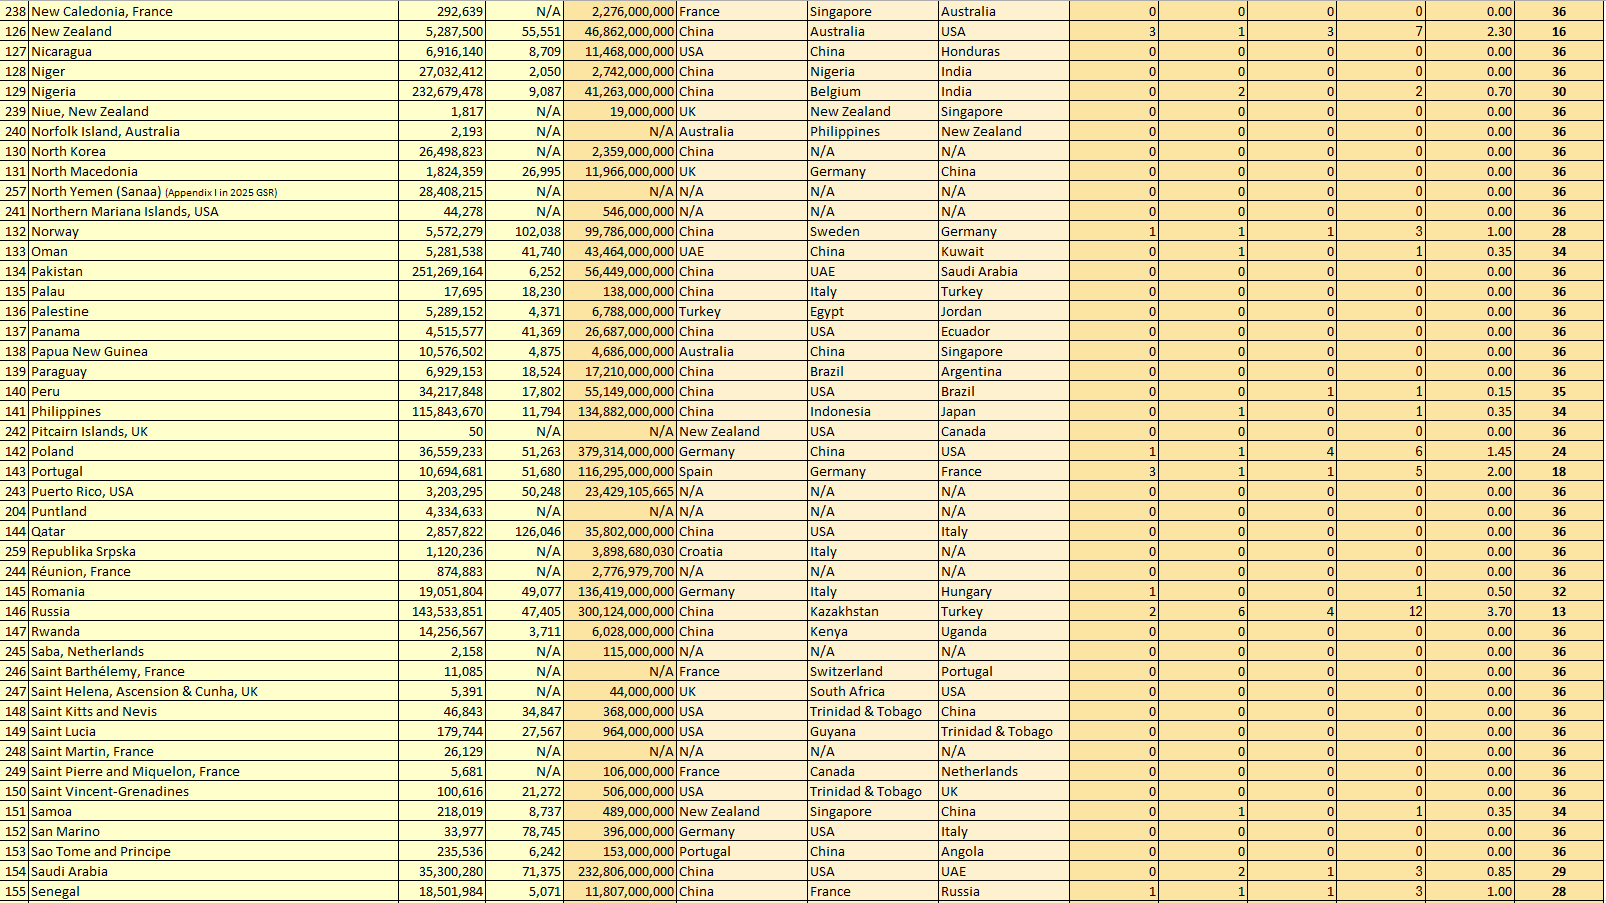
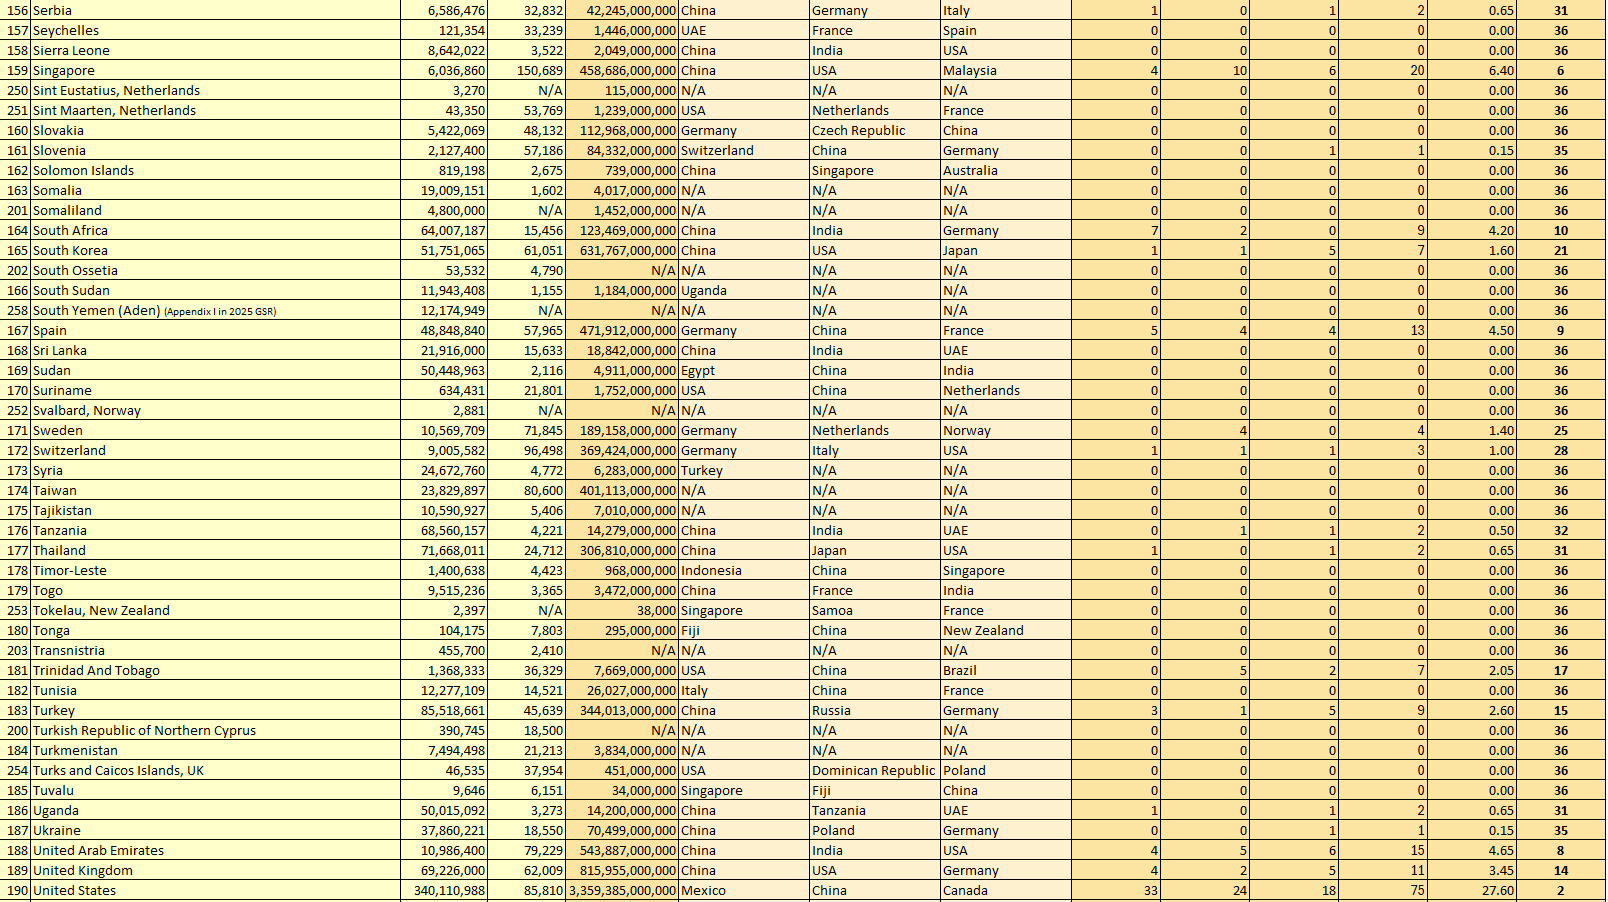

Section 3.3.2 Analysis of Top Export Partners of the Home Country versus Global Top Export Partners: All UN Members and Non-UN Members
Table 6. Top Export Partners of the Home Country versus Global Top Export Partners: All UN Members and Non-UN Members, sorted by Global Market Size Rank
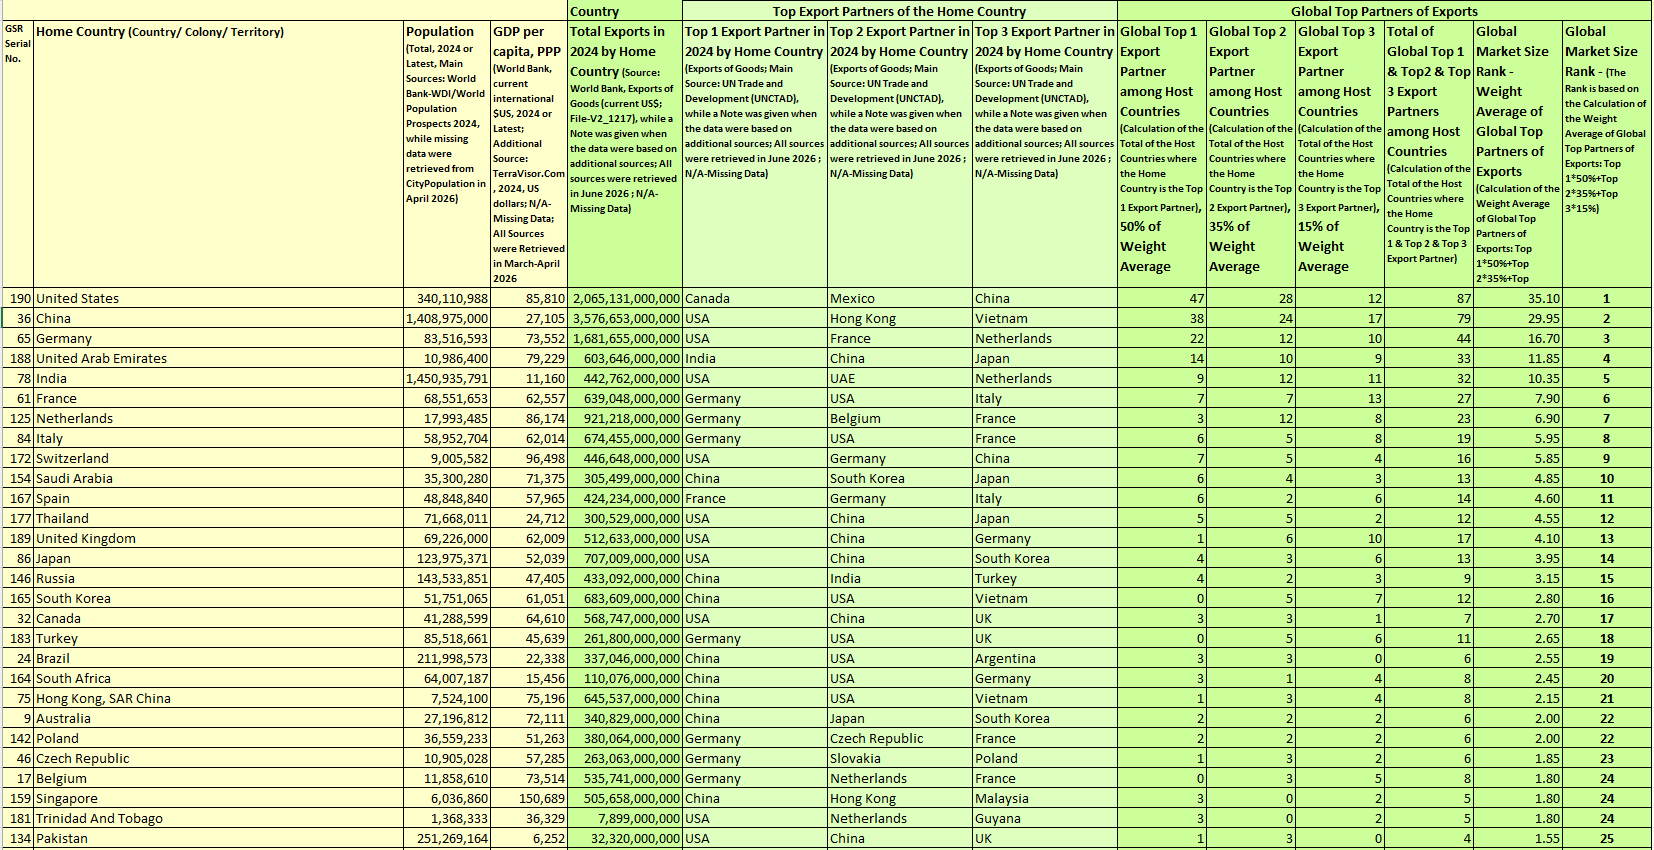
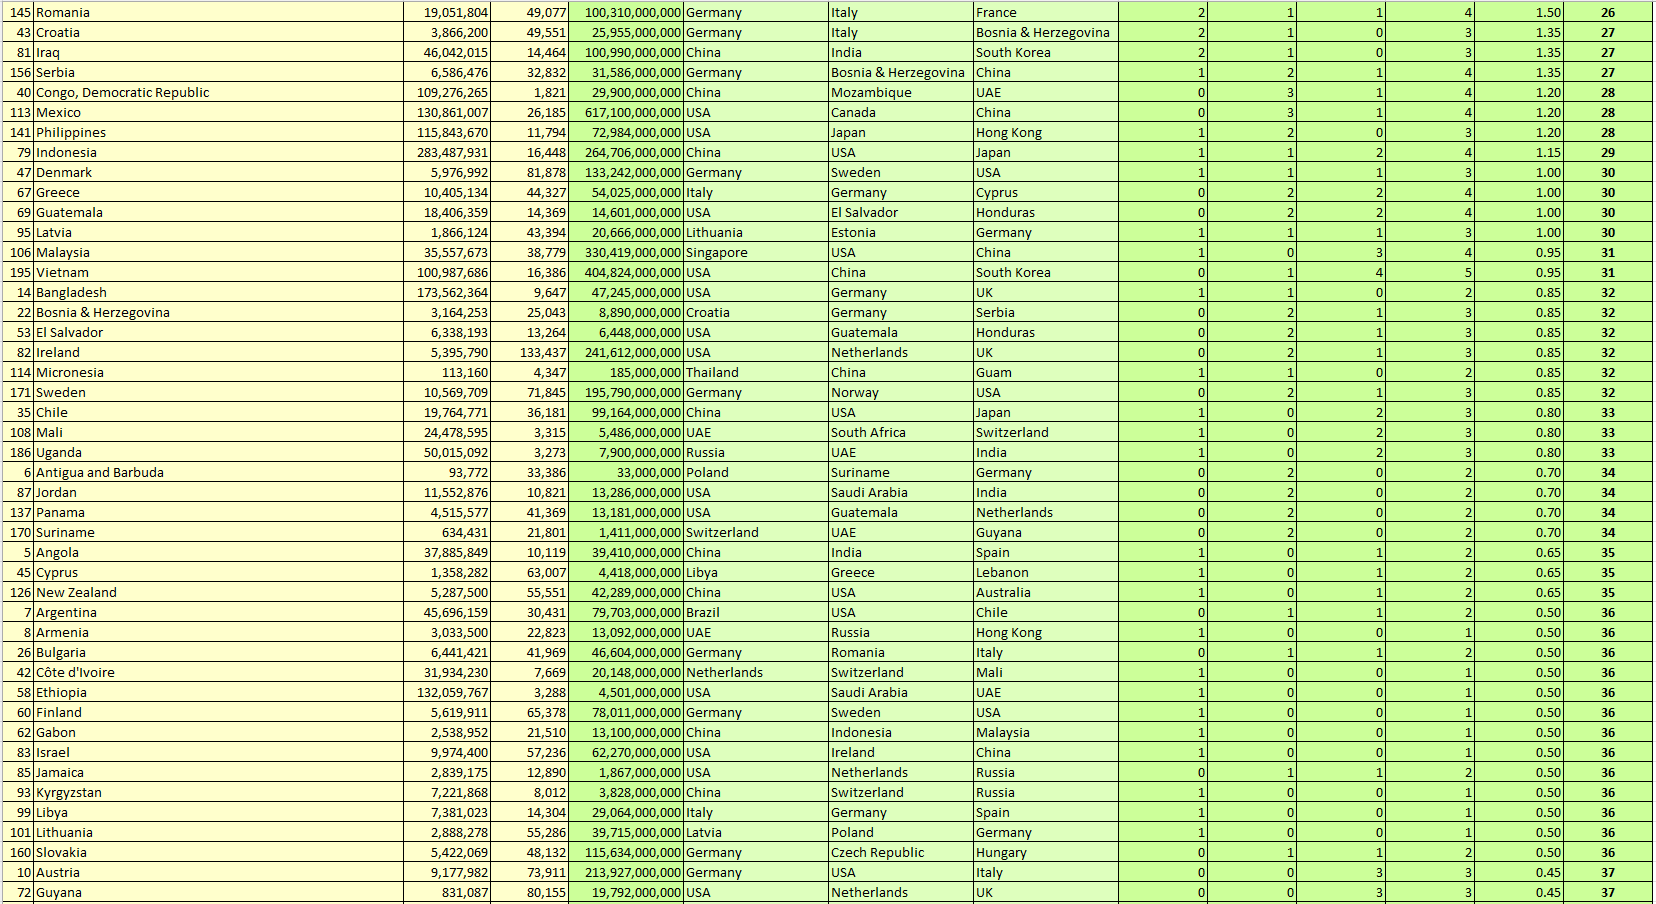
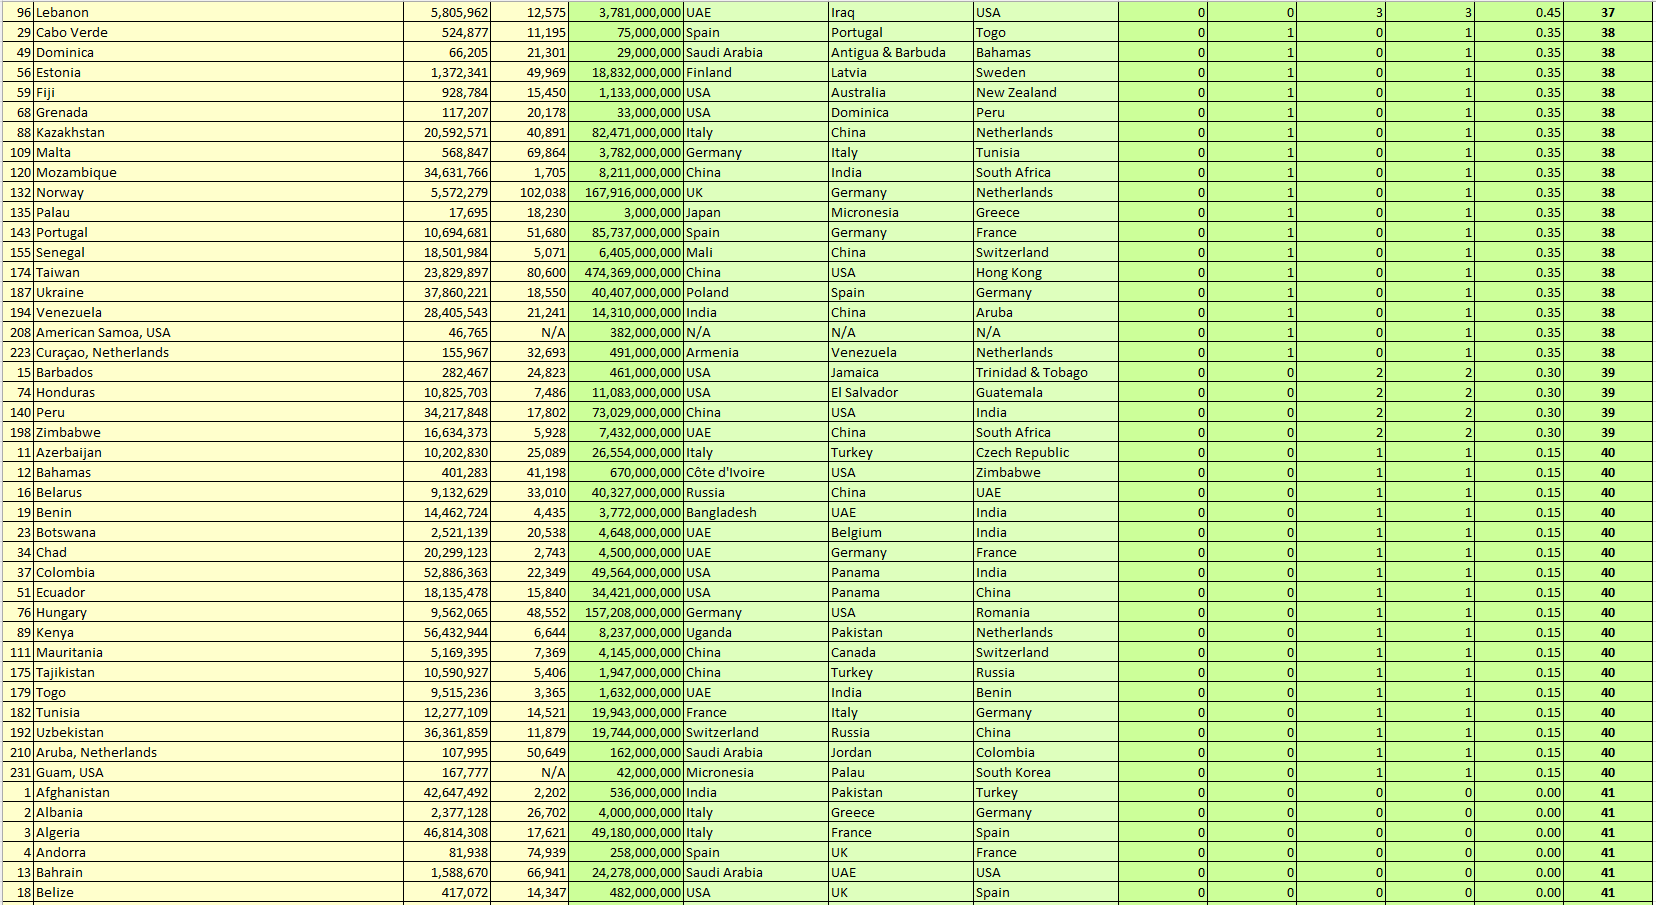
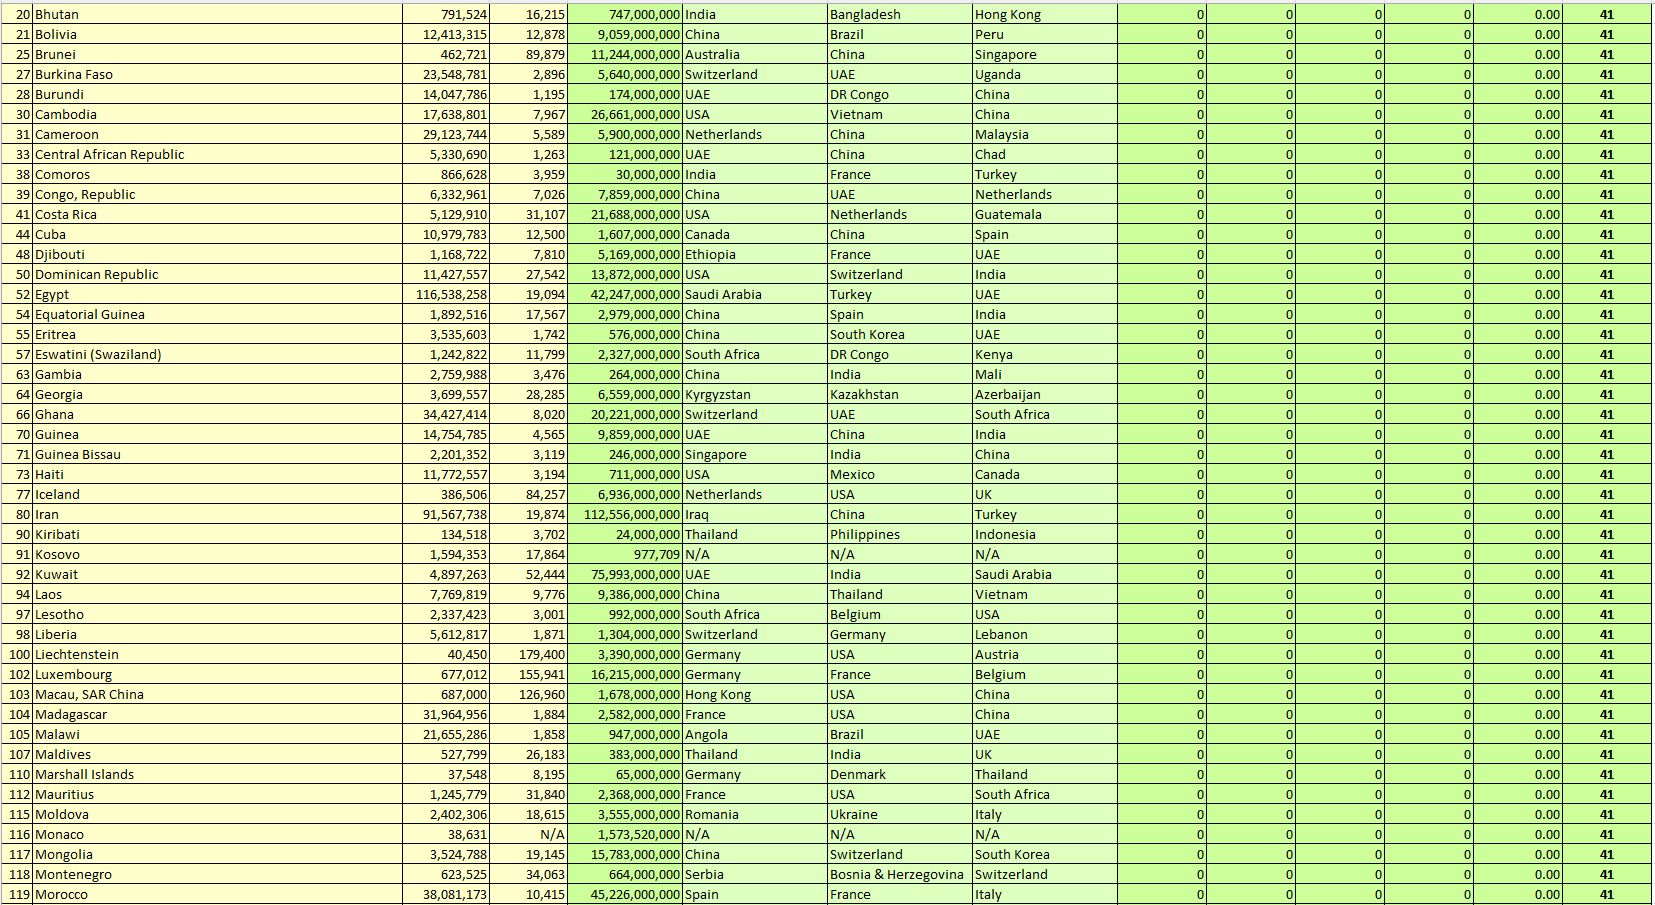
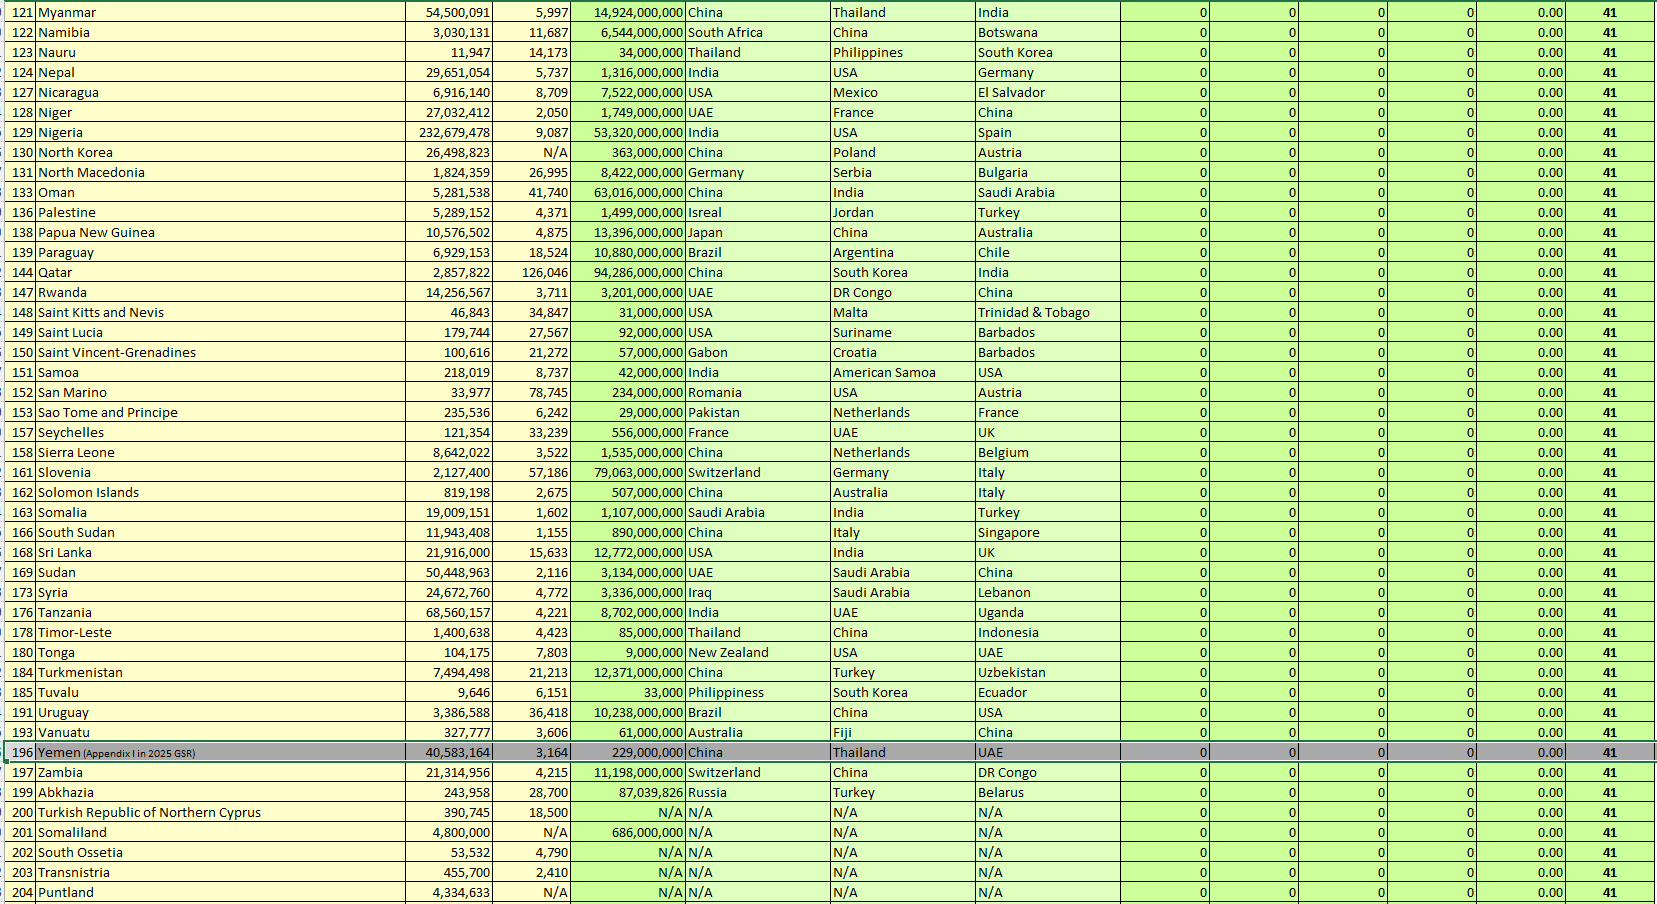
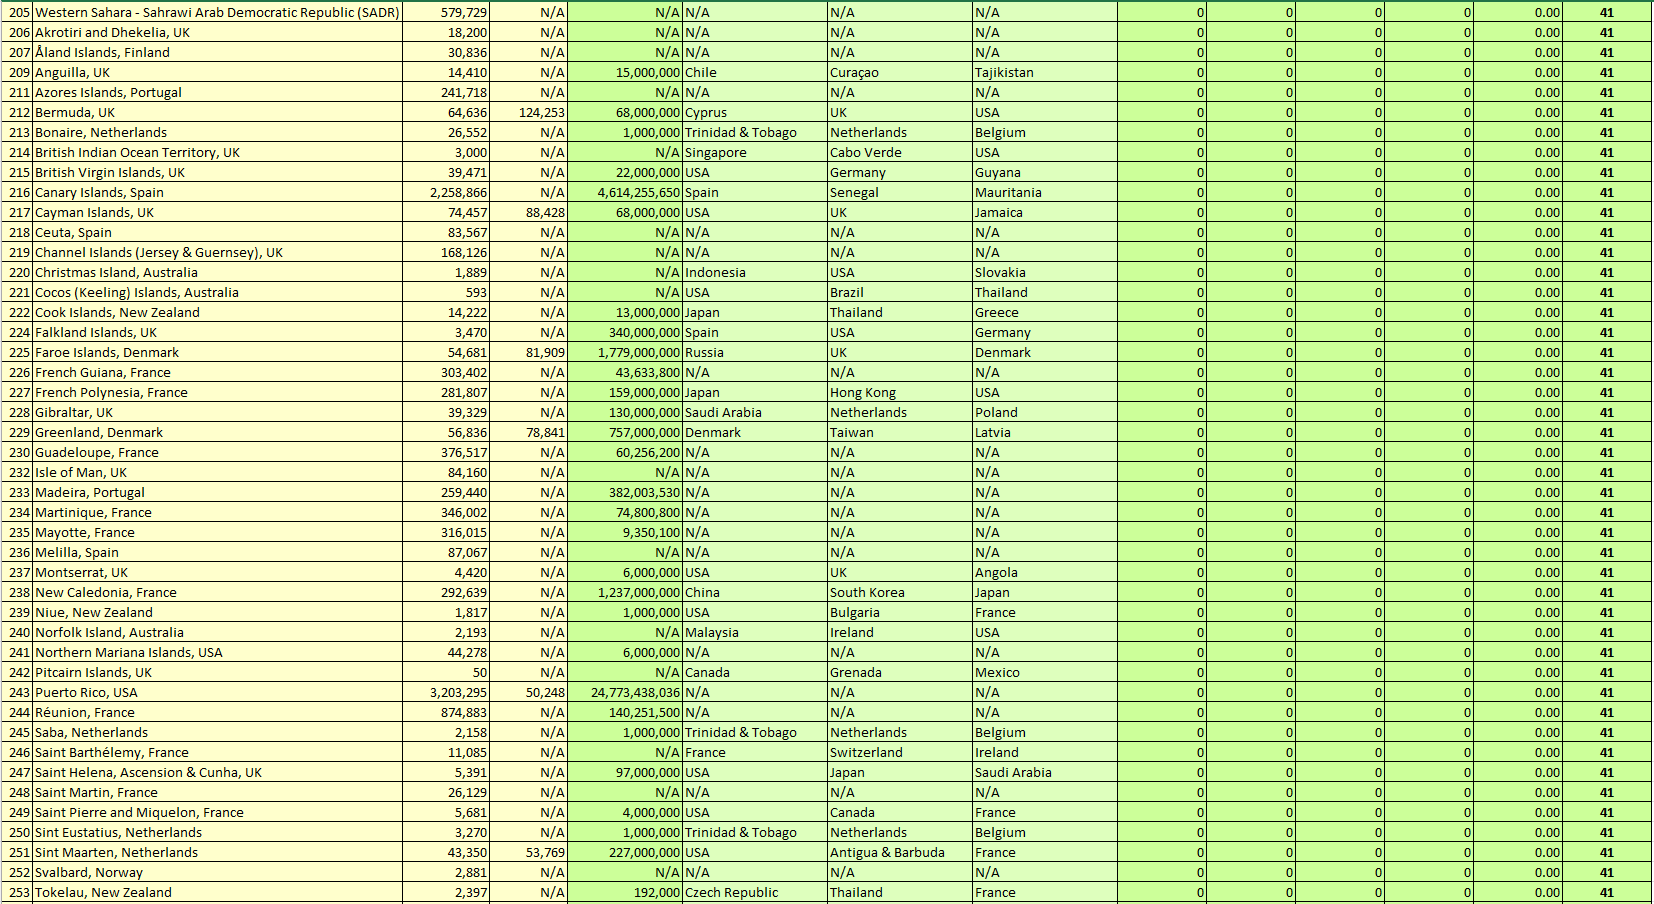

Table 7. Top Export Partners of the Home Country versus Global Top Export Partners: All UN Members and Non-UN Members, sorted by Alphabetical Order
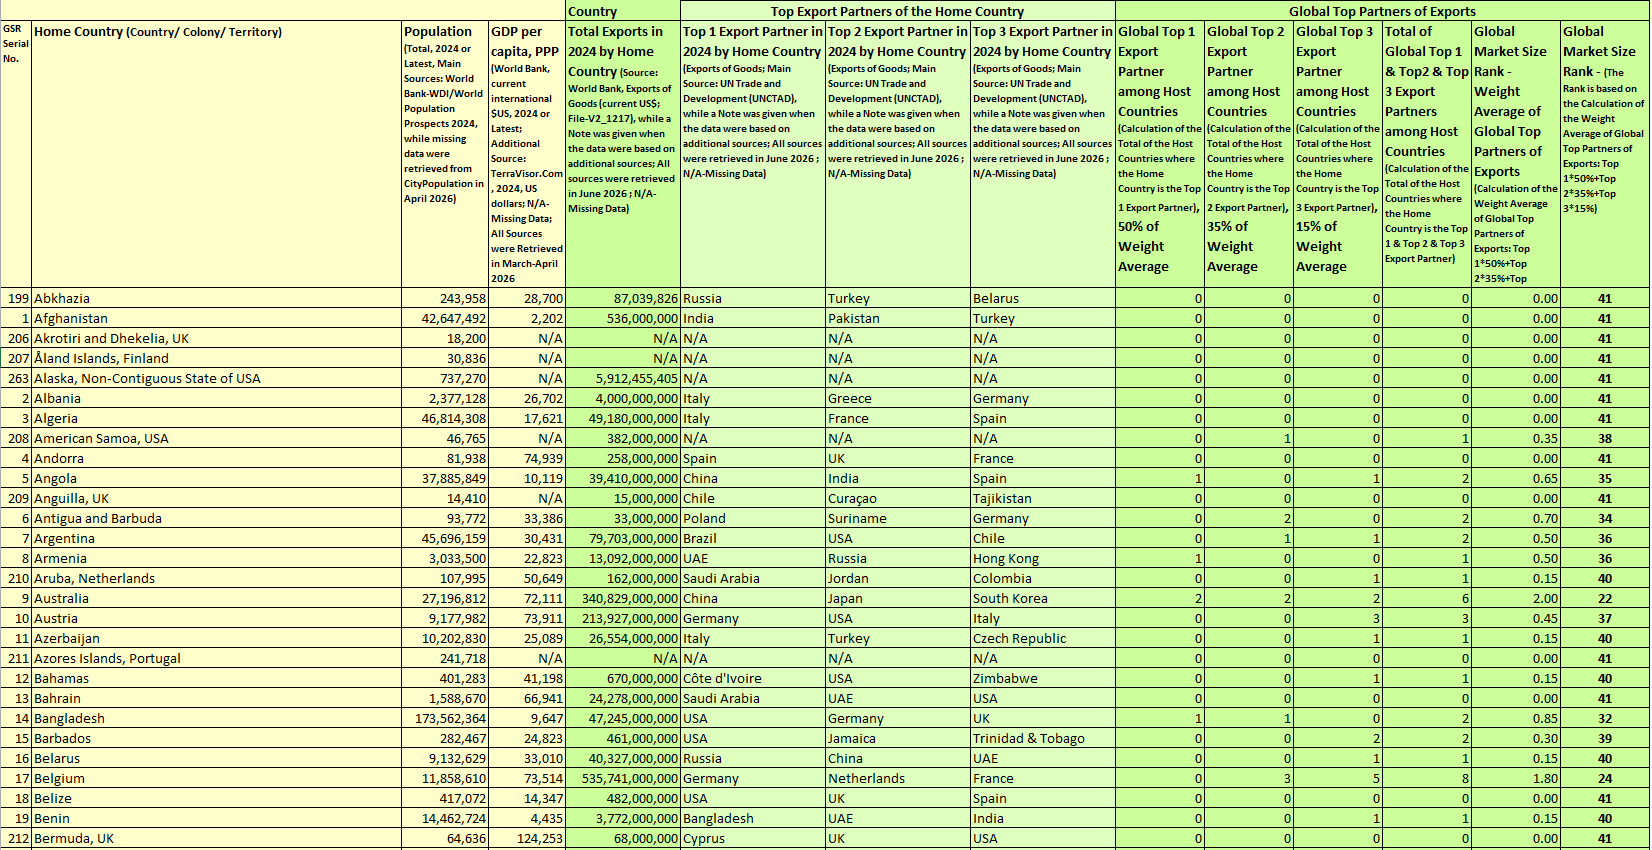
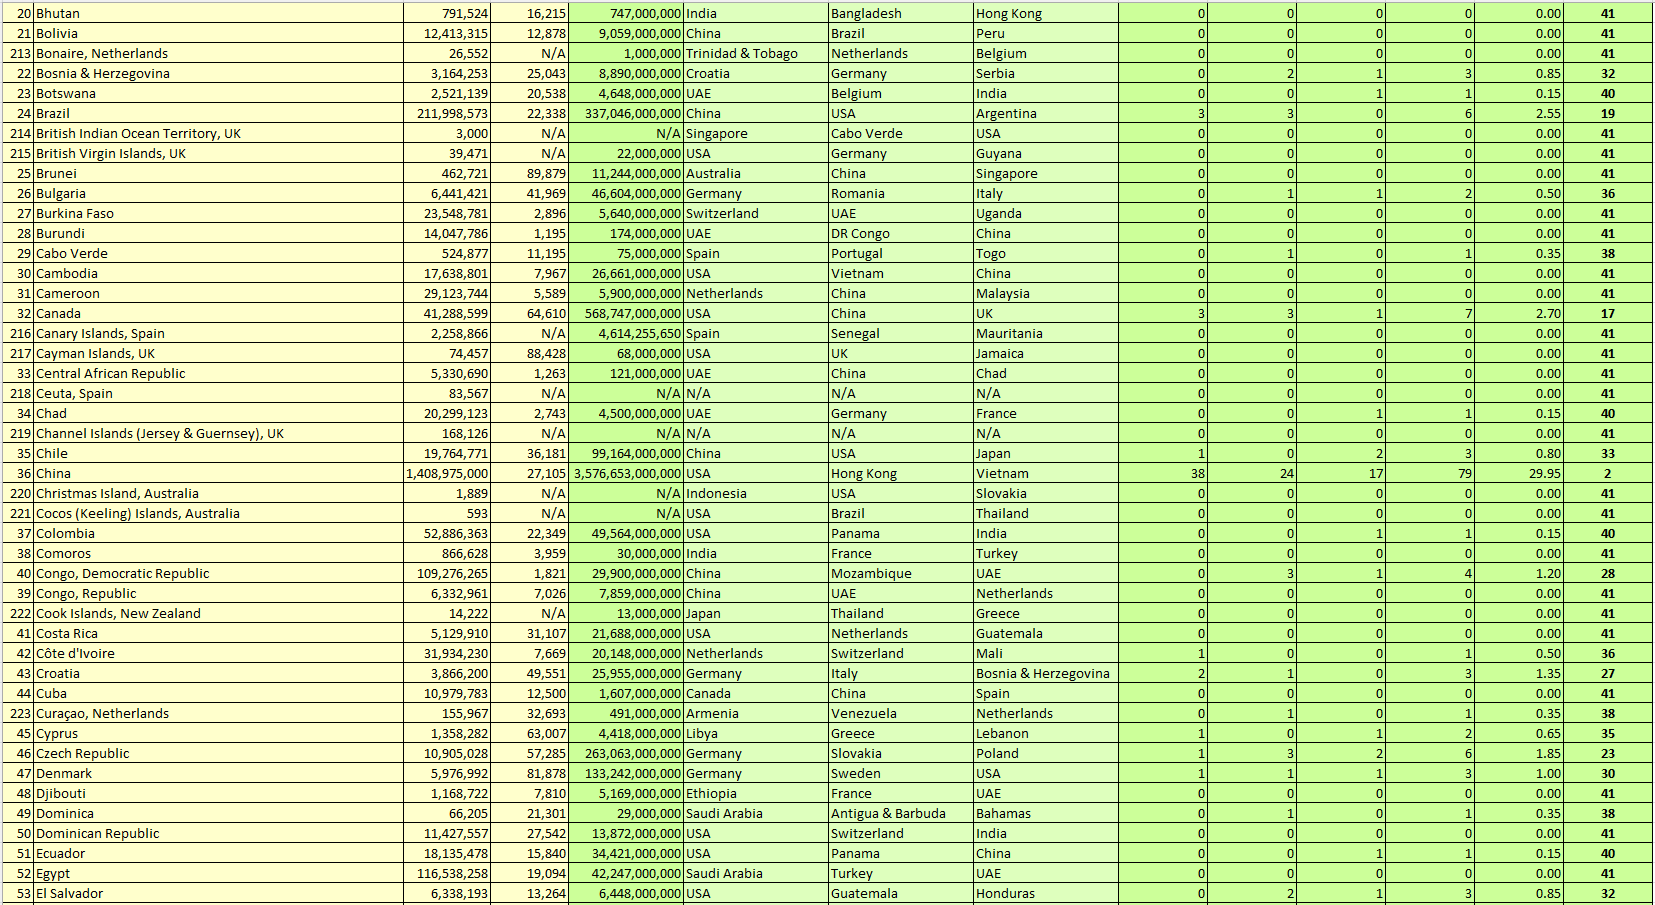
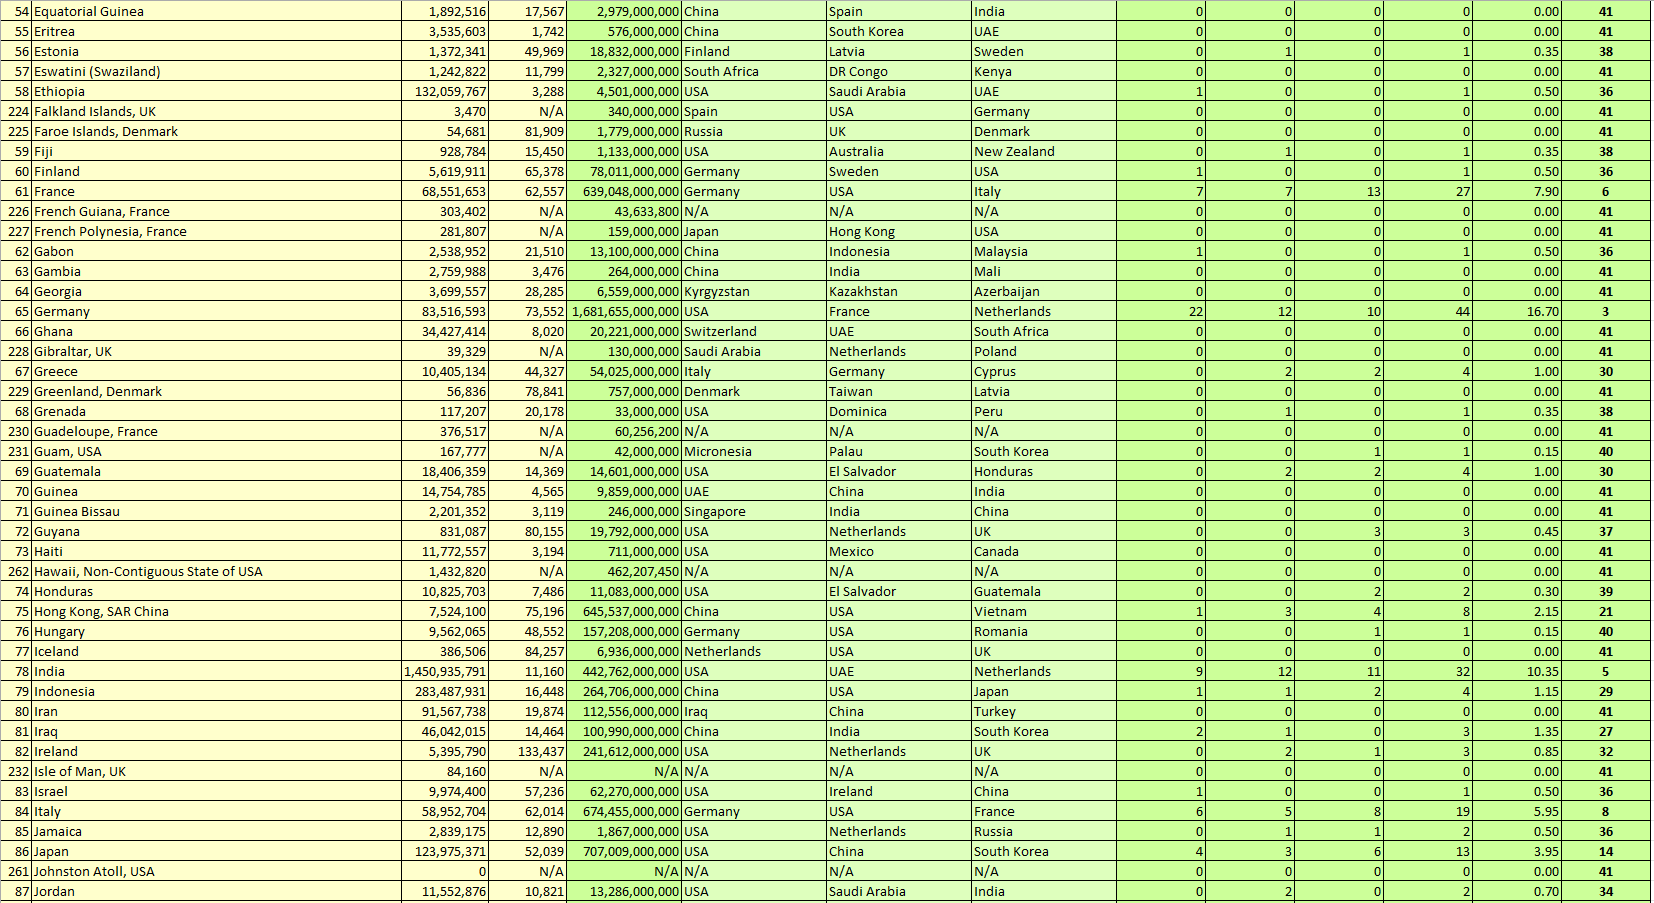
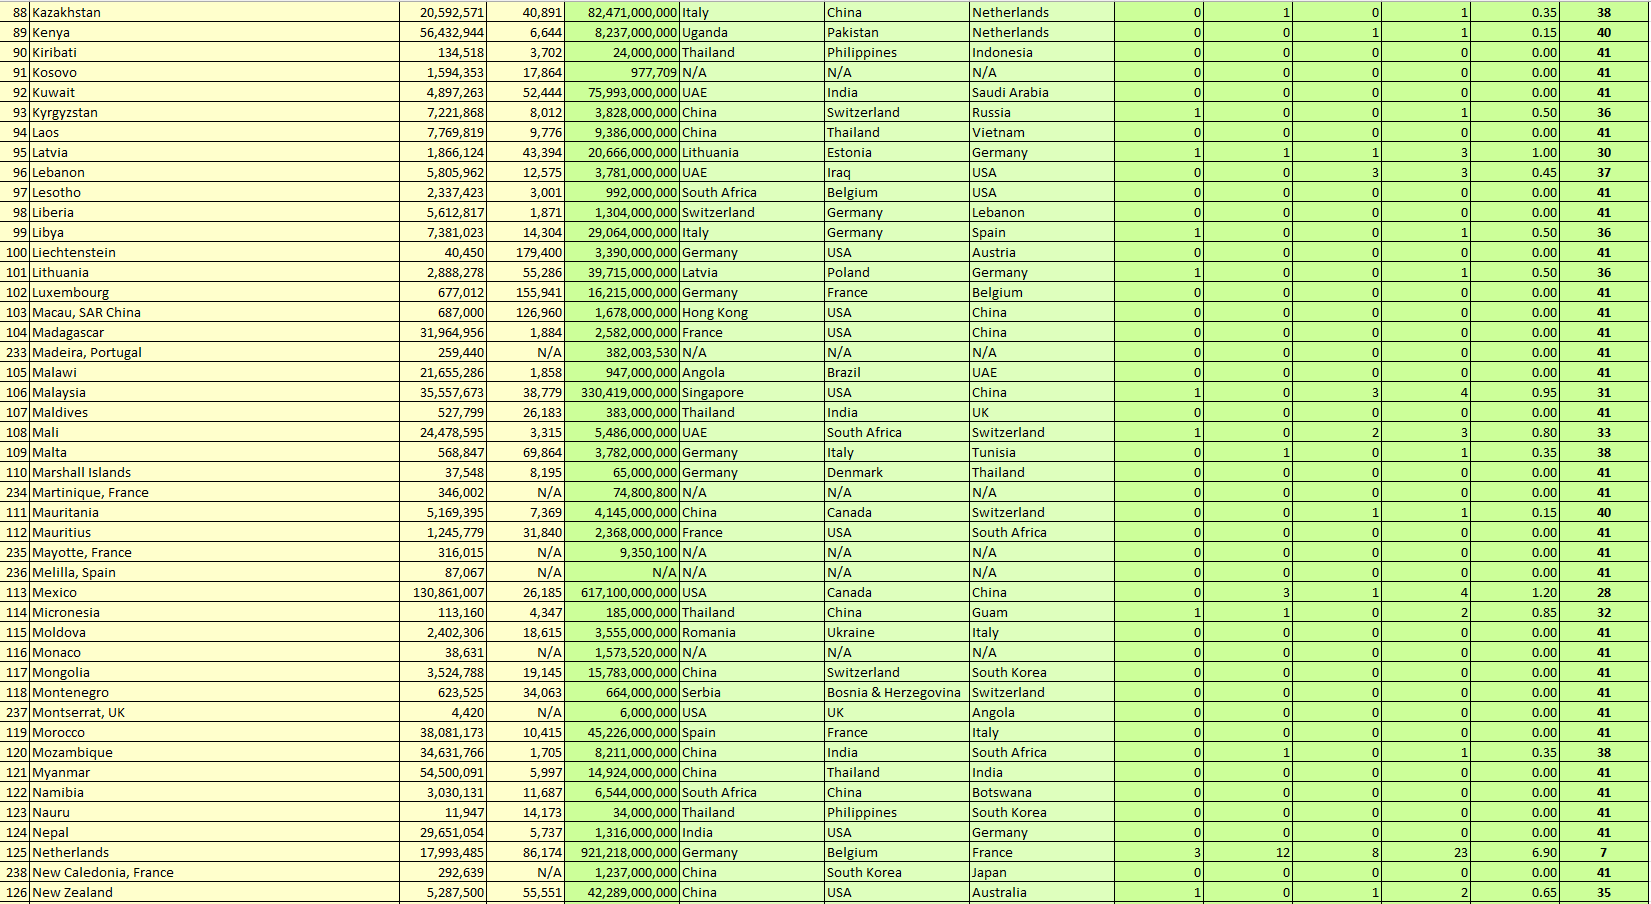
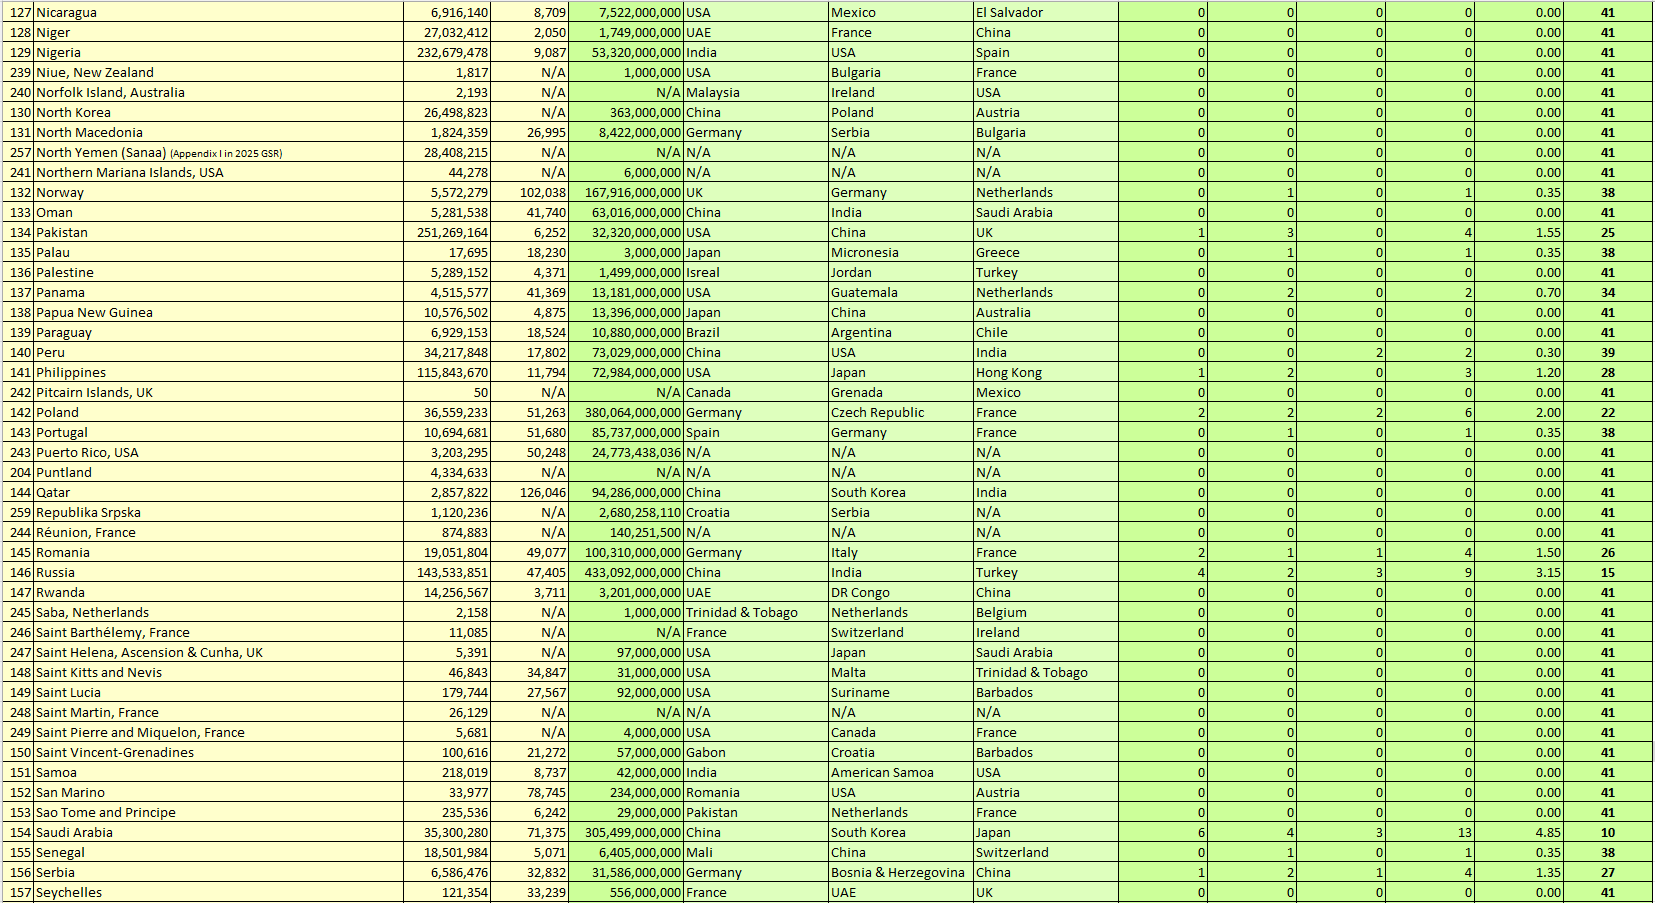
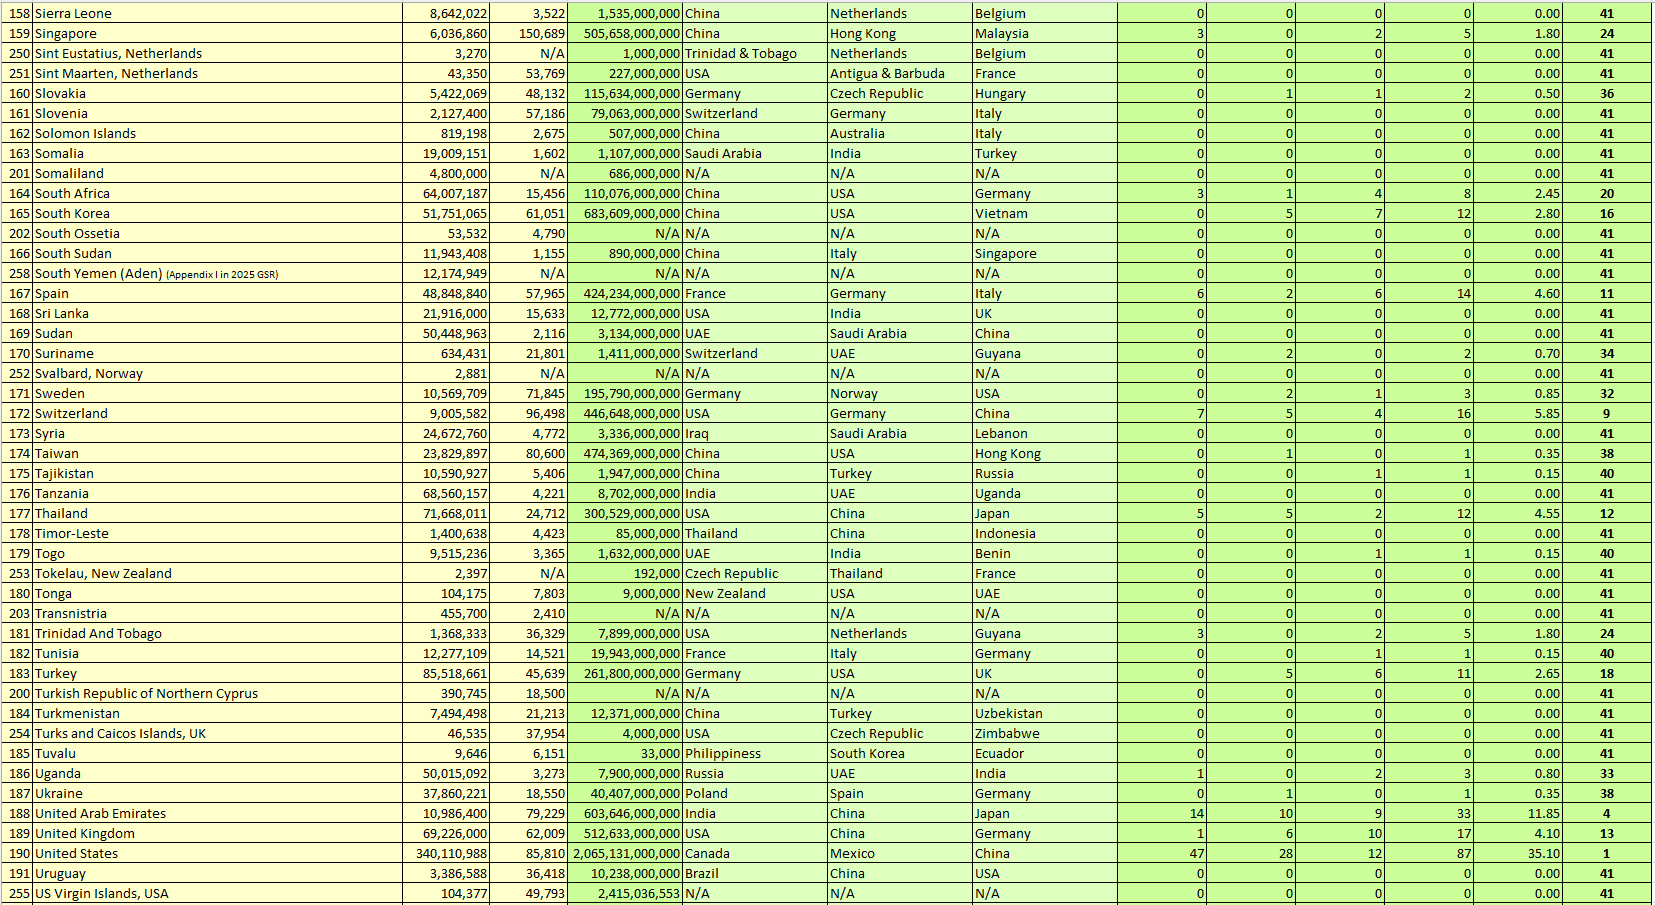

Section 3.3.3 In which Countries the Country is the Top 1/Top 2/Top 3 Import Partner, sorted by Global Top 1/Top 2/Top 3 Import Partner, Higher to Lower: All UN Members and Non-UN Members
Table 8. In which Countries the Country is the Top 1/Top 2/Top 3 Import Partner, sorted by Global Top 1/Top 2/Top 3 Import Partner, Higher to Lower
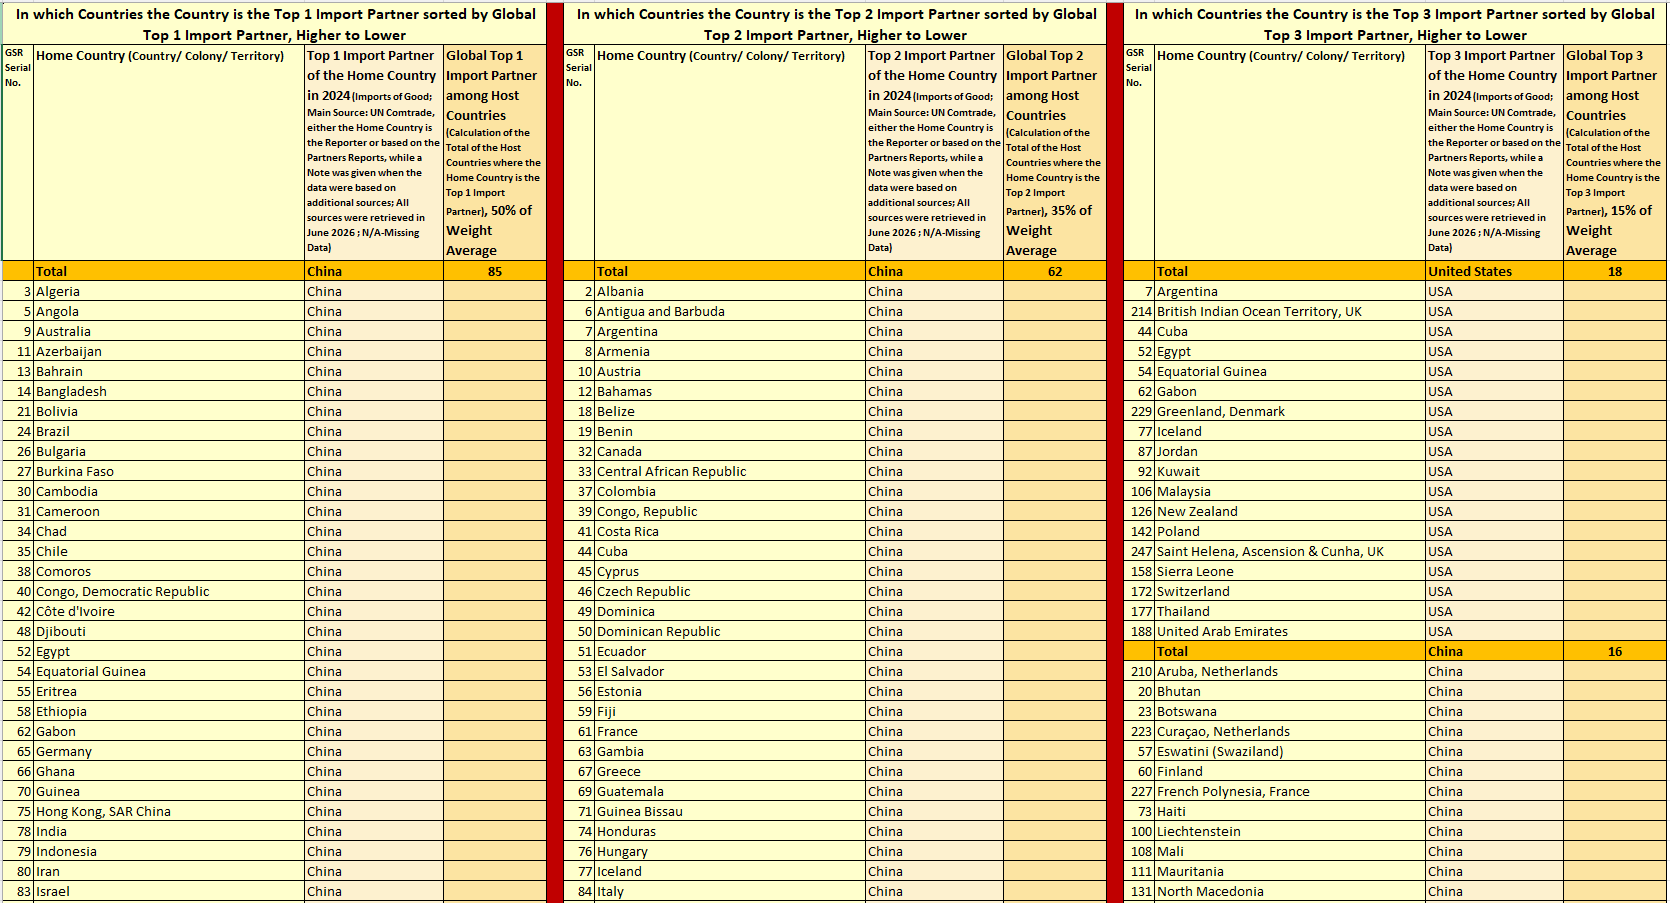
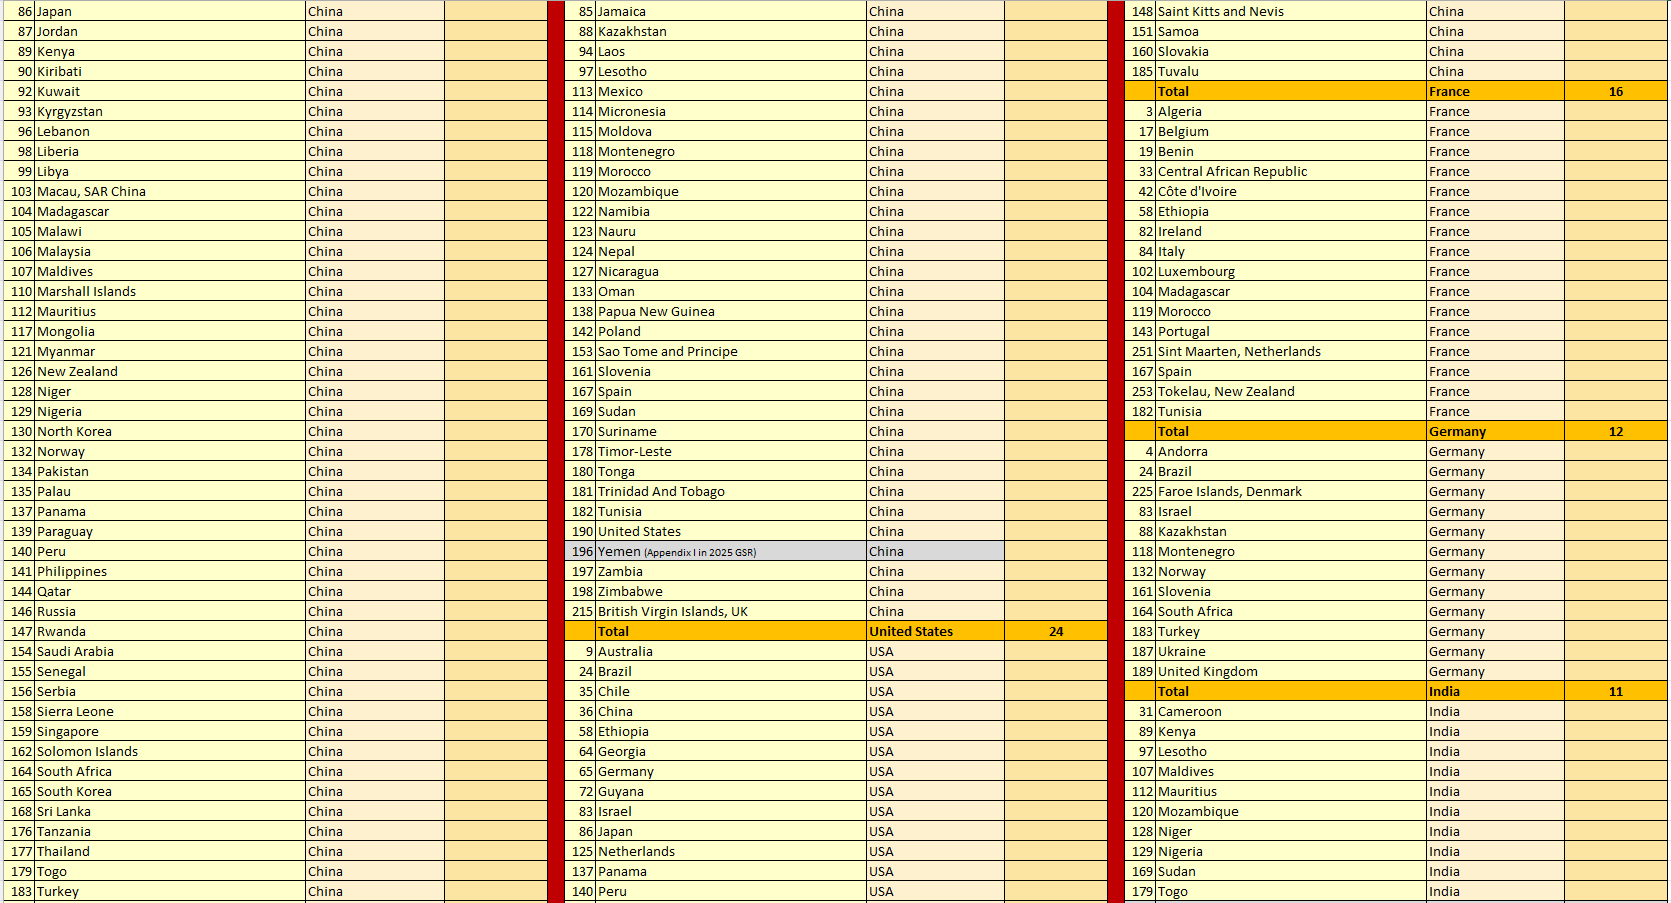
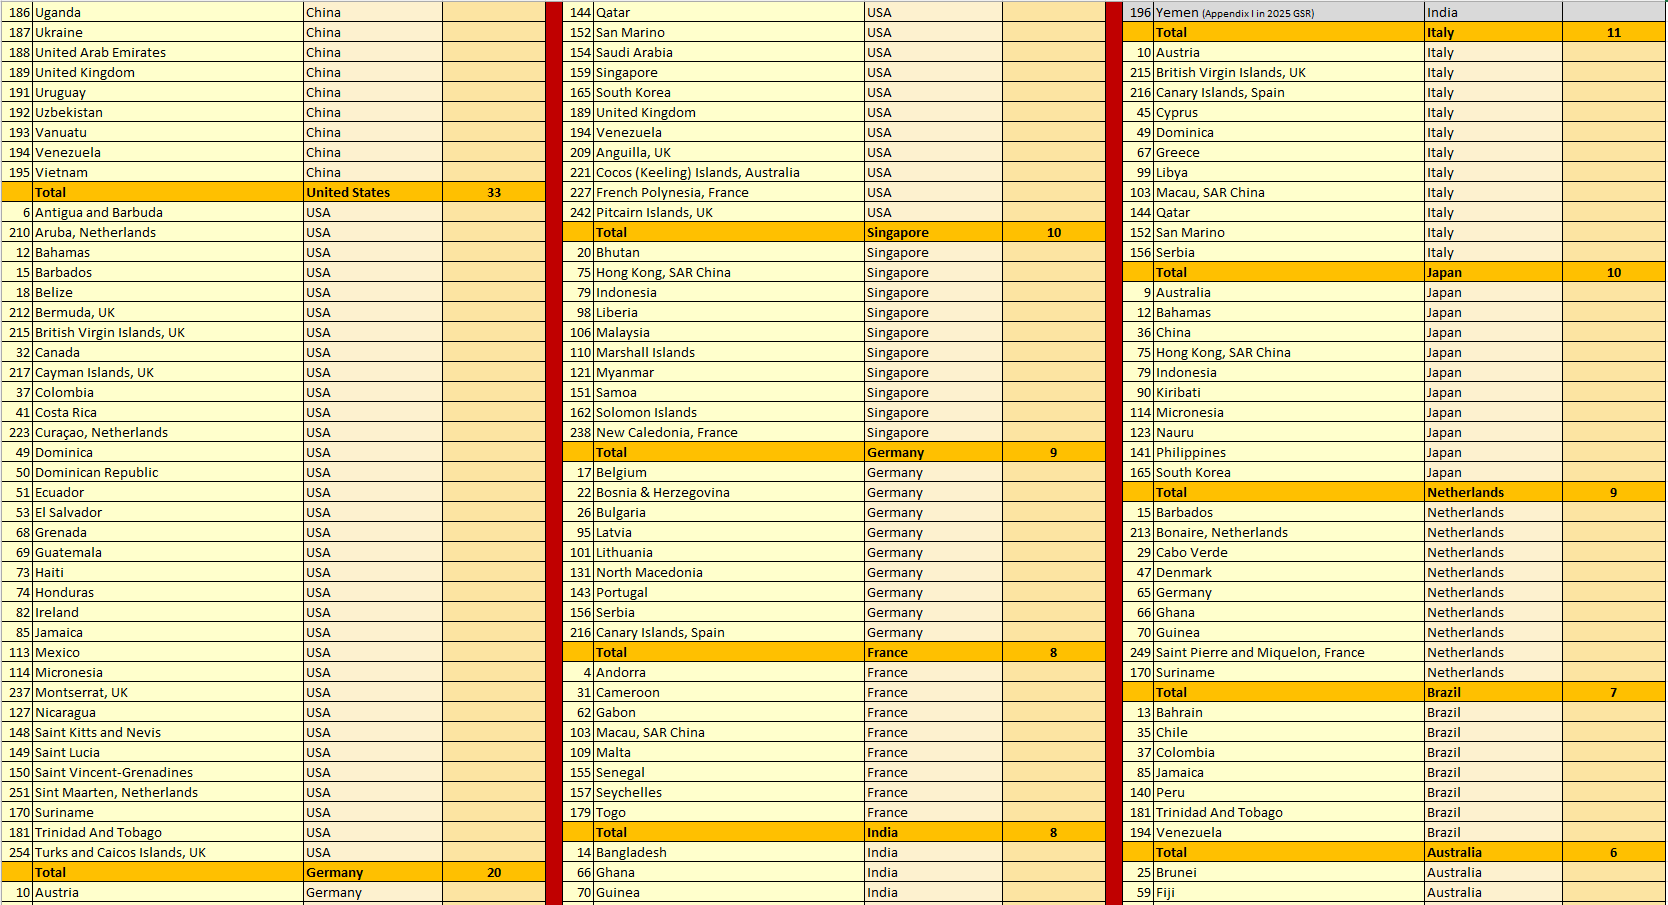
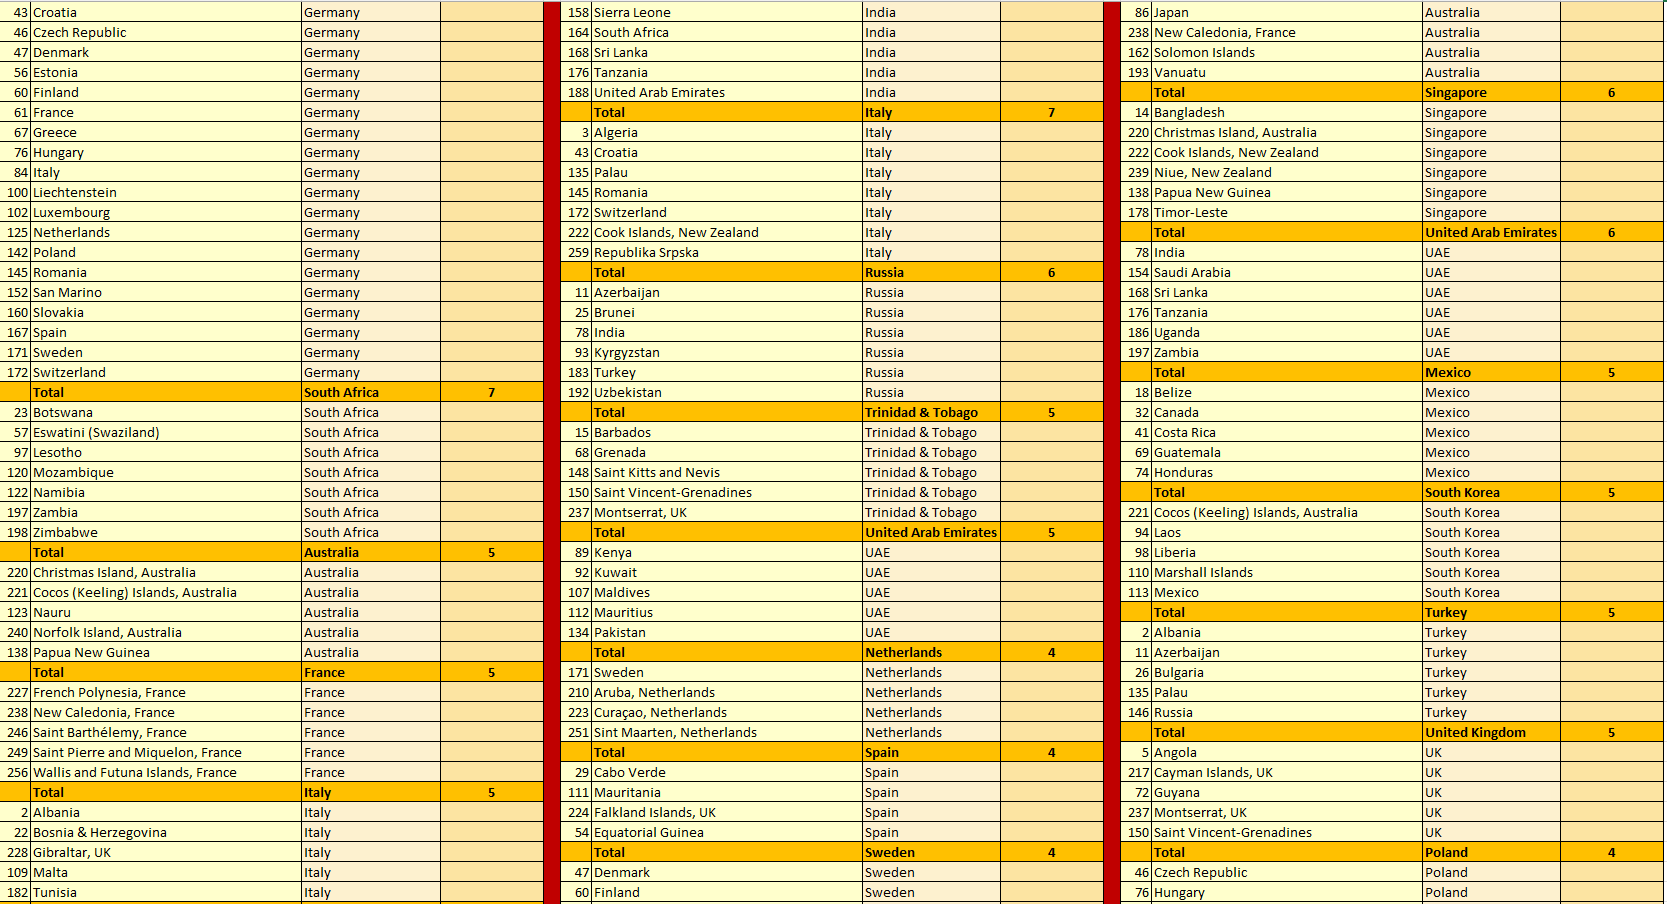
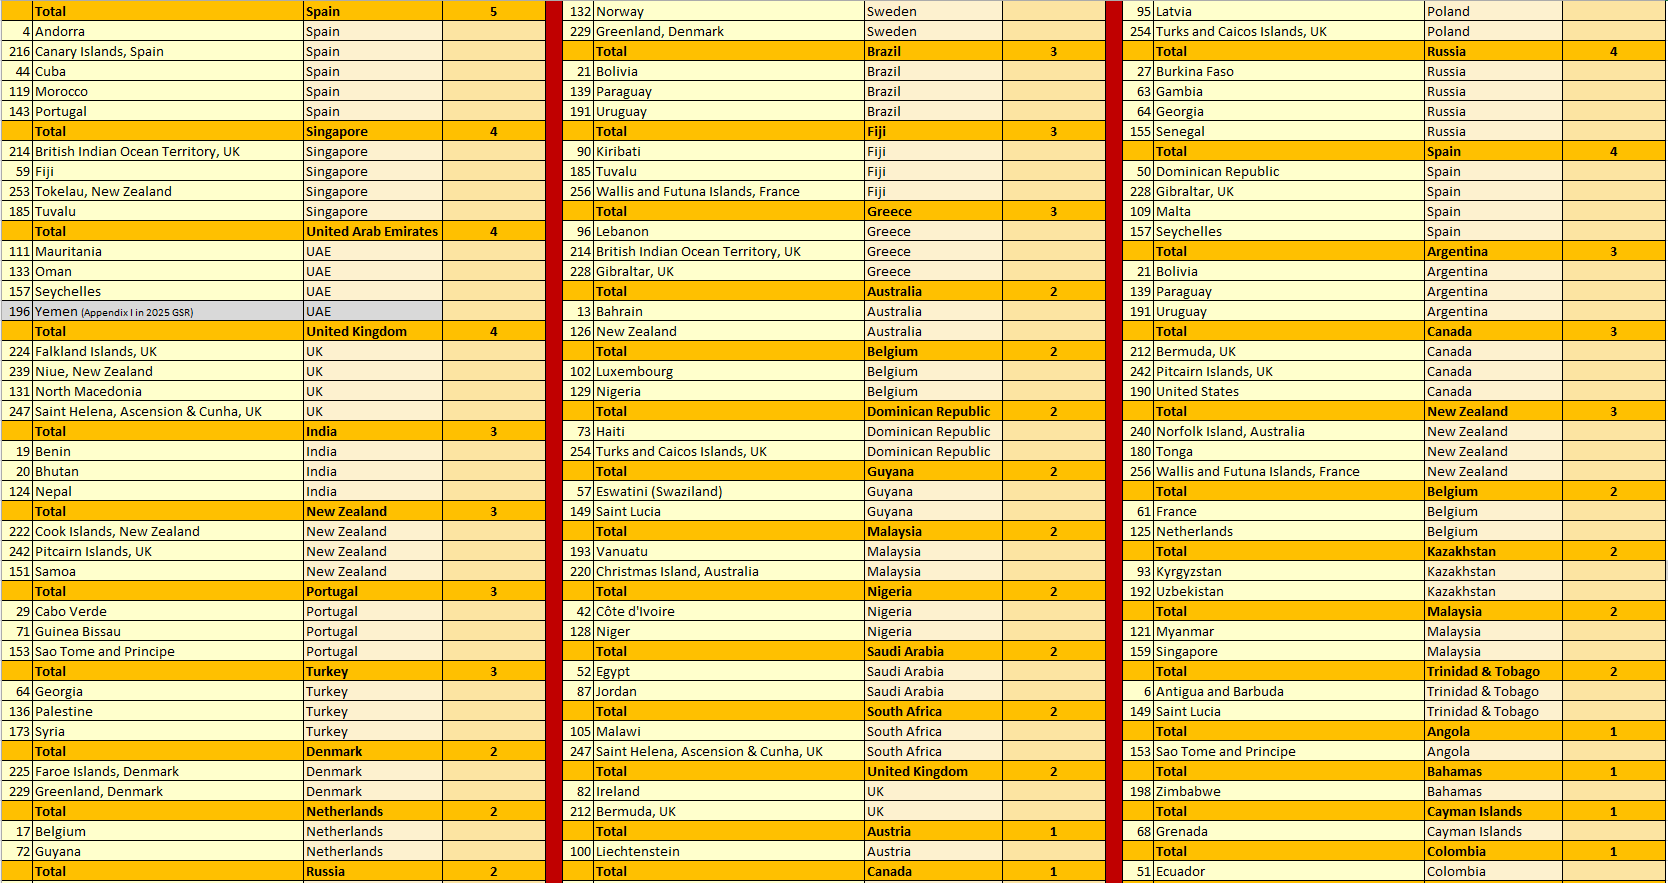
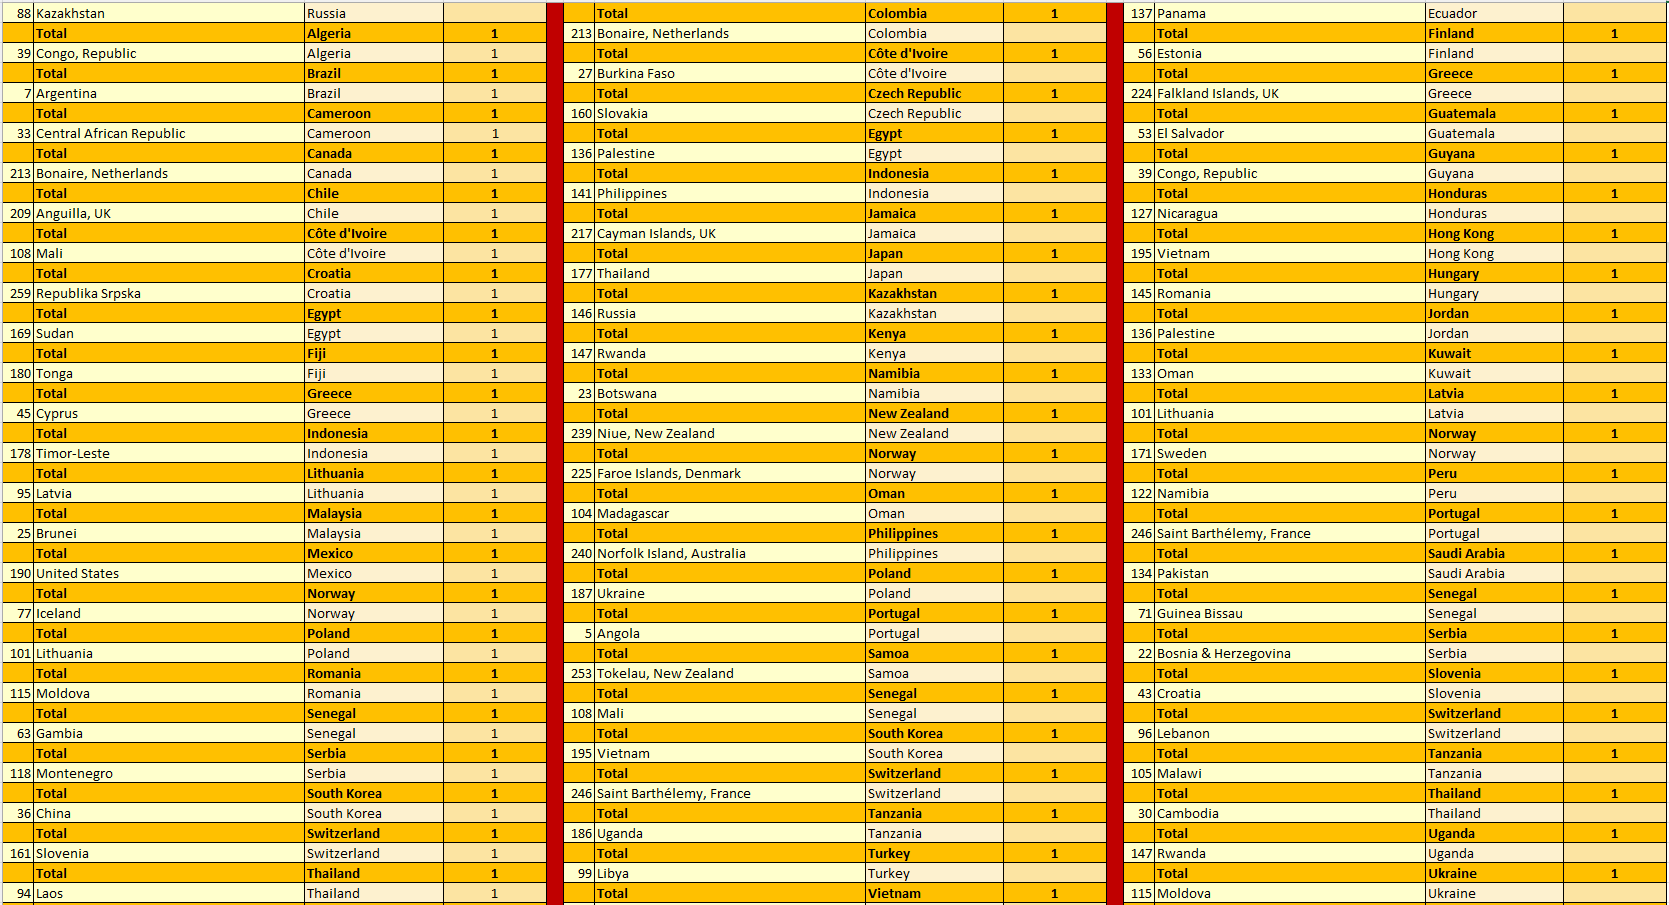
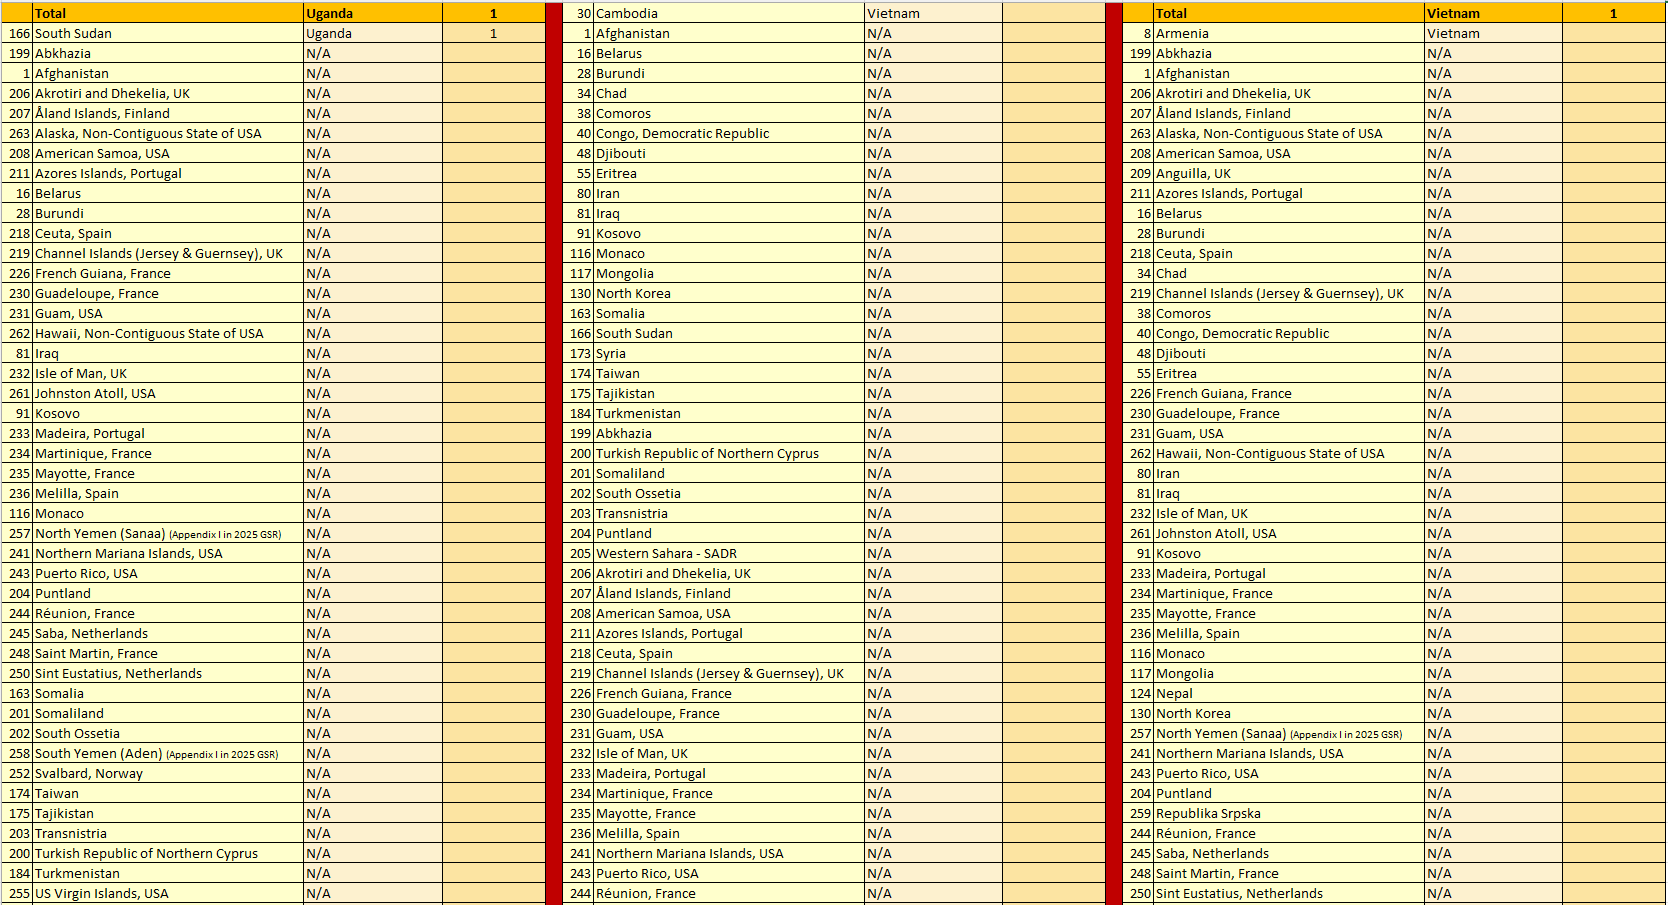

Section 3.3.4 In which Countries the Country is the Top 1/Top 2/Top 3 Export Partner, sorted by Global Top 1/Top 2/Top 3 Export Partner, Higher to Lower: All UN Members and Non-UN Members
Table 9. In which Countries the Country is the Top 1/Top 2/Top 3 Export Partner, sorted by Global Top 1/Top 2/Top 3 Export Partner, Higher to Lower

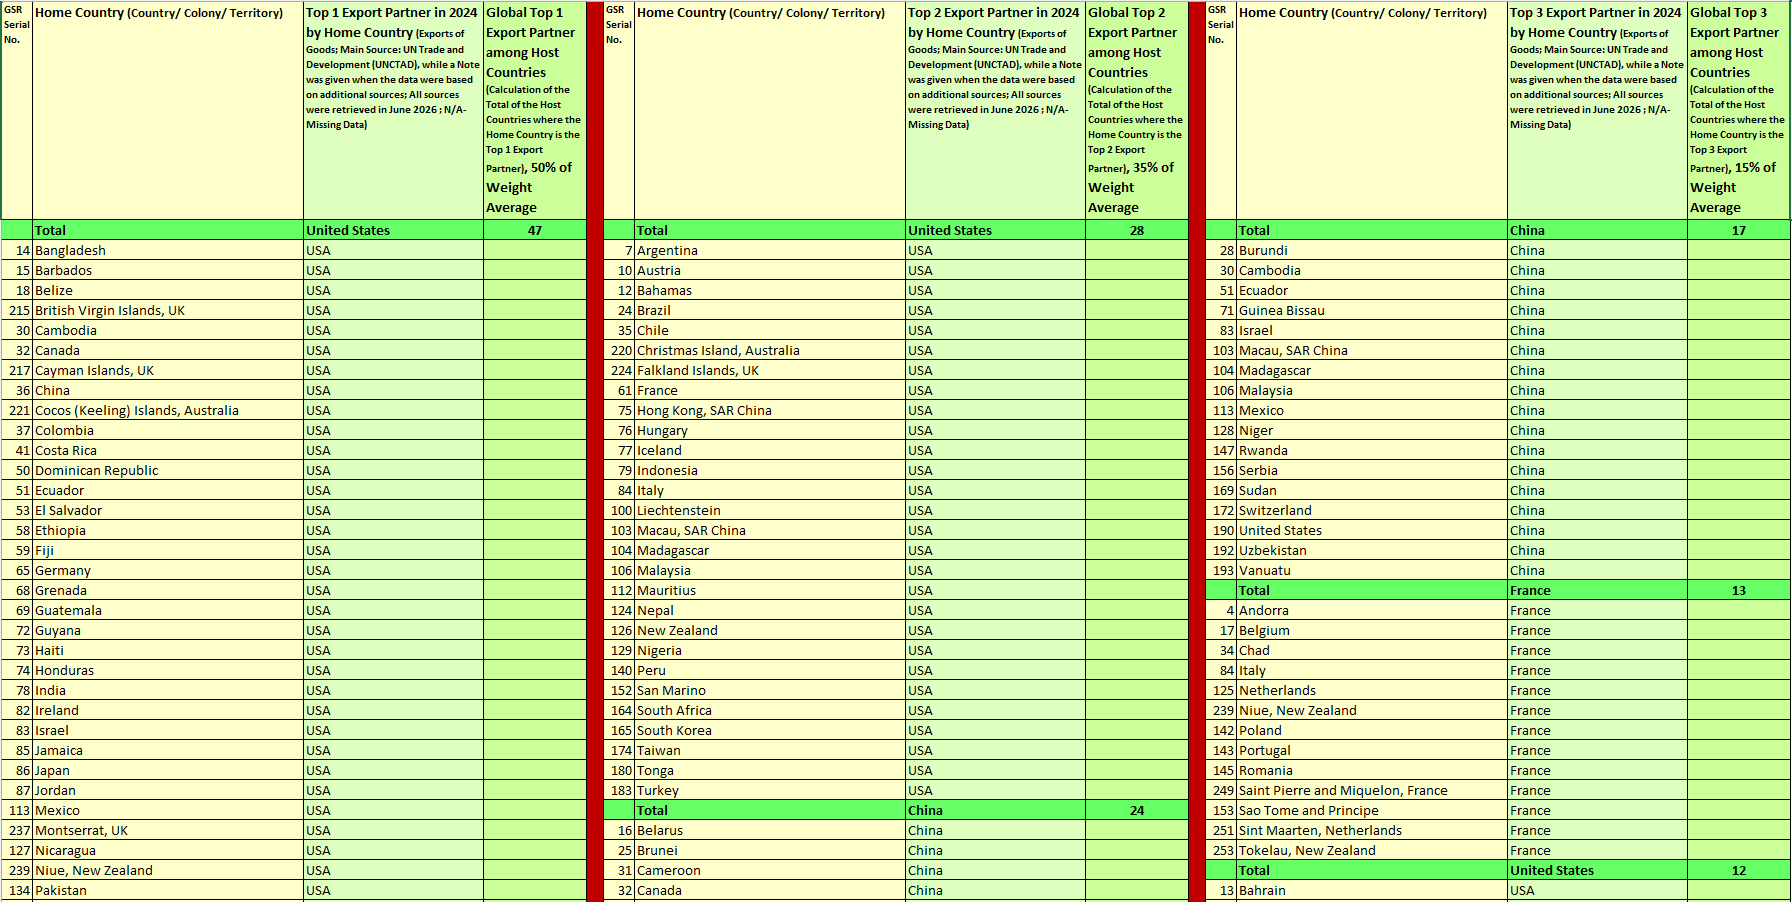
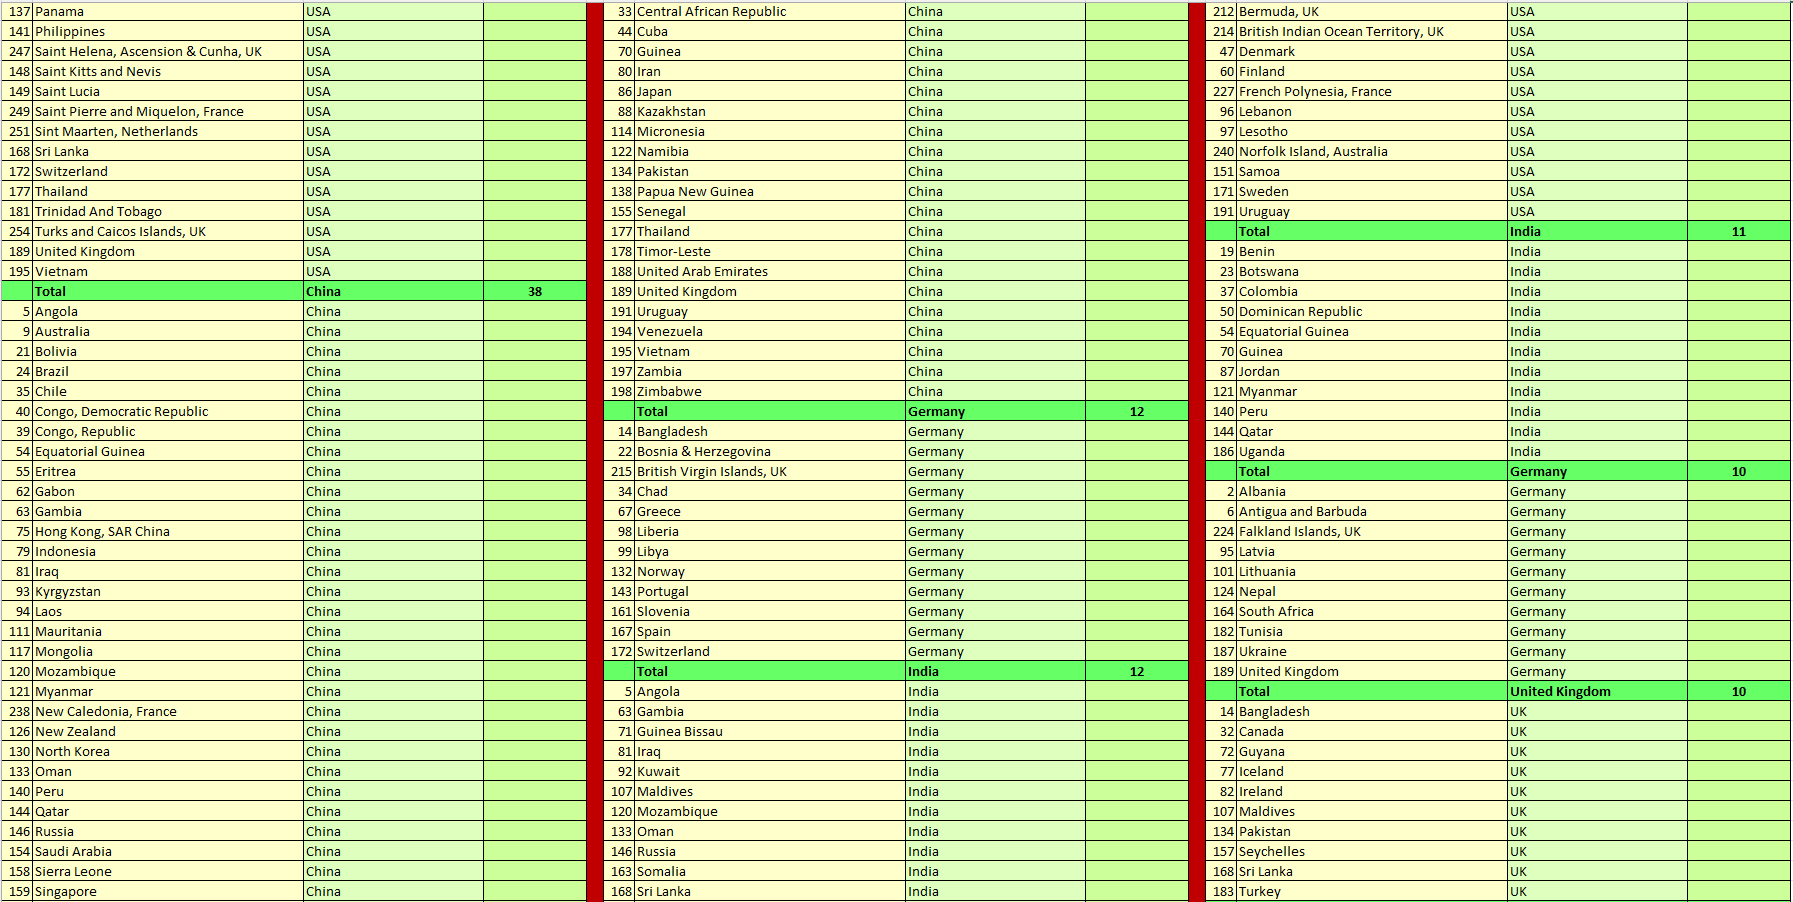
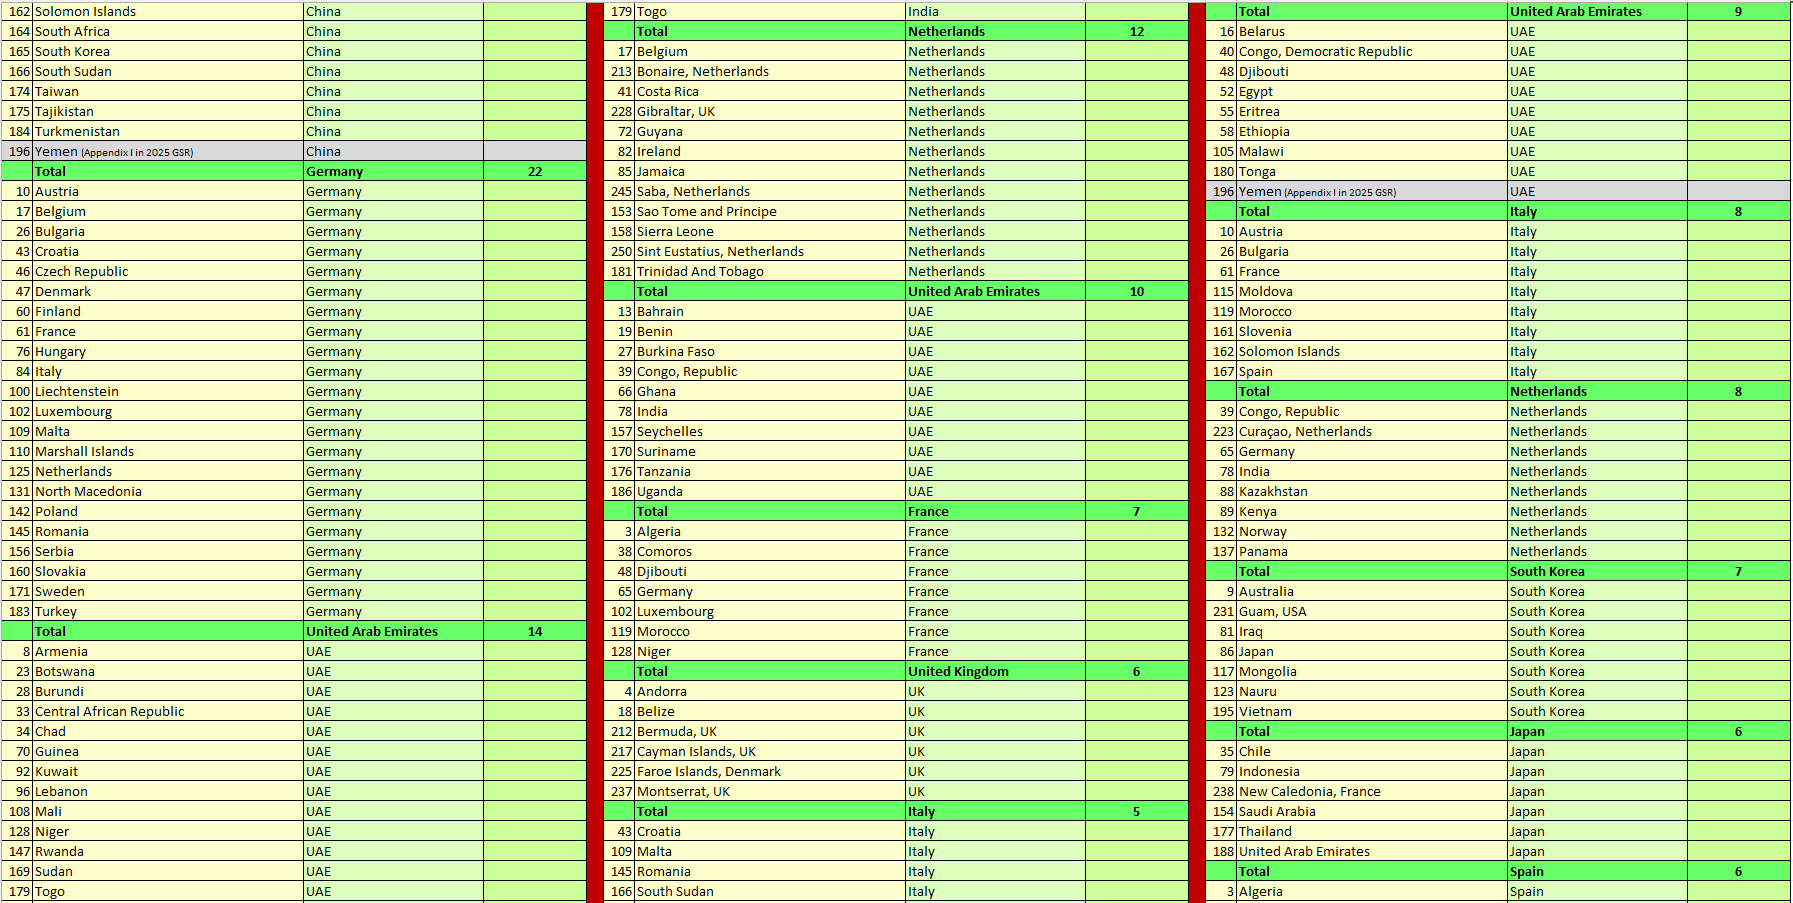
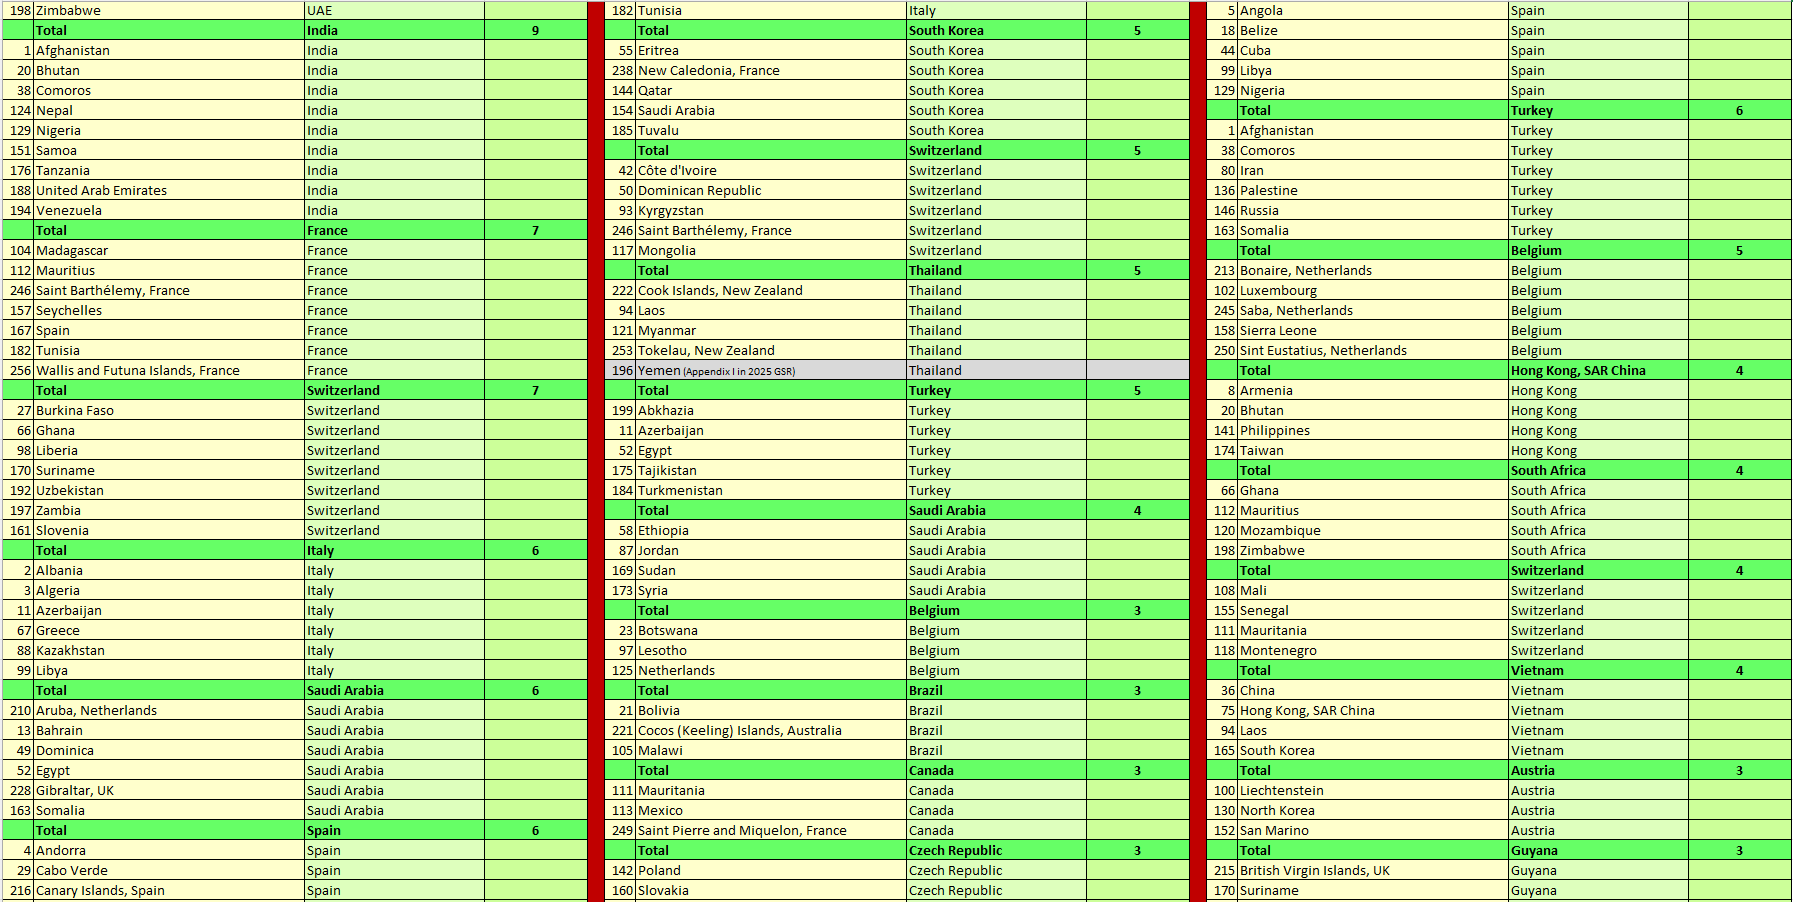
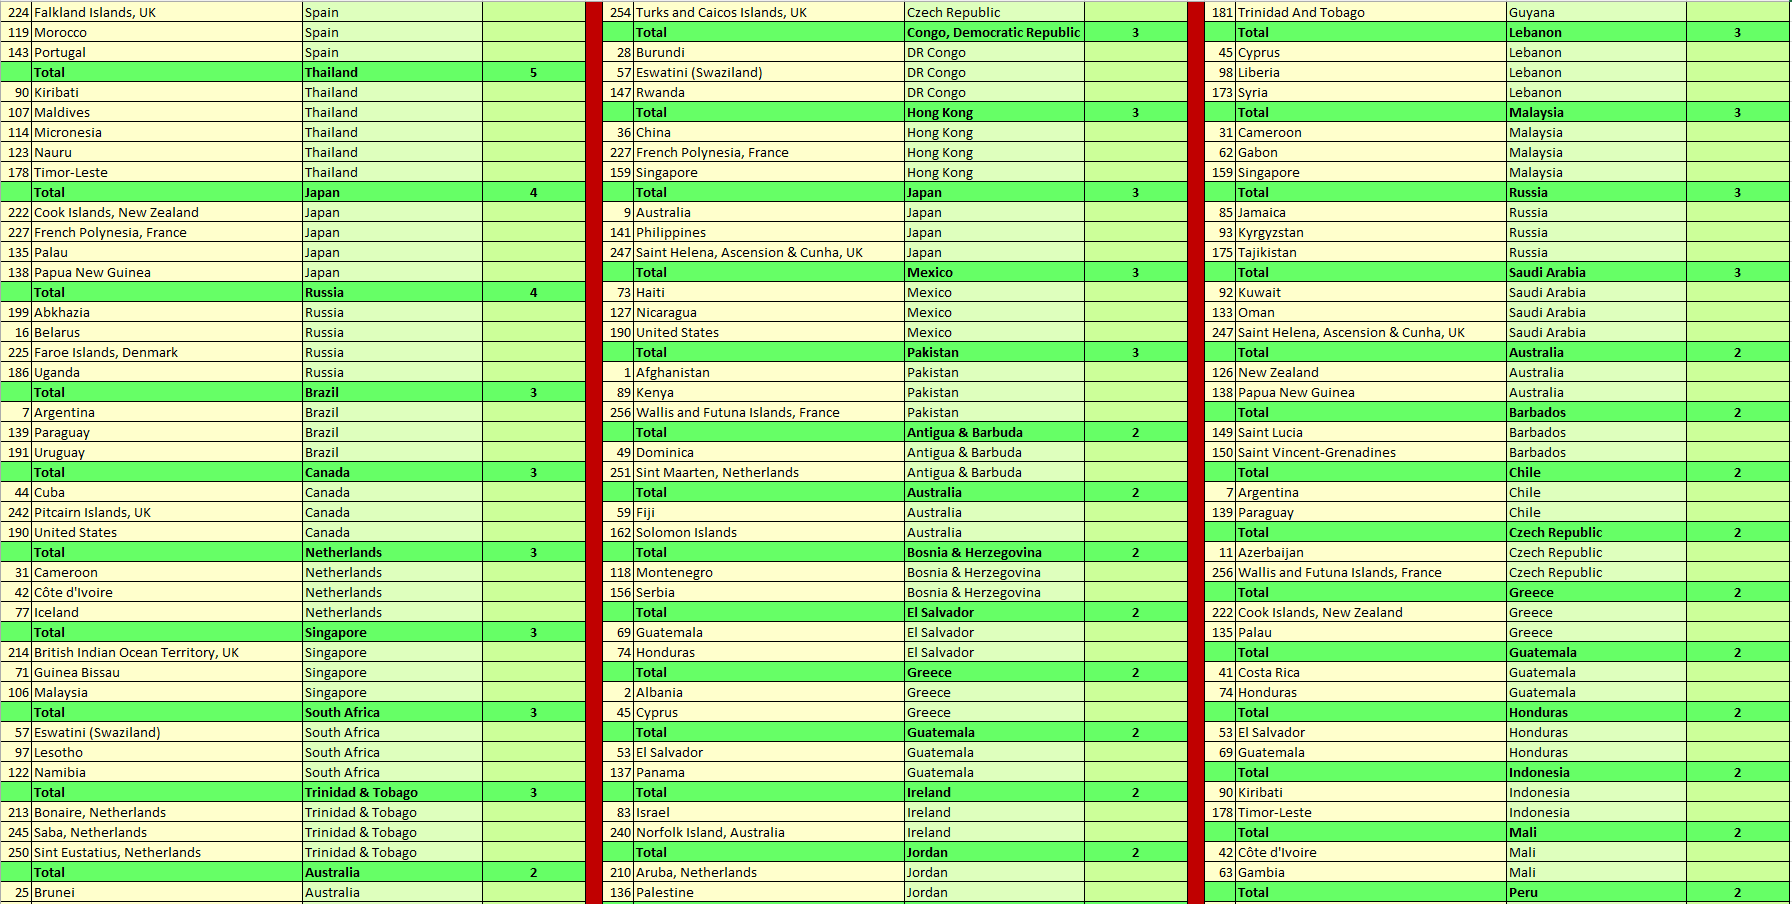
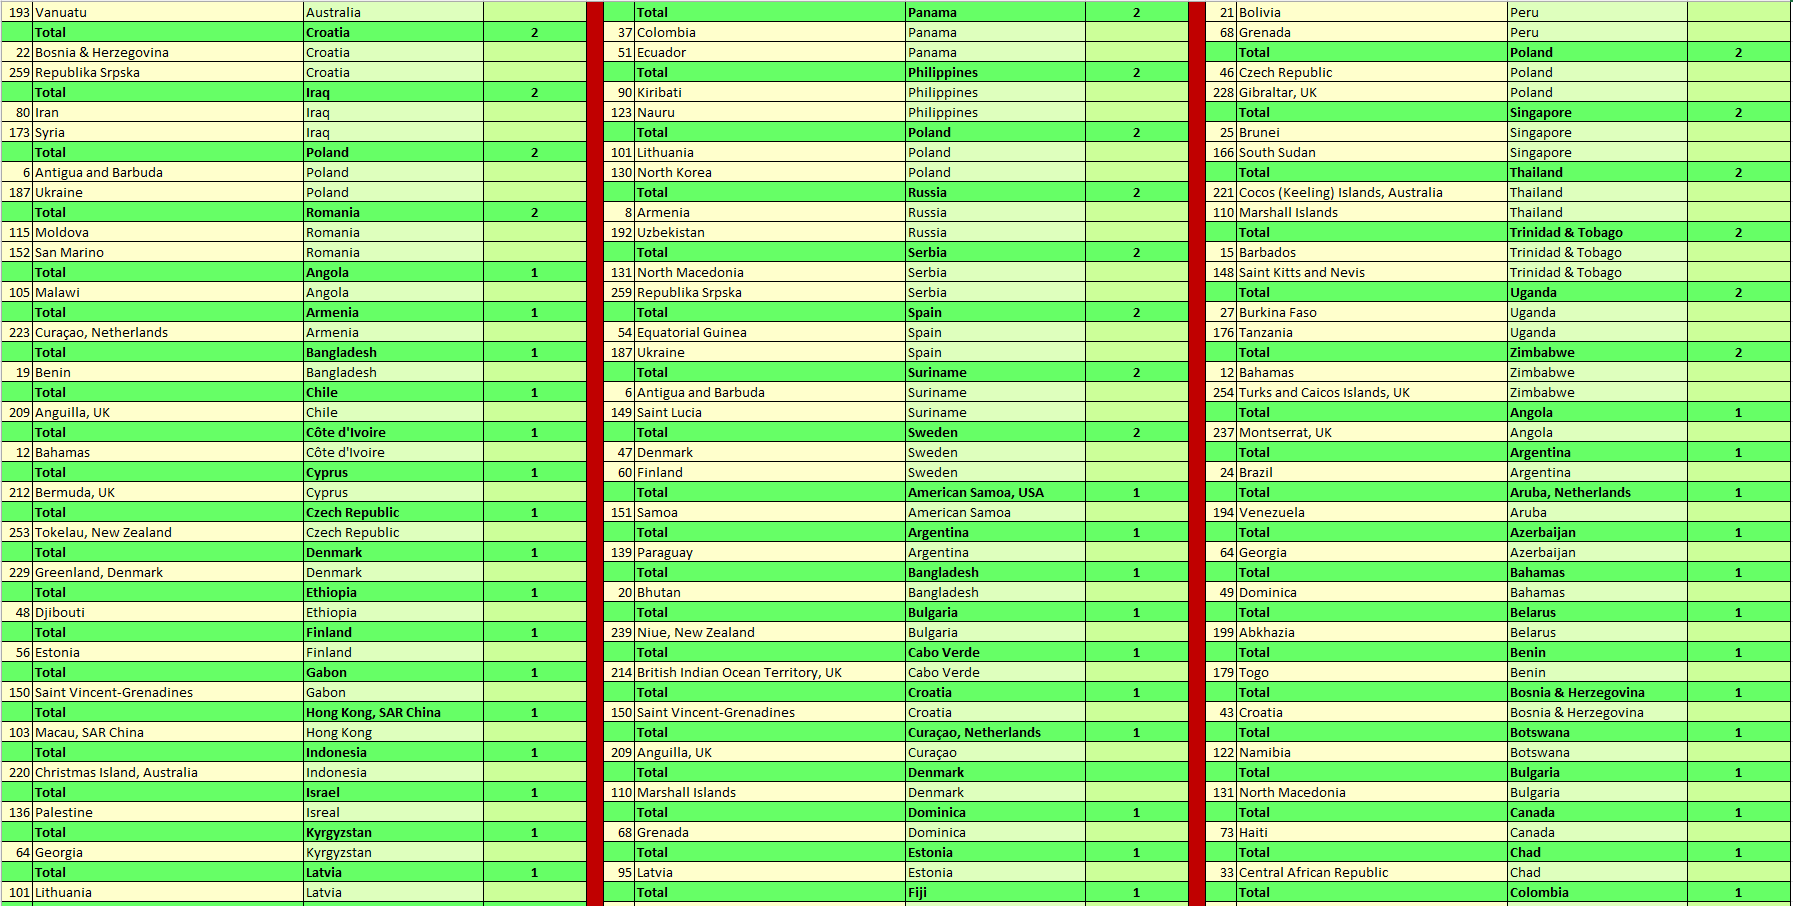
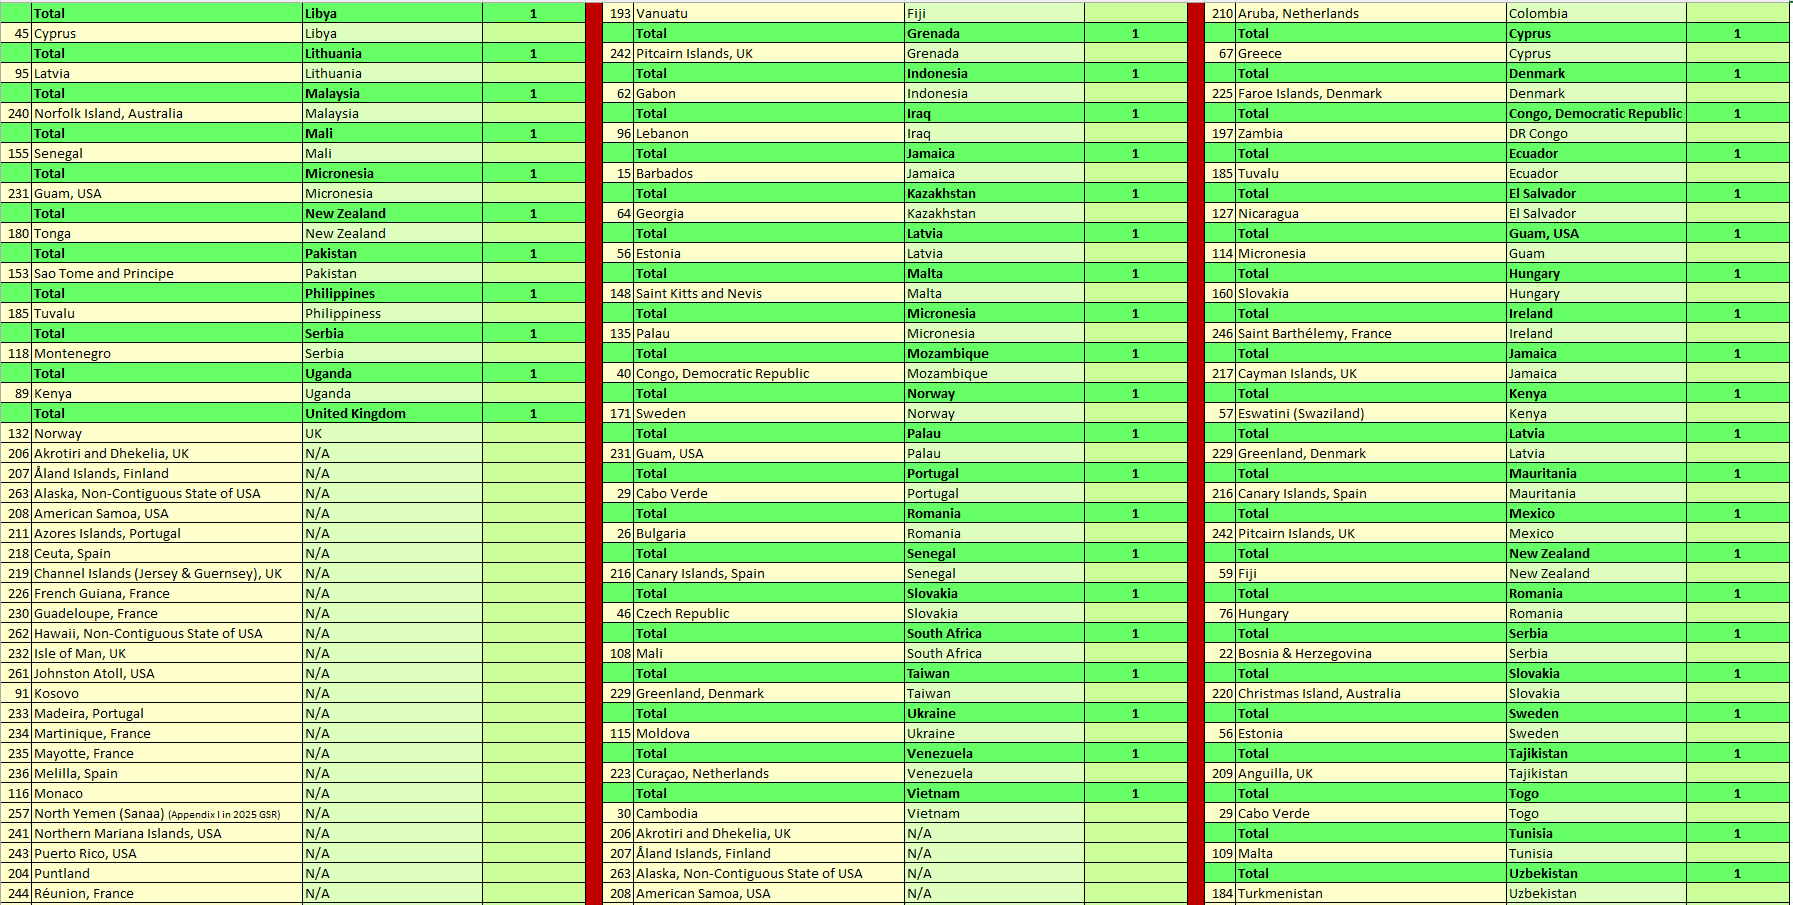
Section 3.4. Analysis of International Trade Balance, Total Exports and Total Imports in 2024: All UN Members and Non-UN Members
Section 3.4.1 Comparison of International Trade Balance in 2024: All UN Members and Non-UN Members
Table 10. International Trade Balance: All UN Members and Non-UN Members with a Positive International Trade Balance, sorted from Higher to Lower
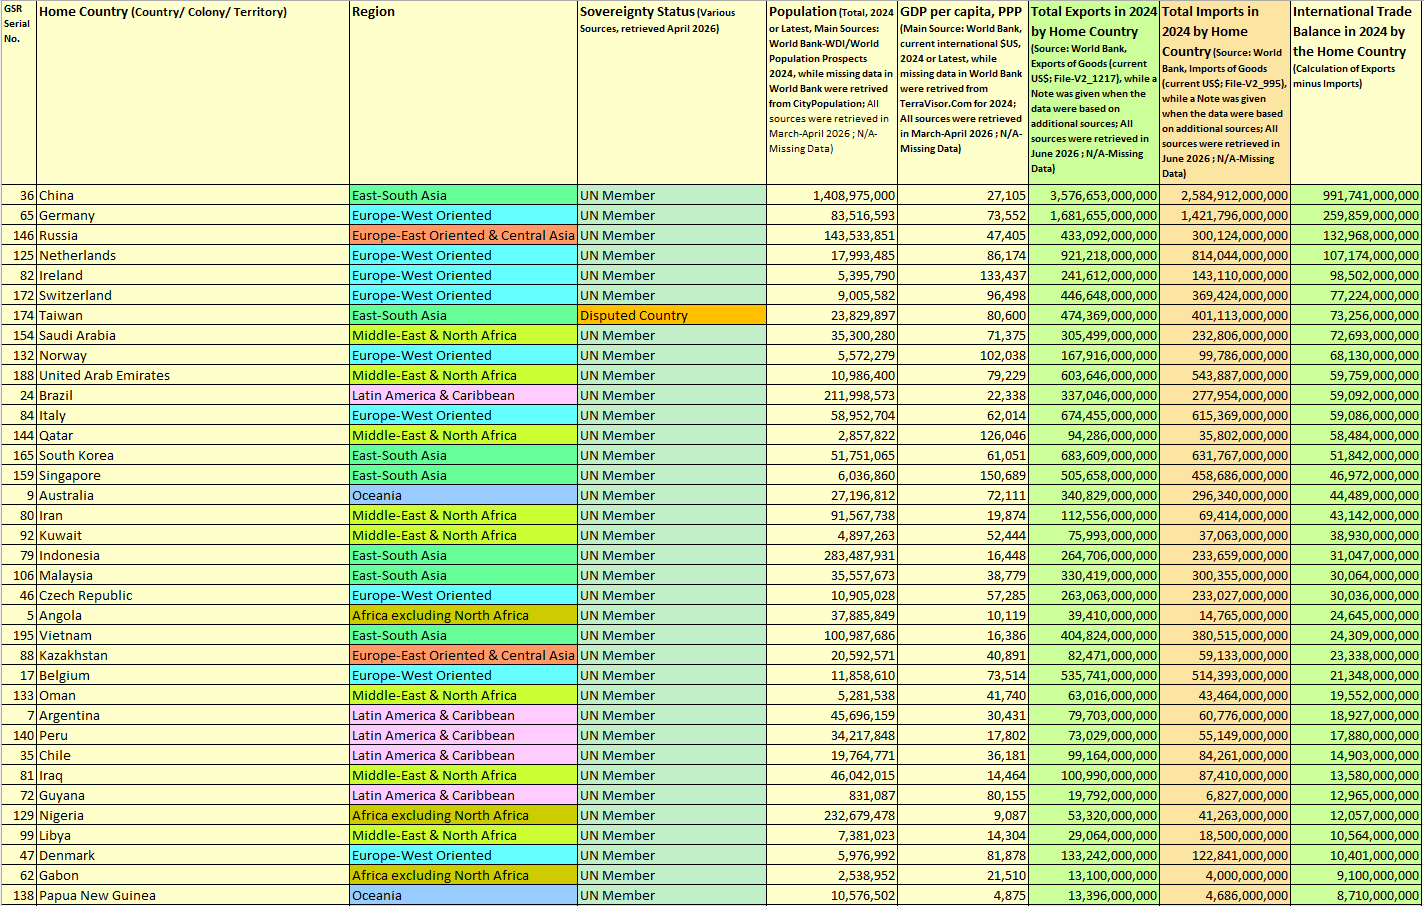
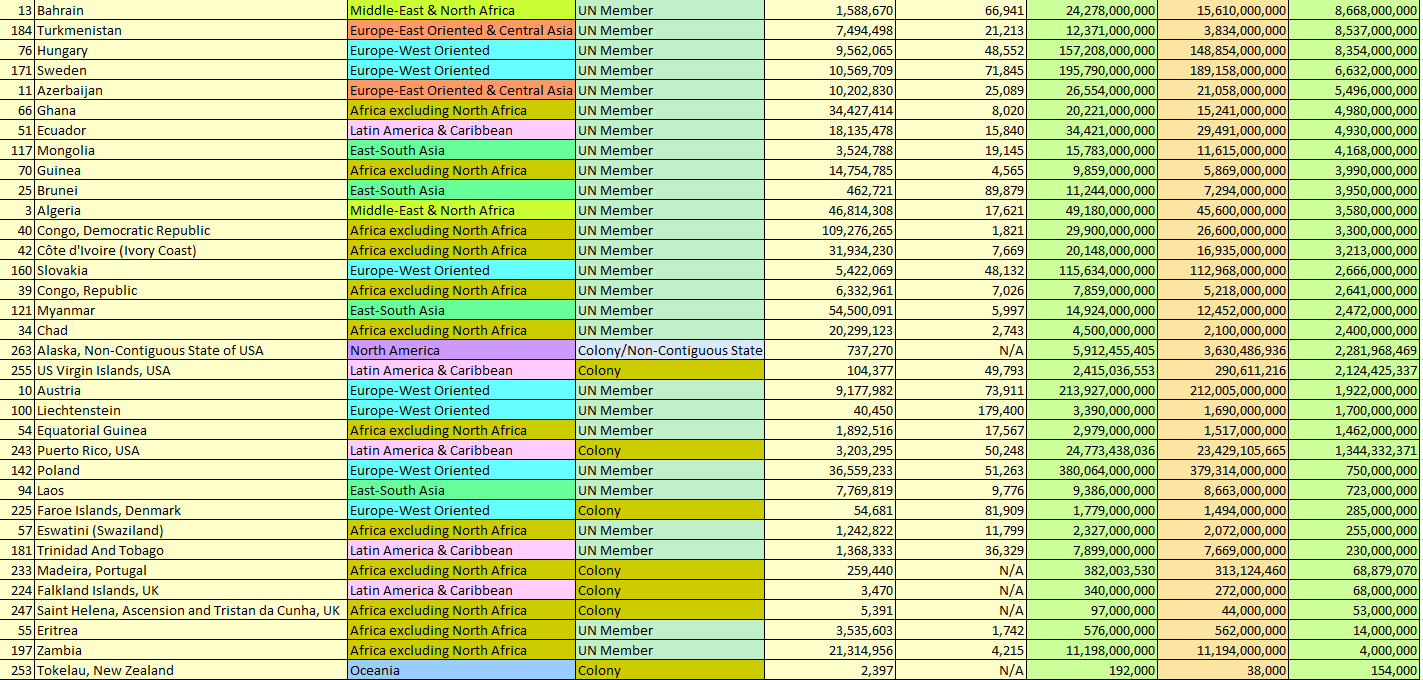
Table 11. International Trade Balance: All UN Members and Non-UN Members with a Negative International Trade Balance, sorted from Higher to Lower
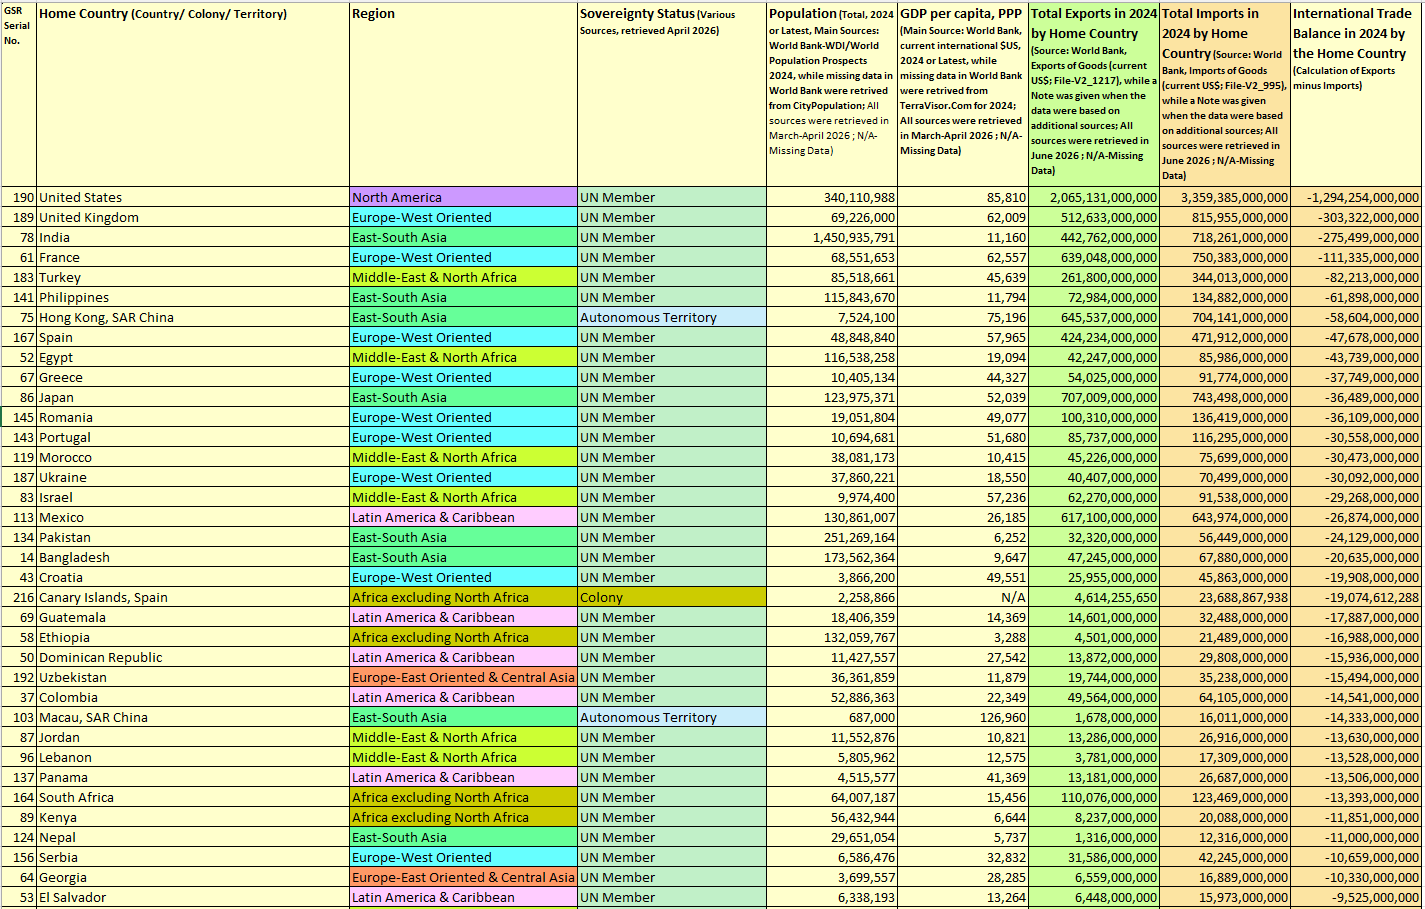
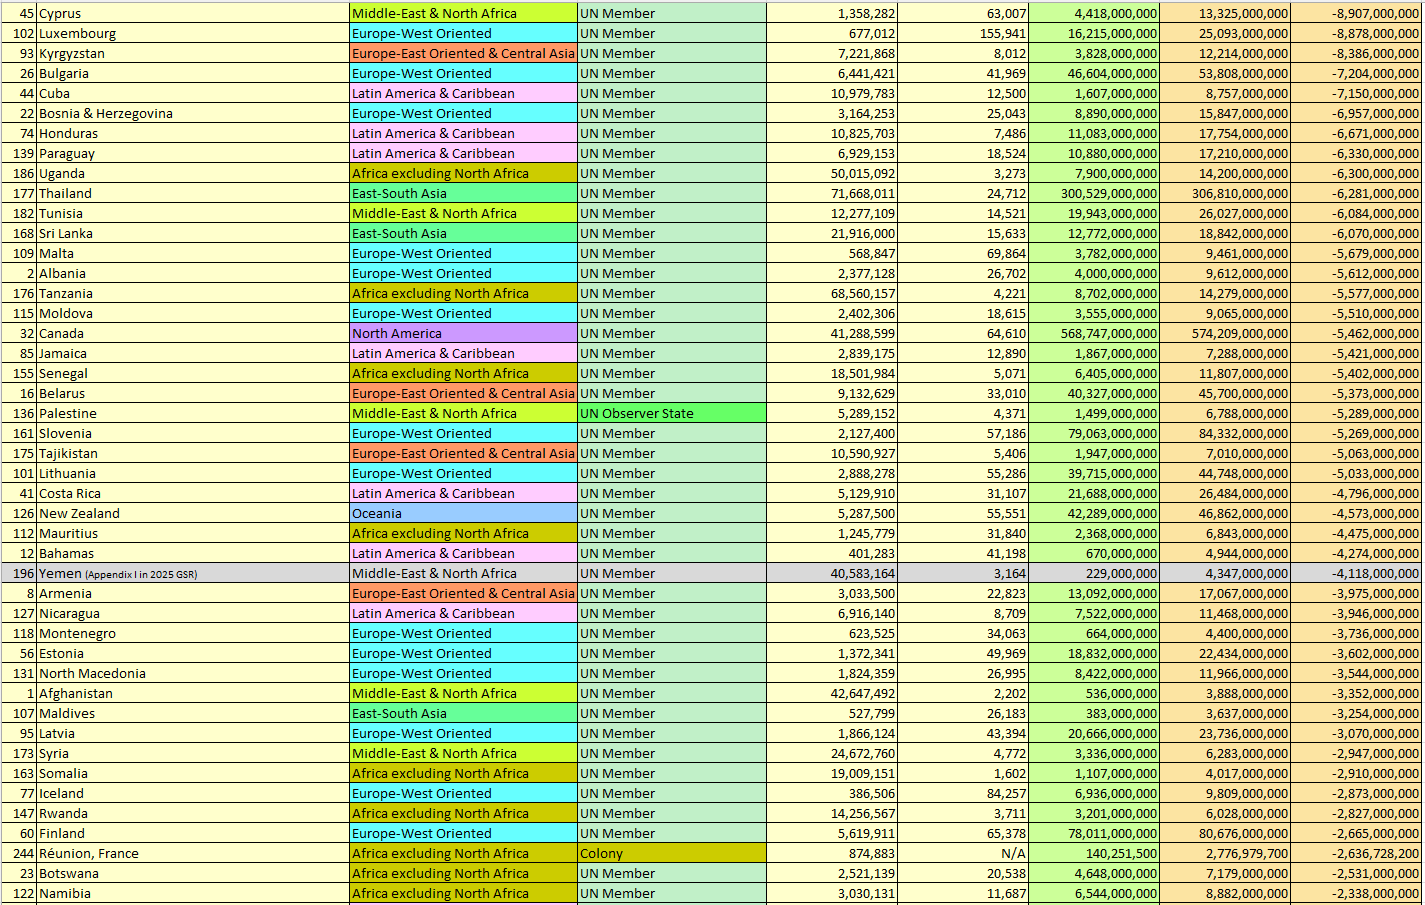
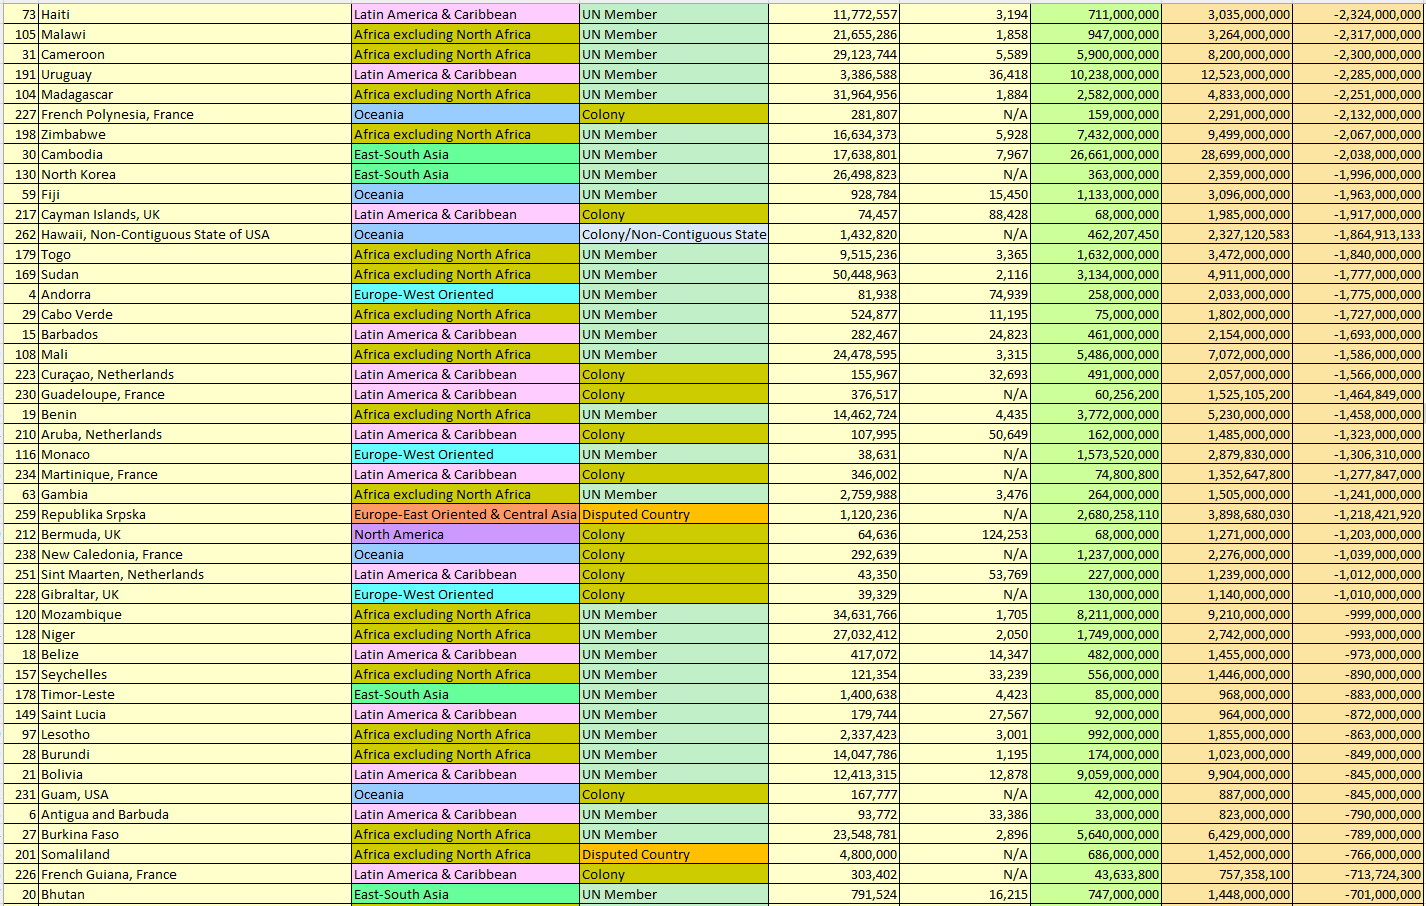
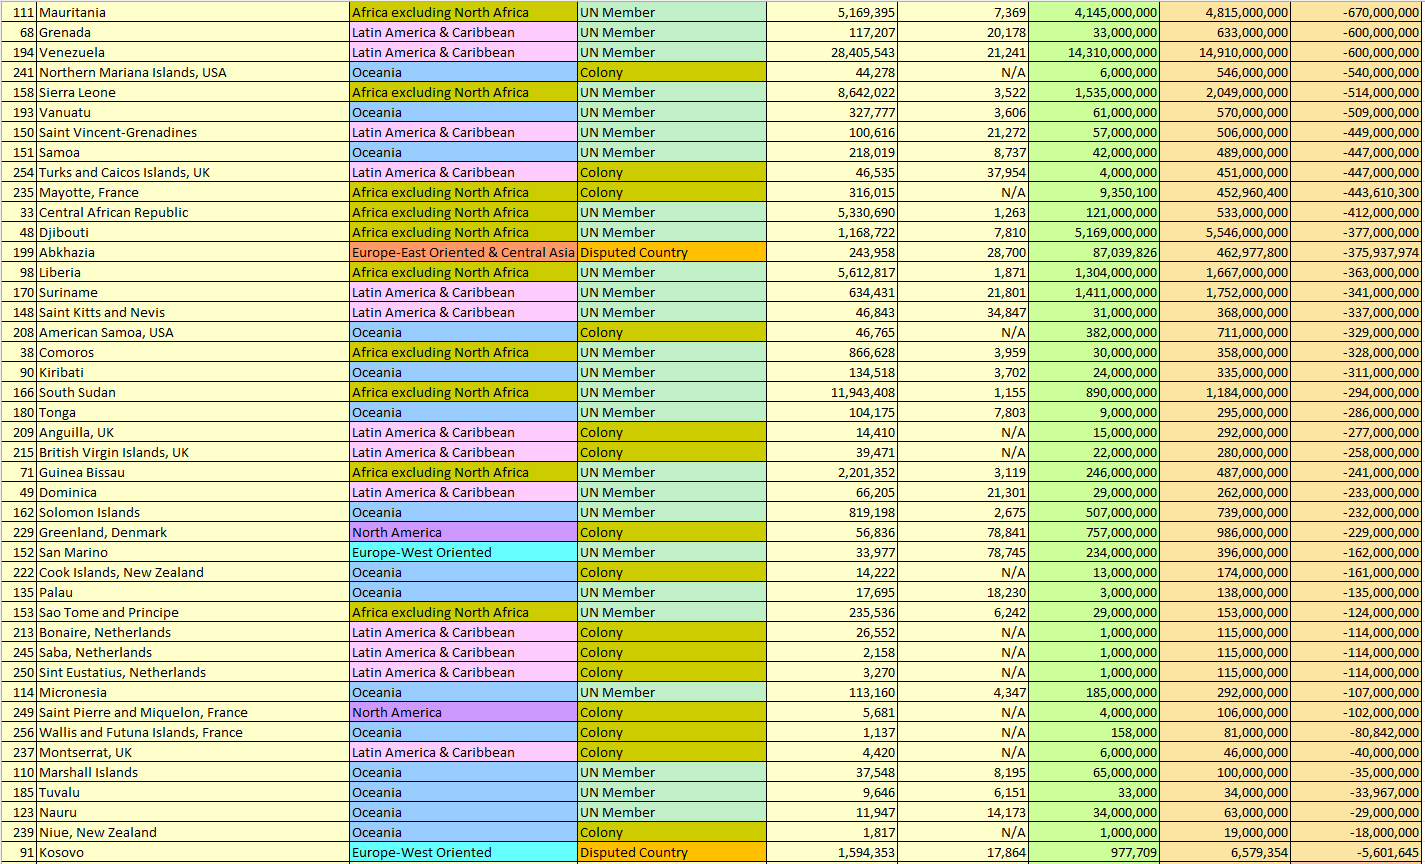
Section 3.4.2 Comparison of Total Imports in 2024: All UN Members and Non-UN Members
Table 12. Total Imports in 2024: All UN Members and Non-UN Members, sorted from Higher to Lower
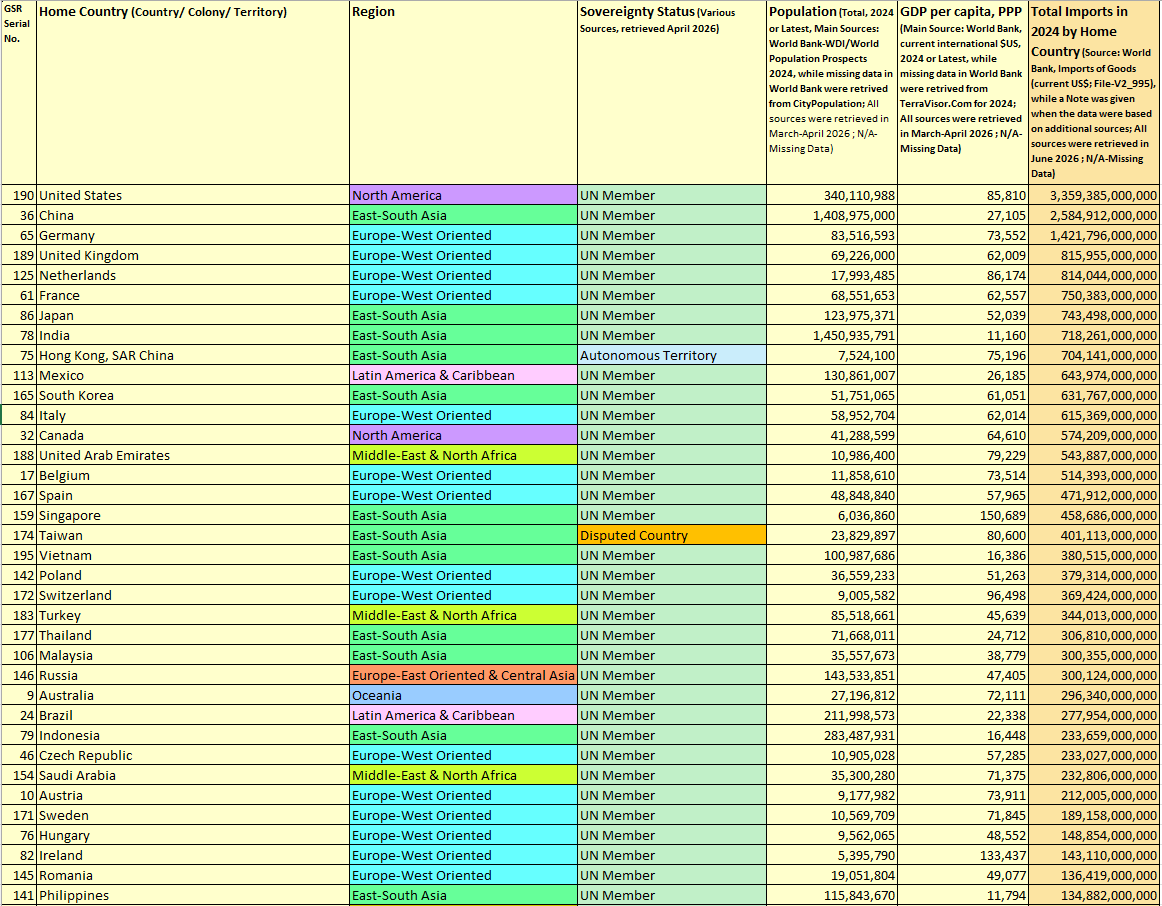
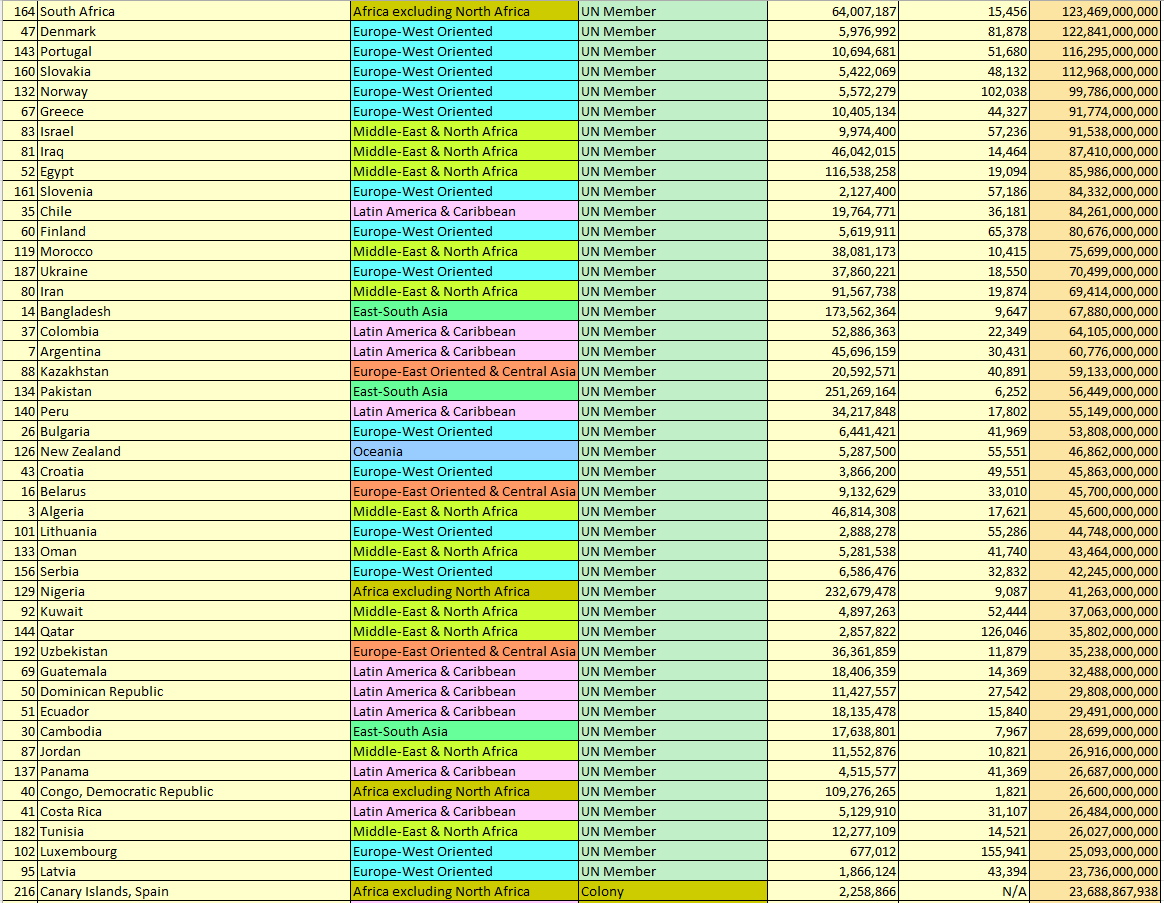
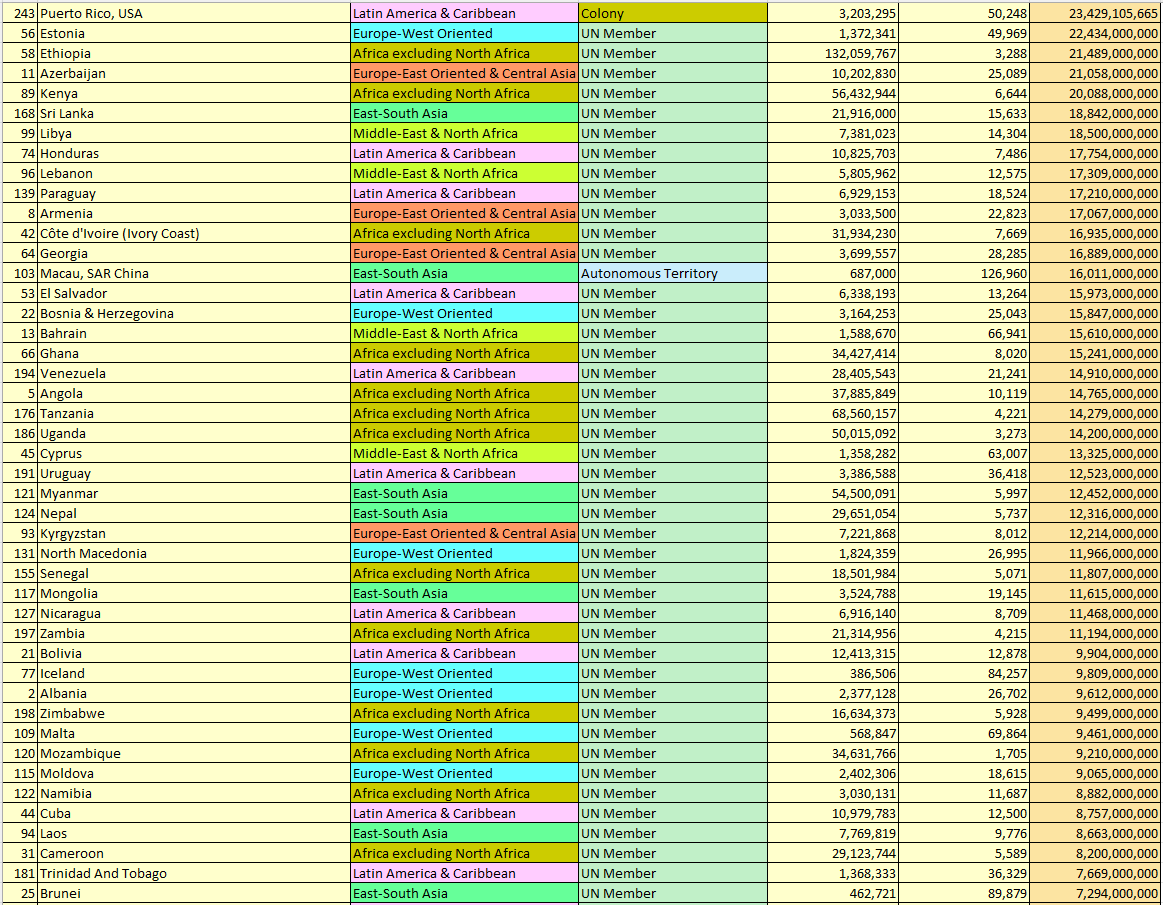
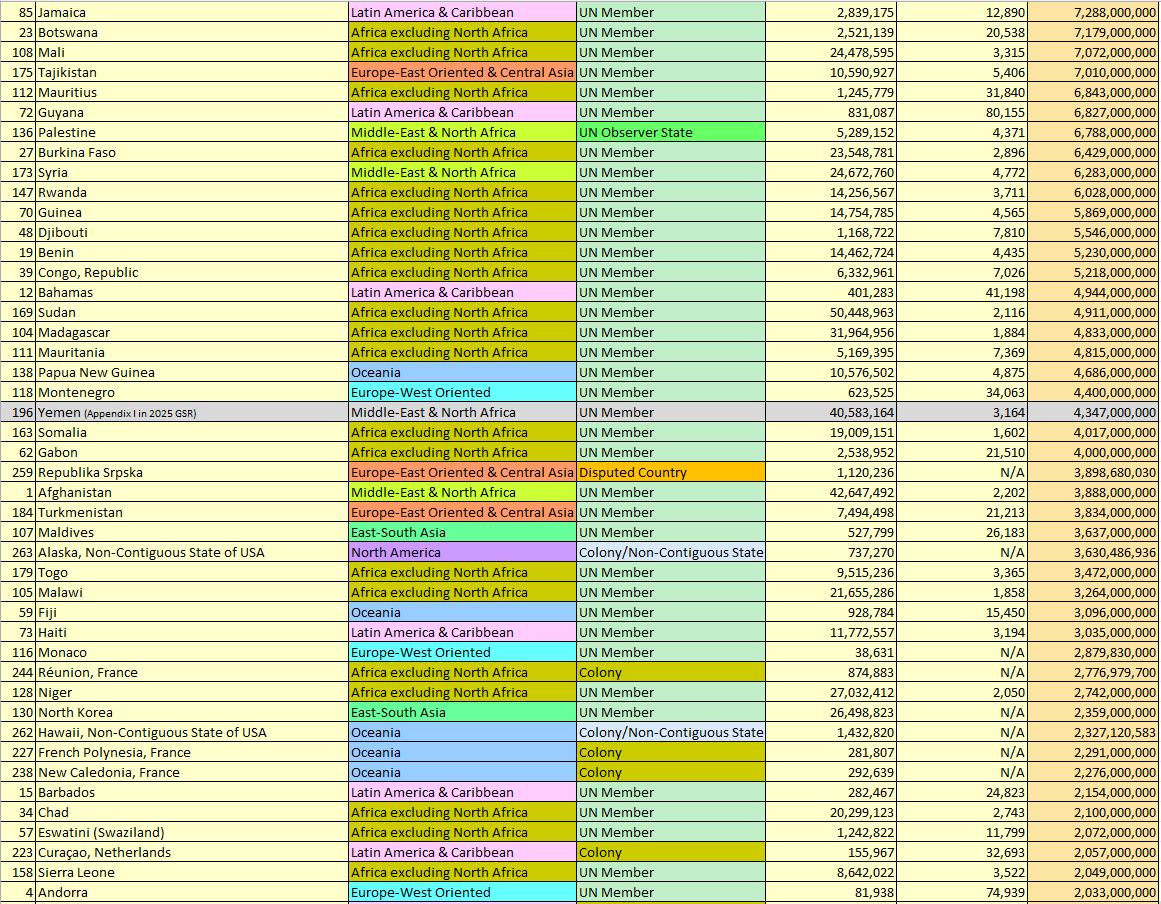
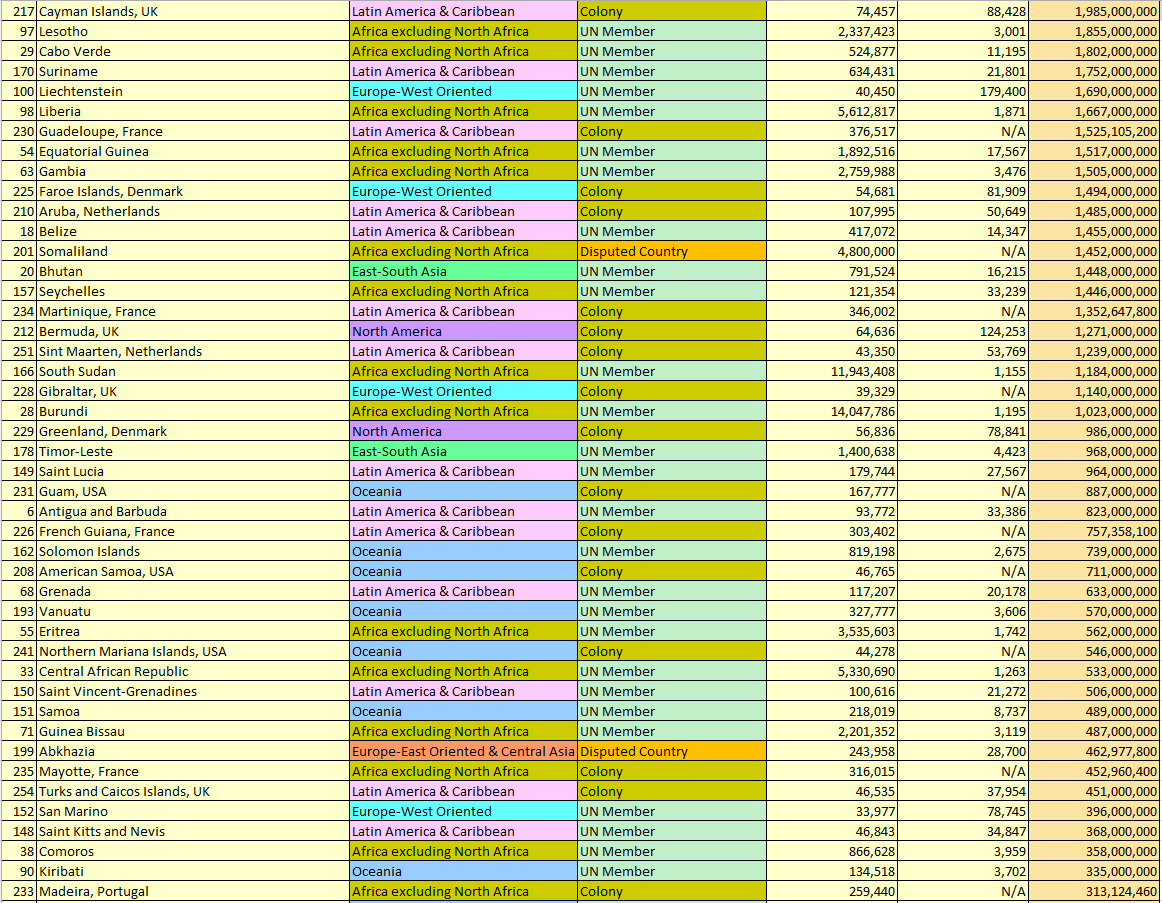
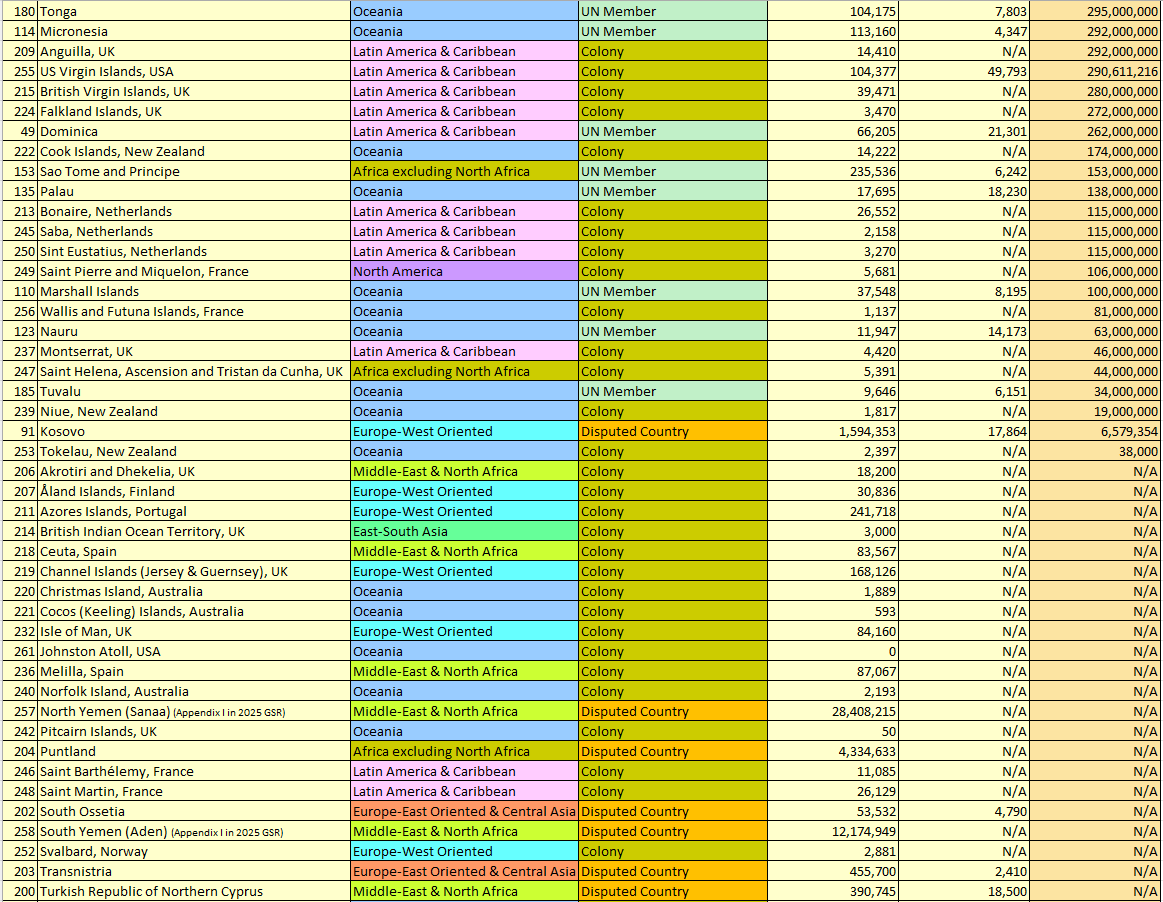

Section 3.4.3 Comparison of Total Exports in 2024: All UN Members and Non-UN Members
Table 13. Total Exports in 2024: All UN Members and Non-UN Members, sorted from Higher to Lower
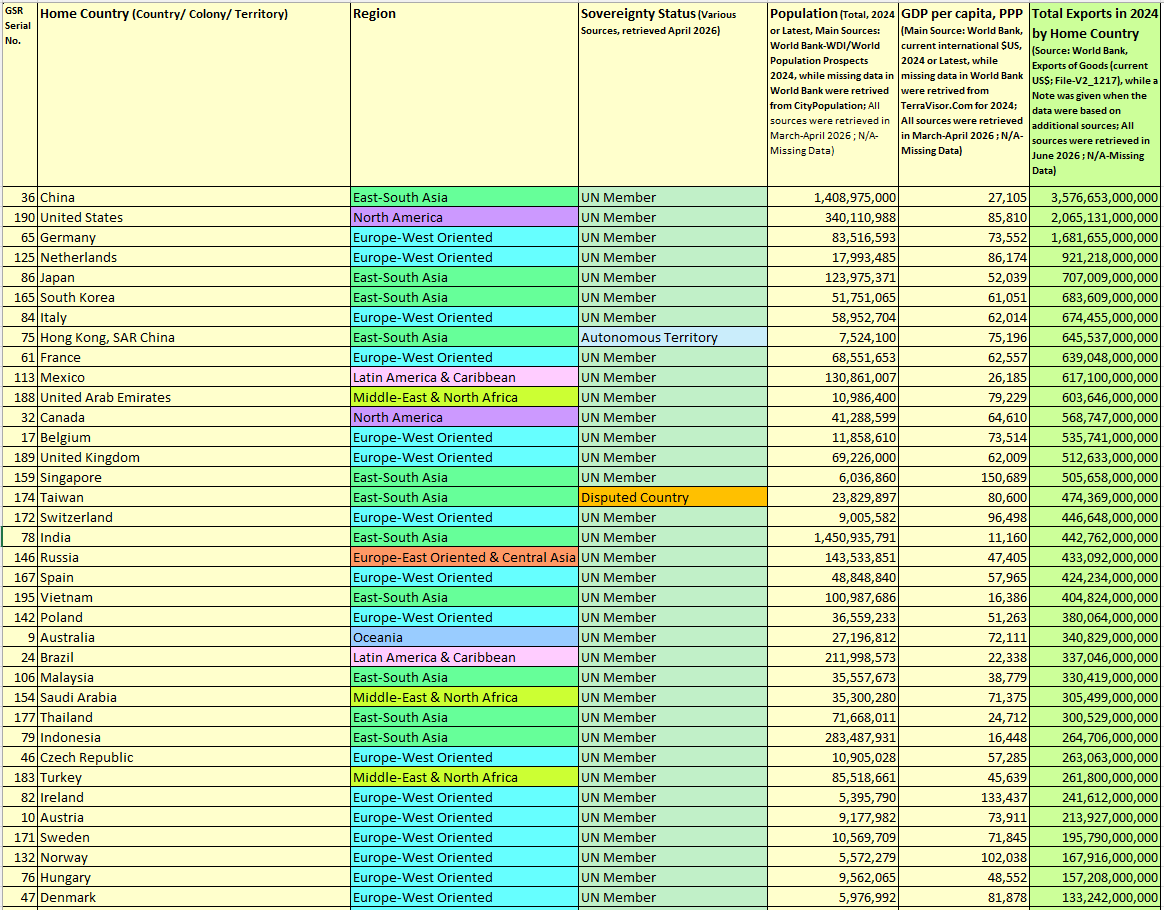
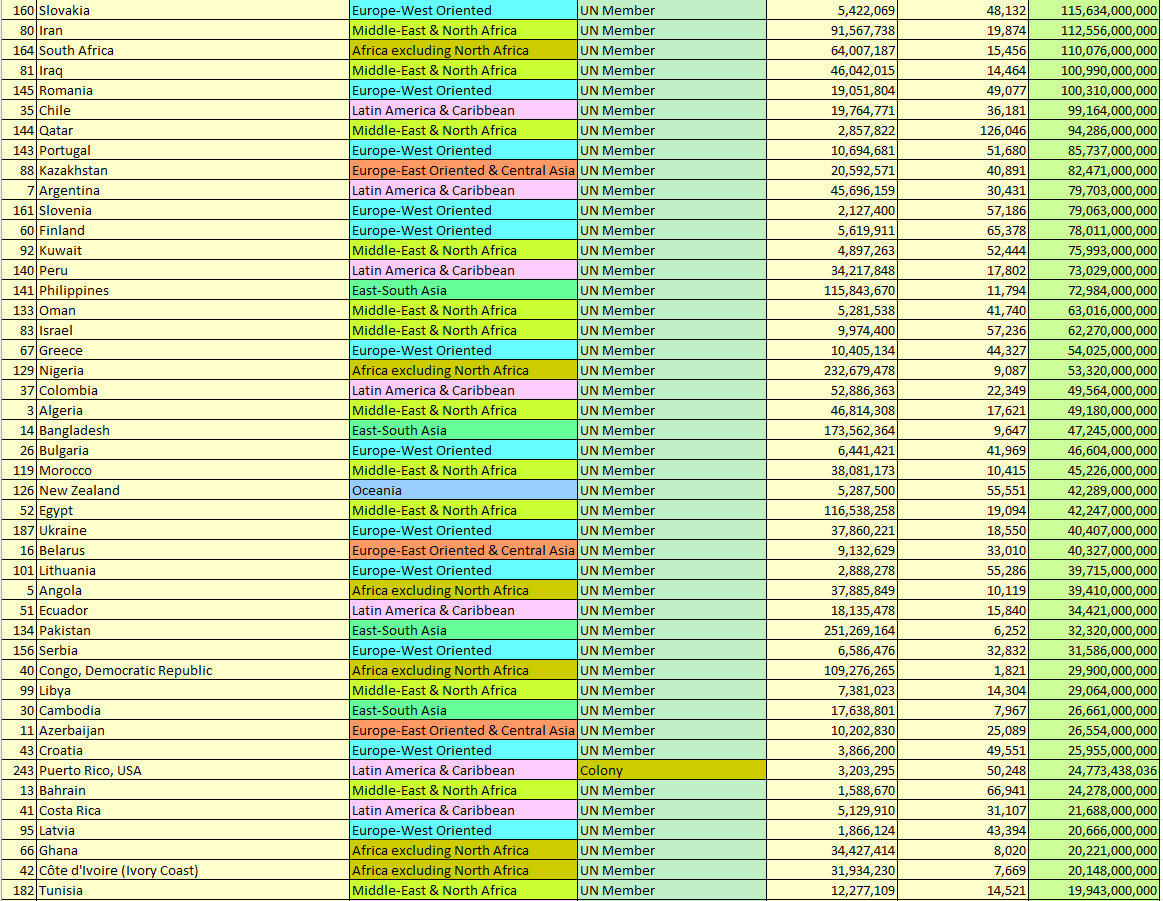
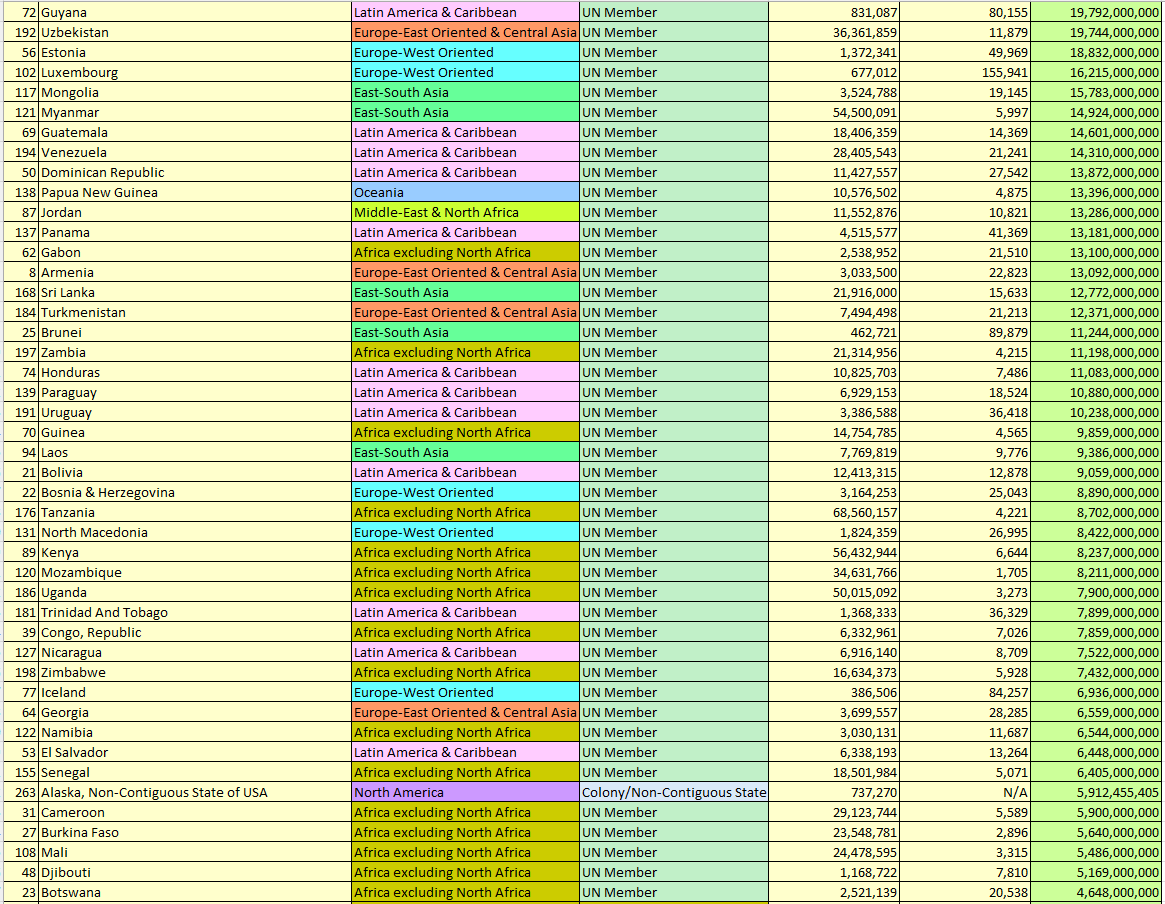
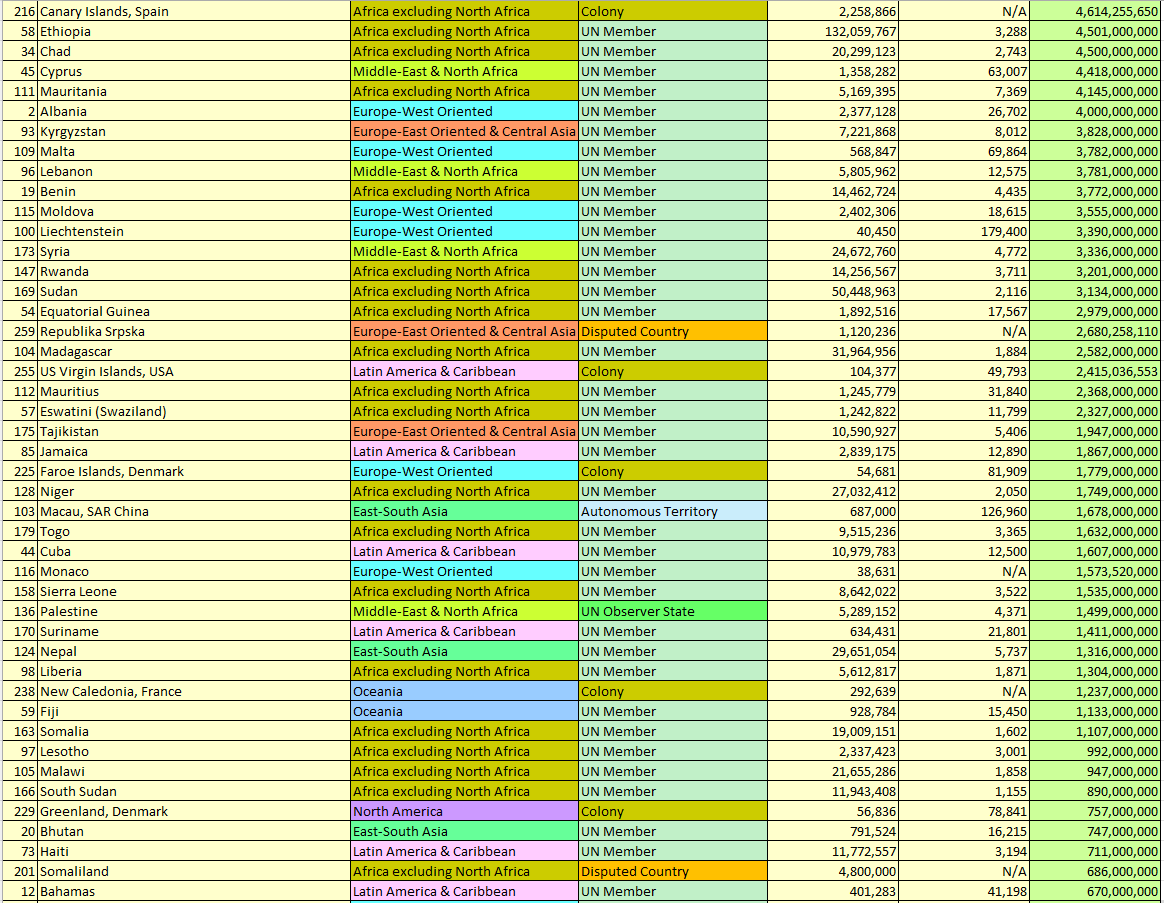
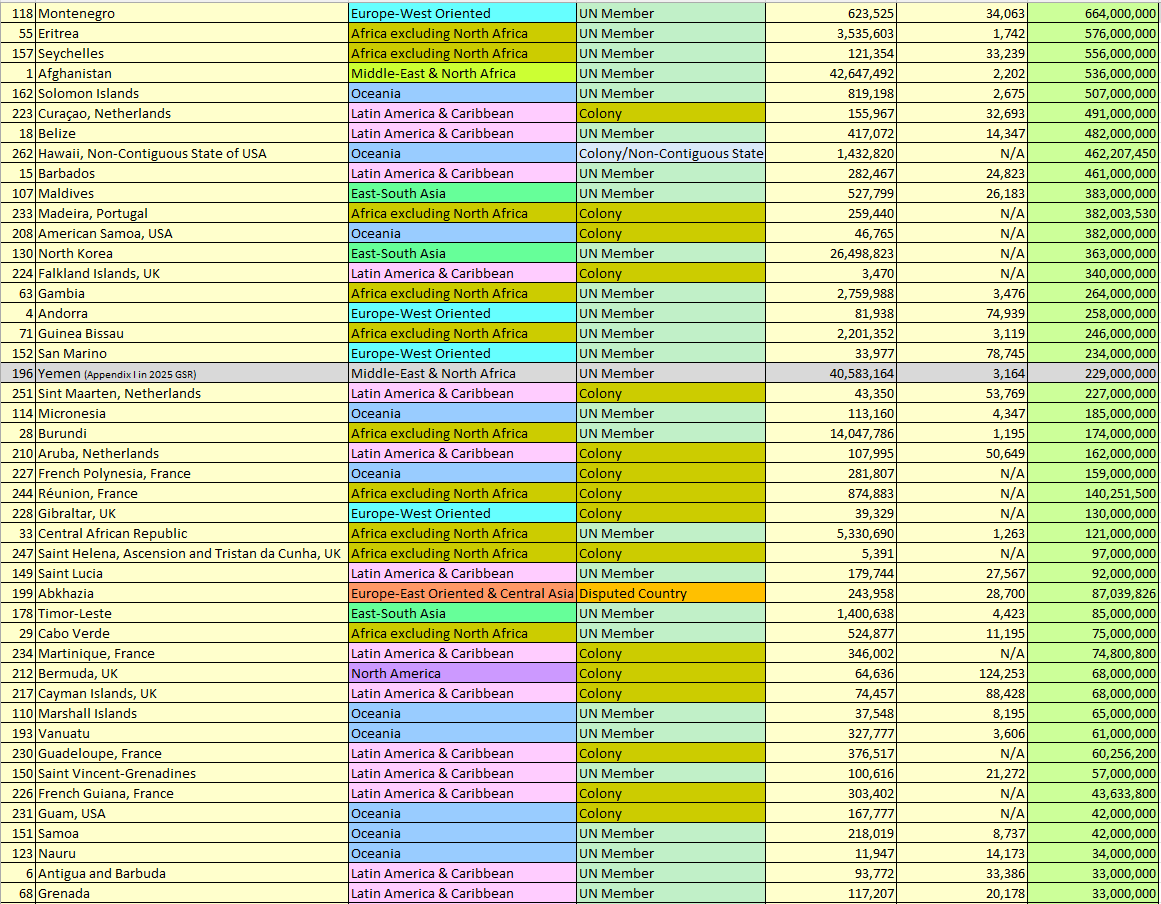
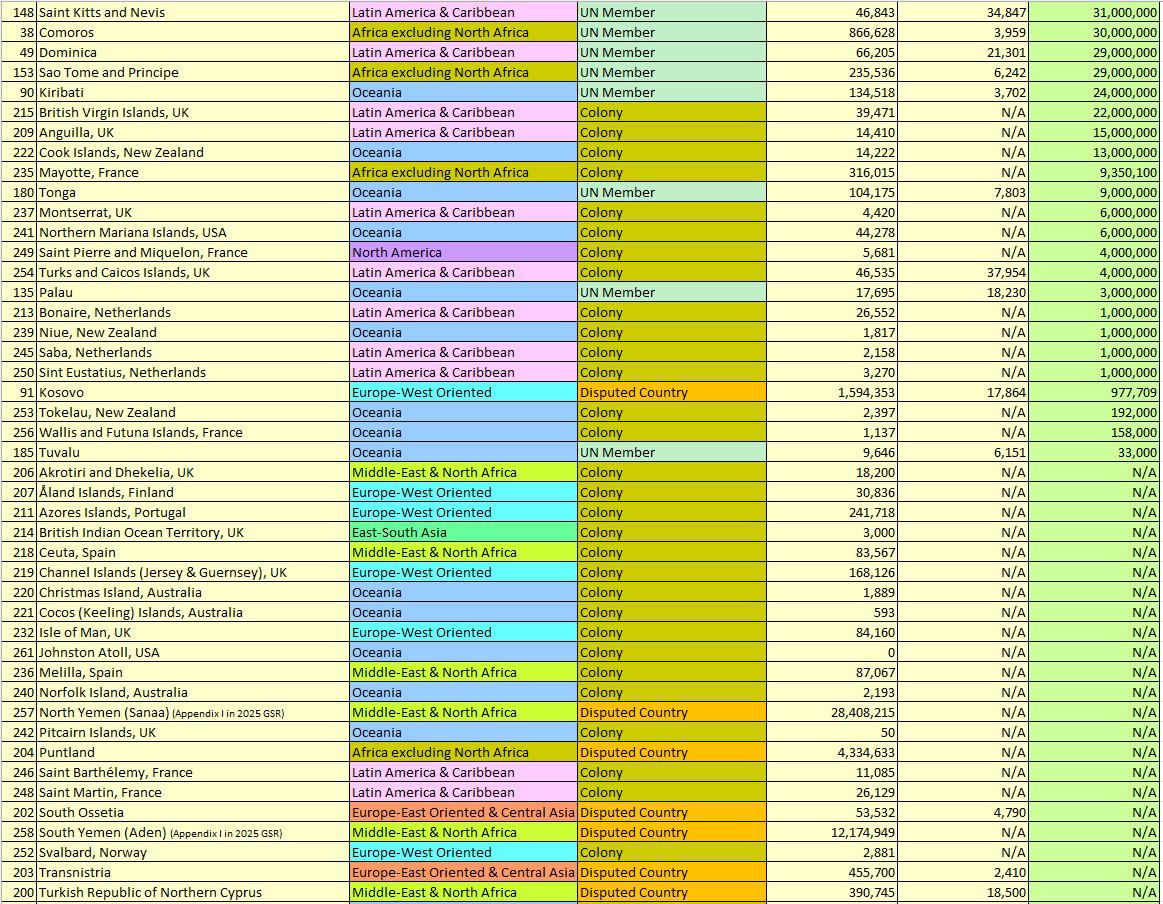

Section 3.5 The Impact of the Geopolitical Position Factors on International Trade
Table 14. Geopolitical Position Factors: All UN Members and Non-UN Members, sorted by Alphabetical Order
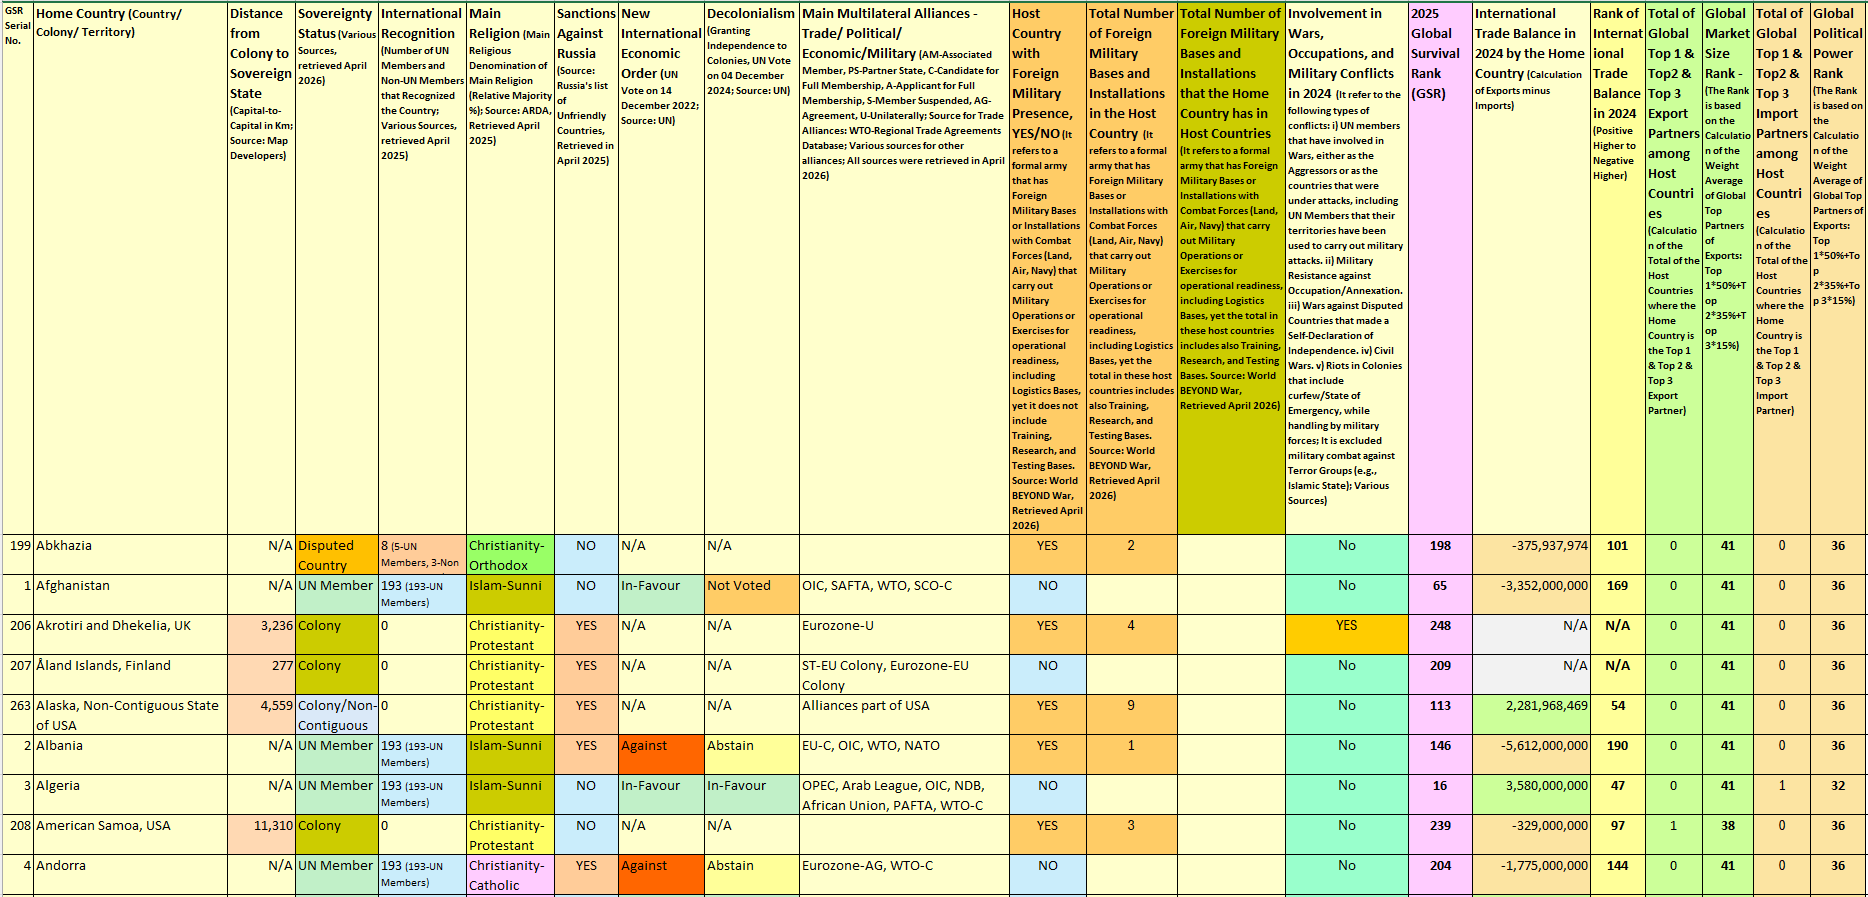
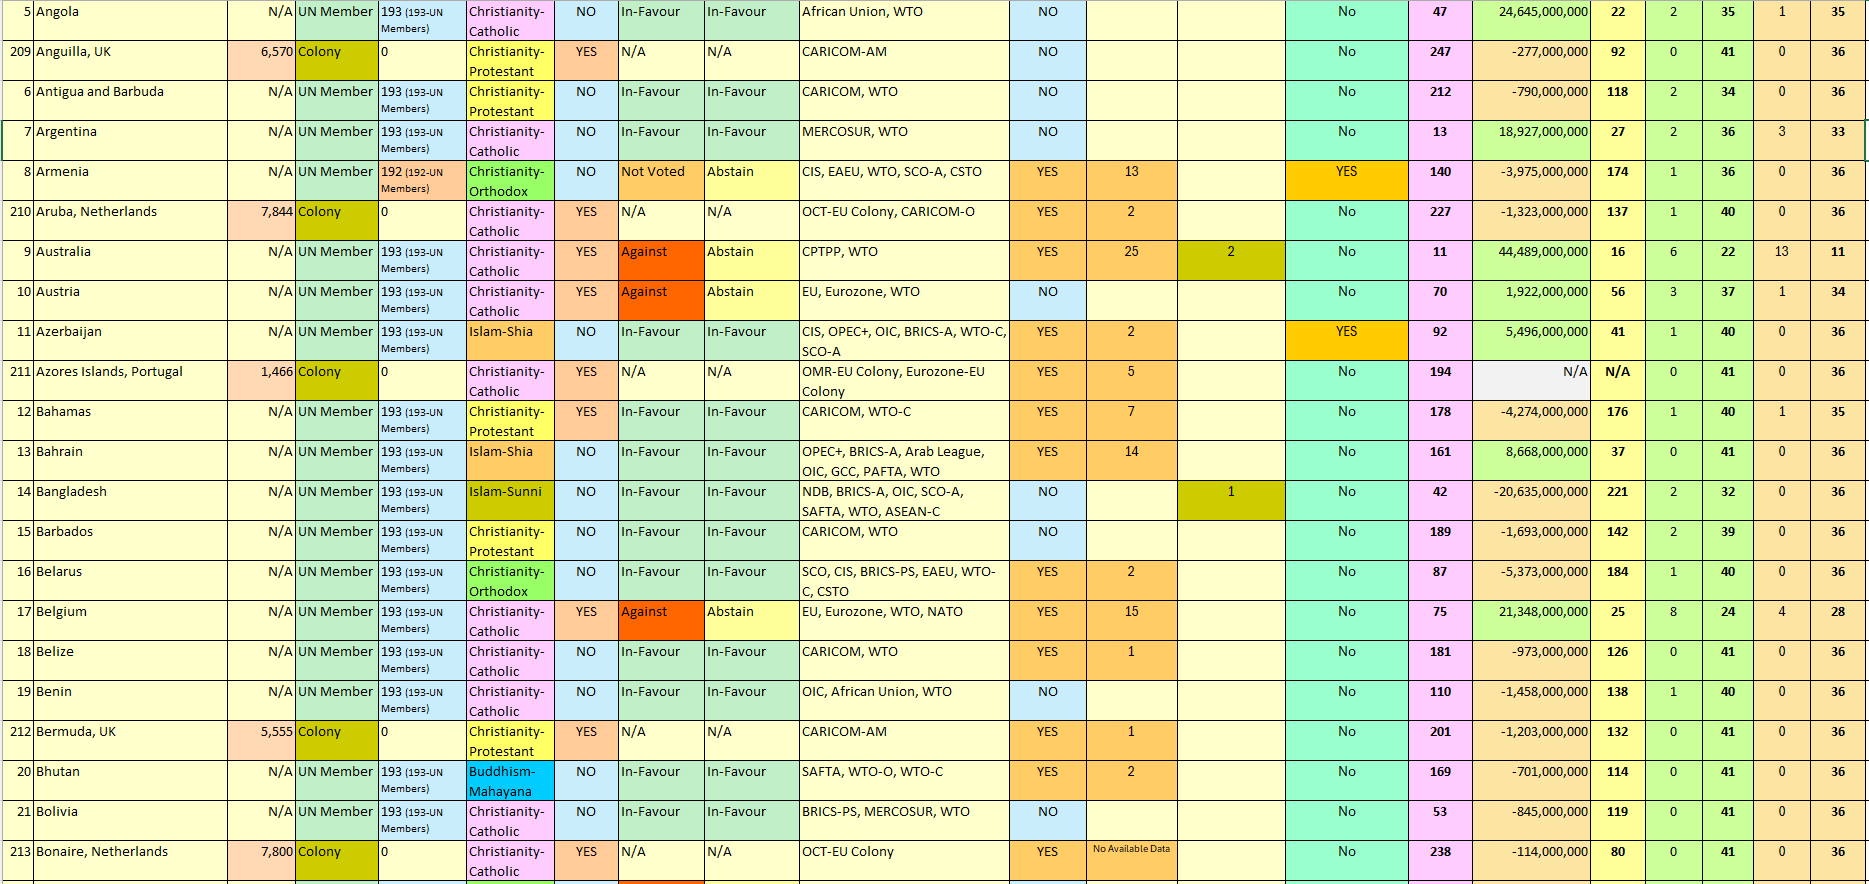
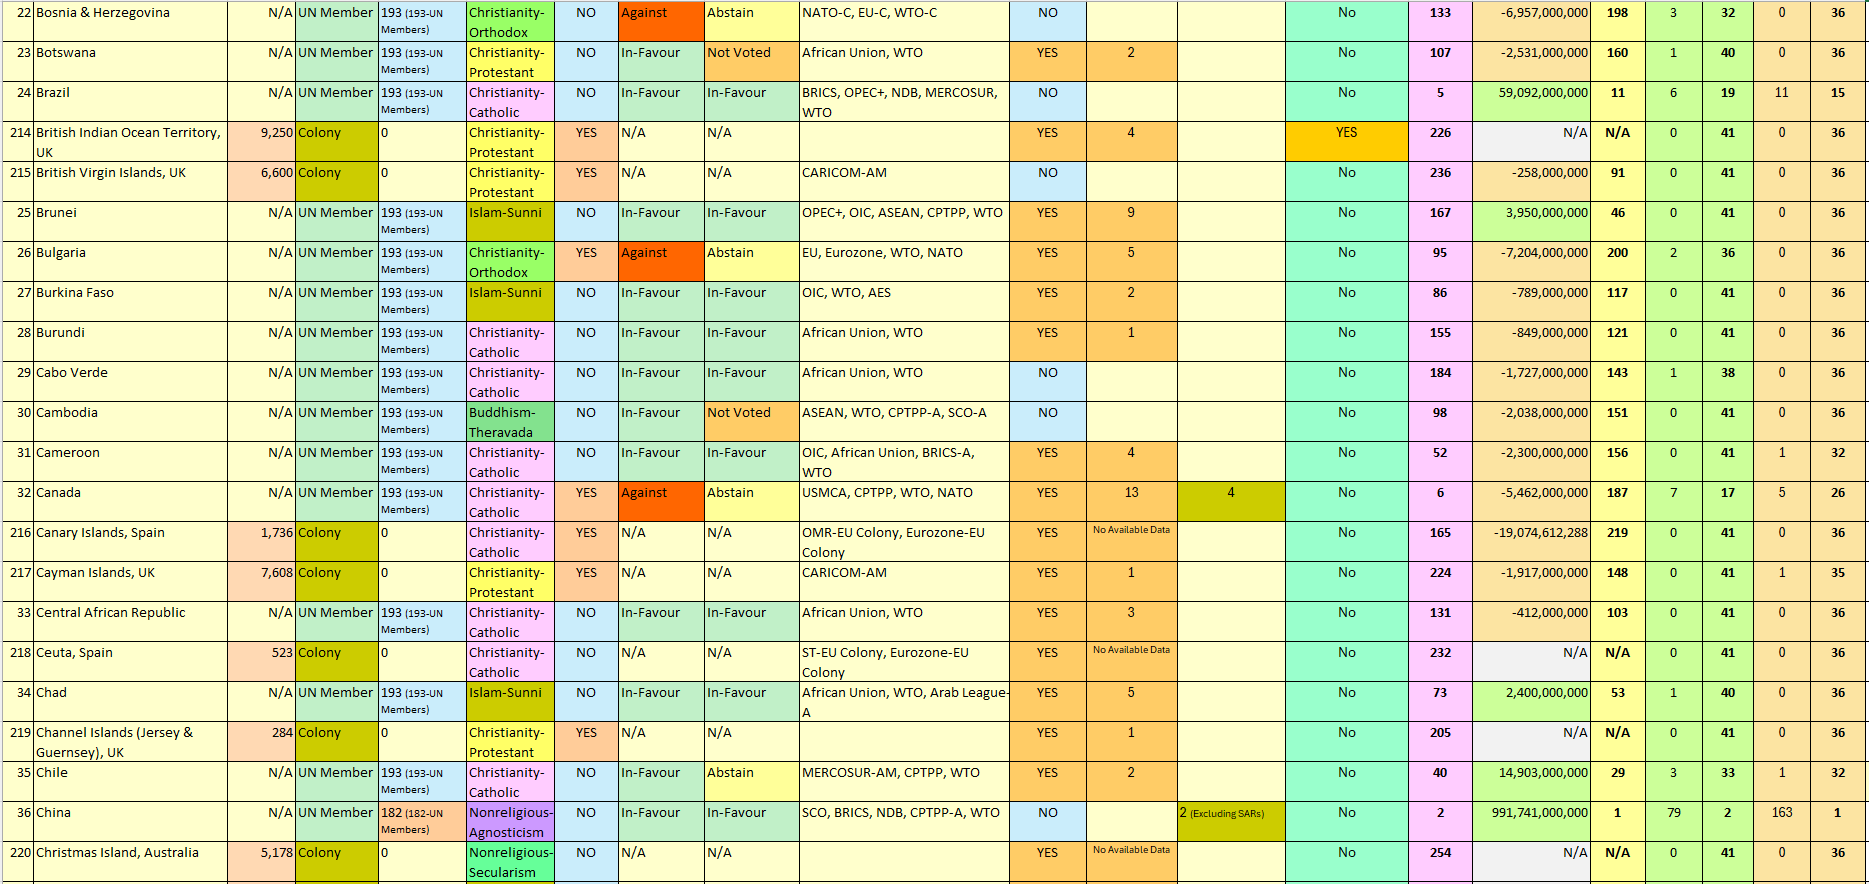
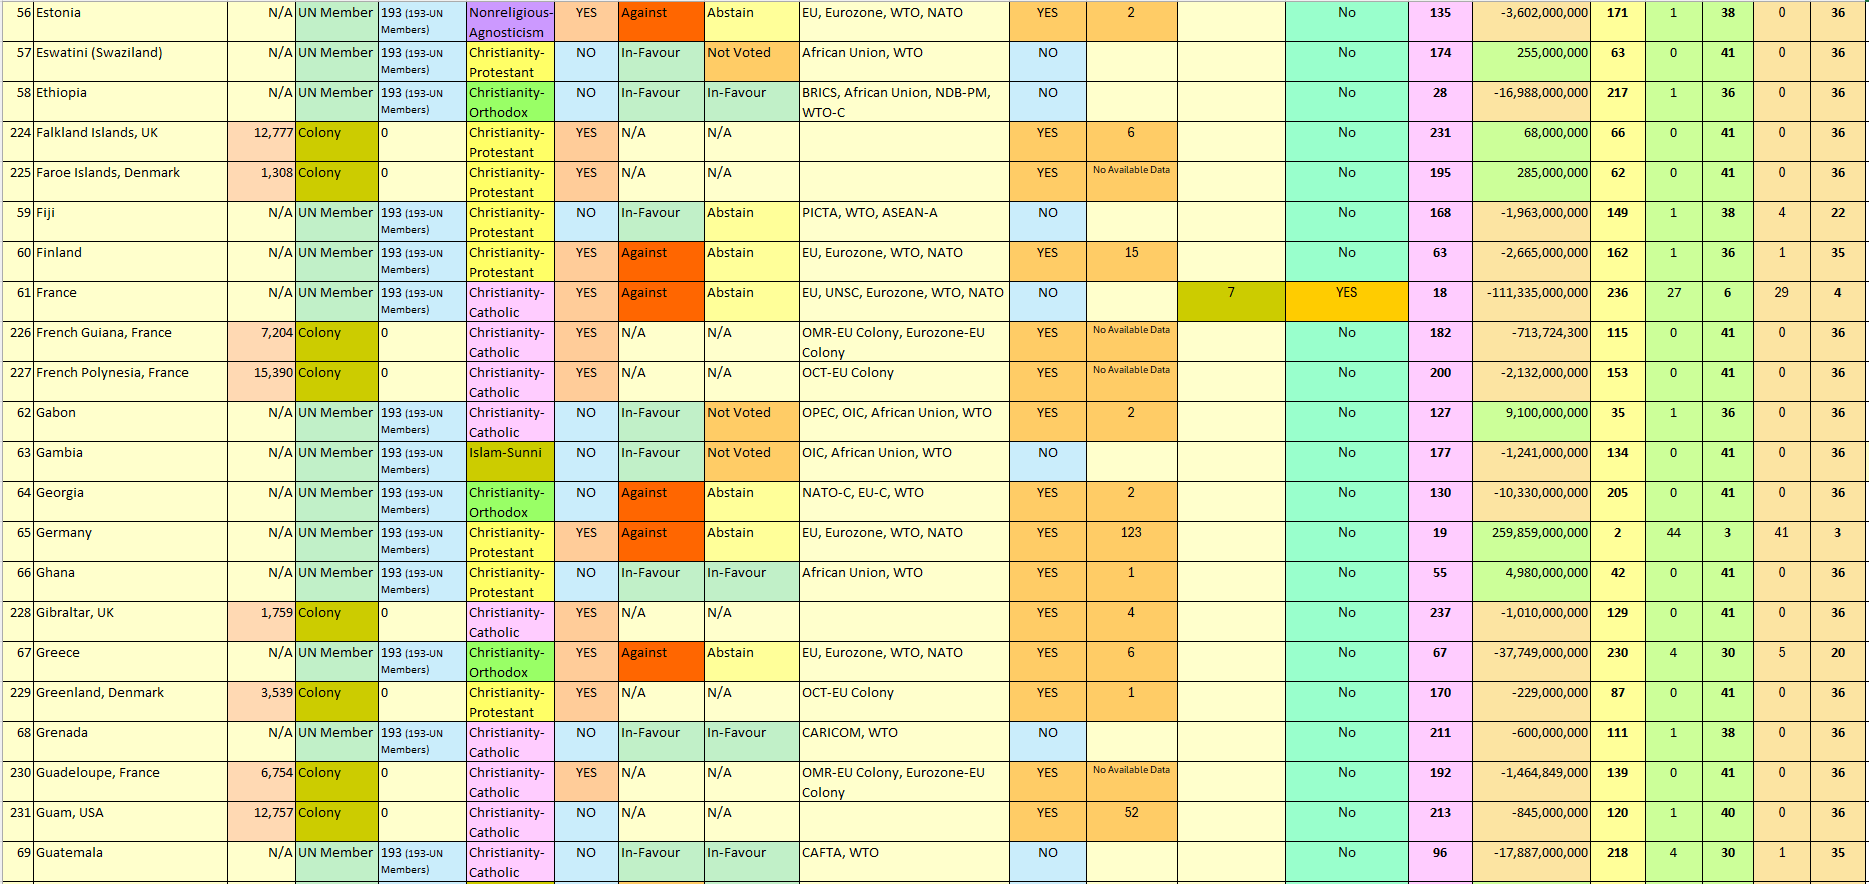
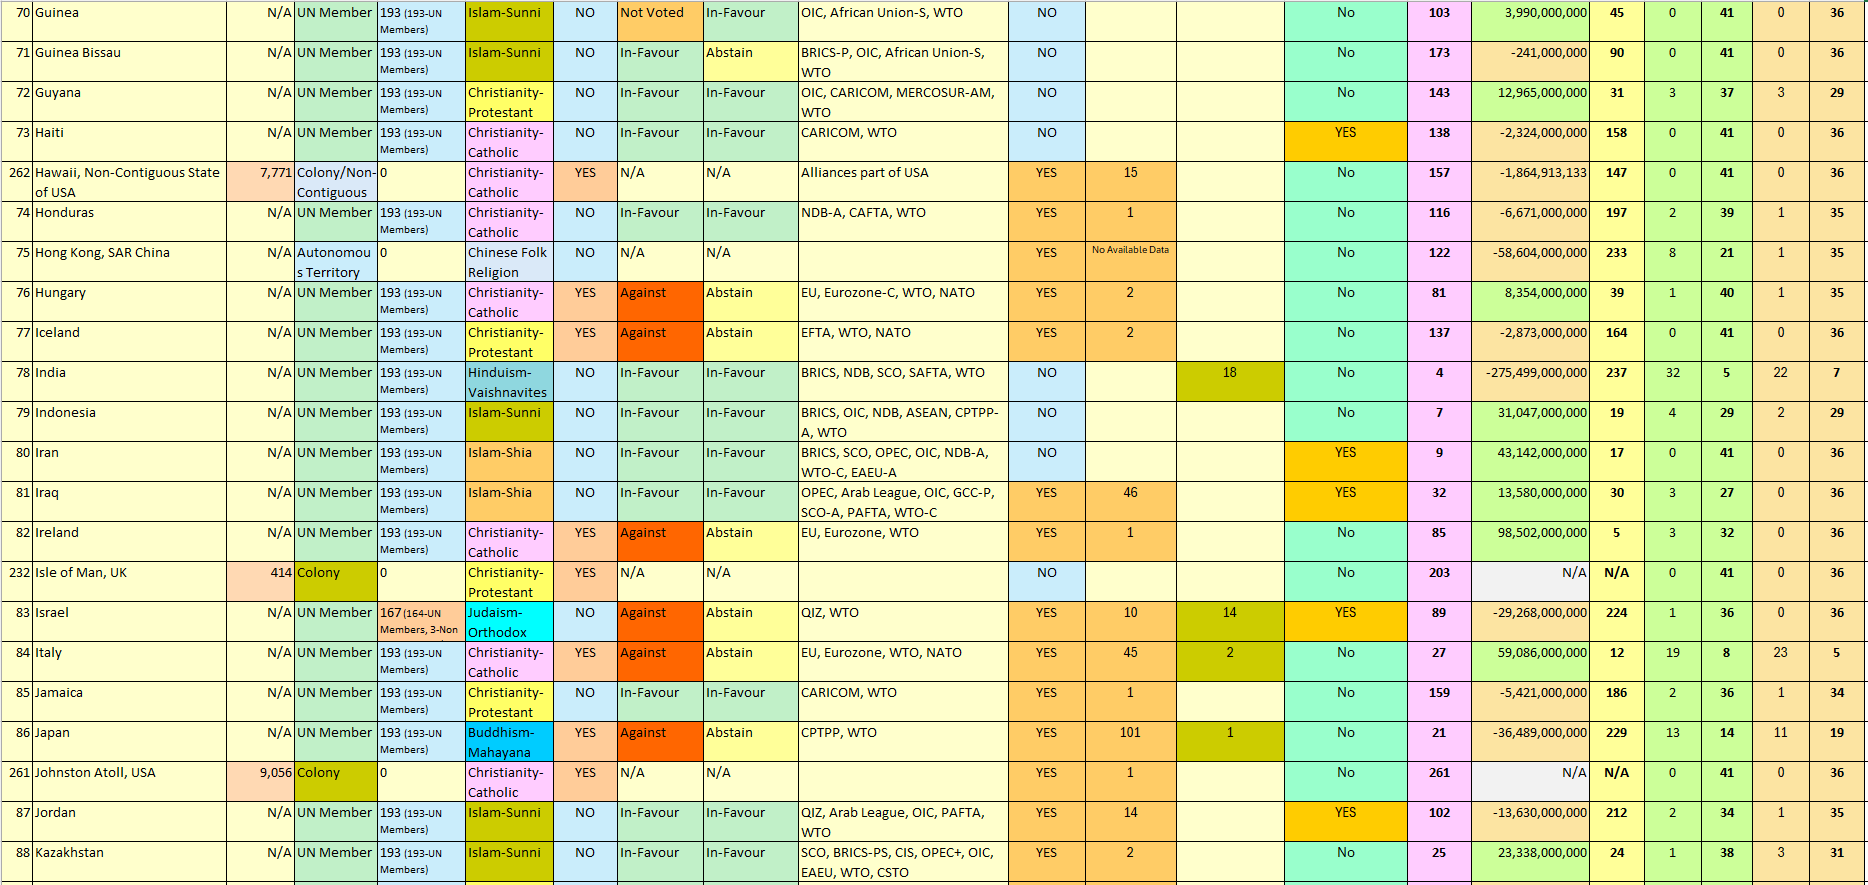
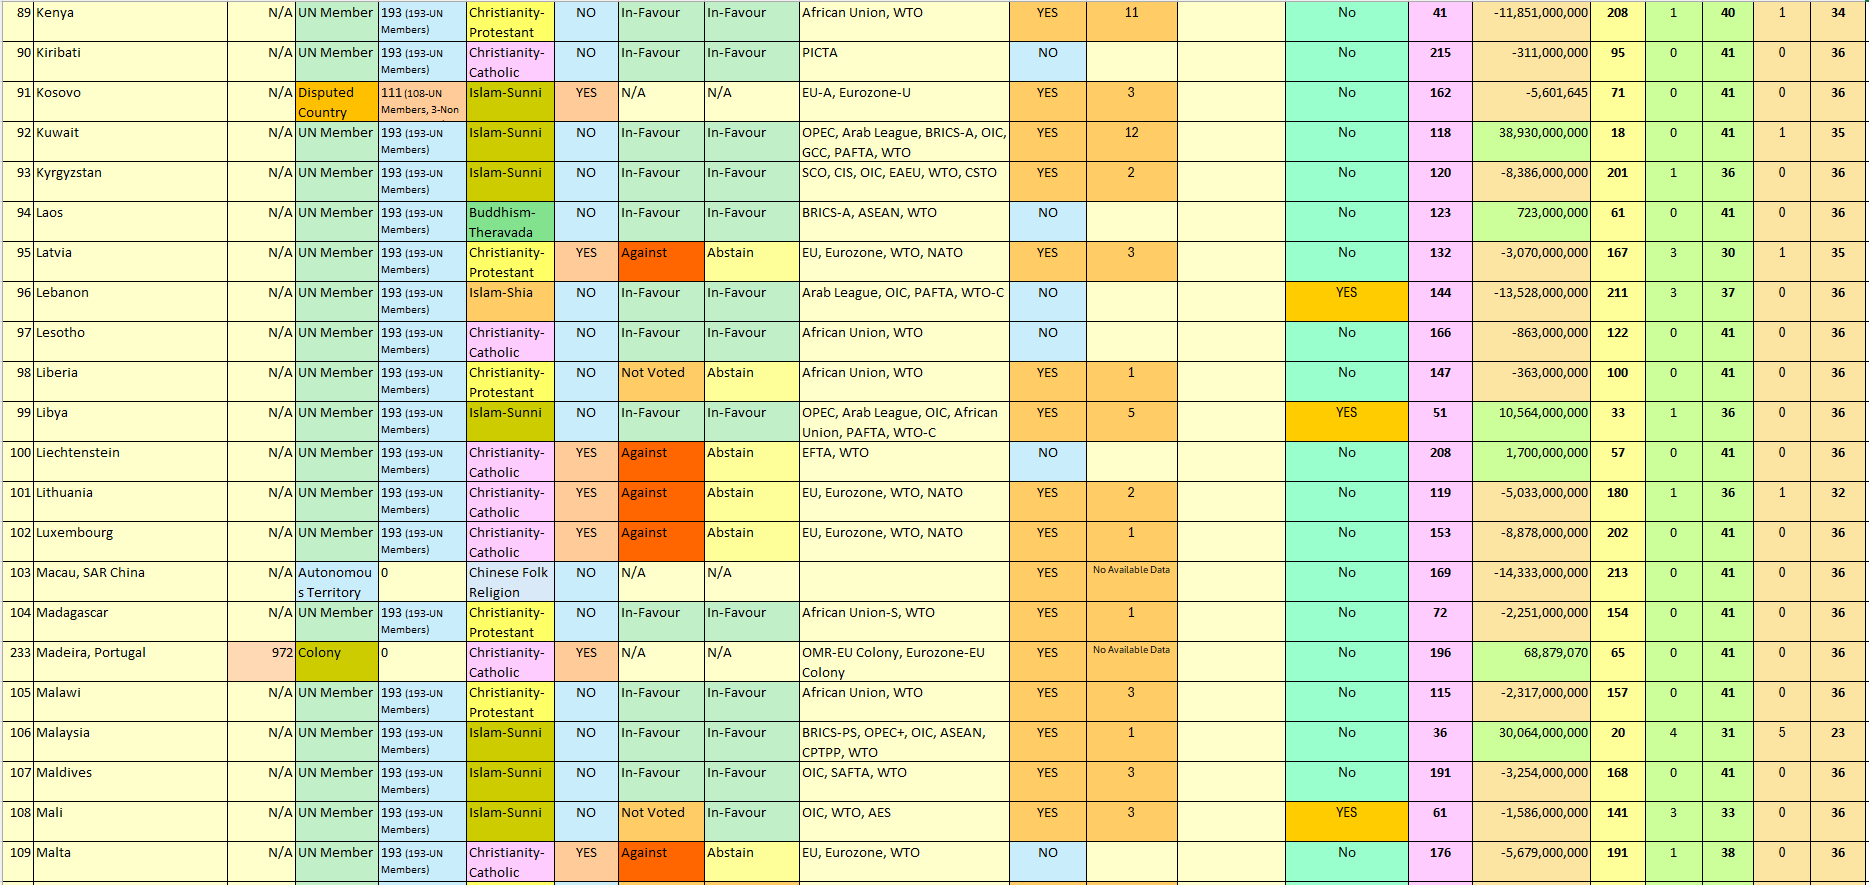
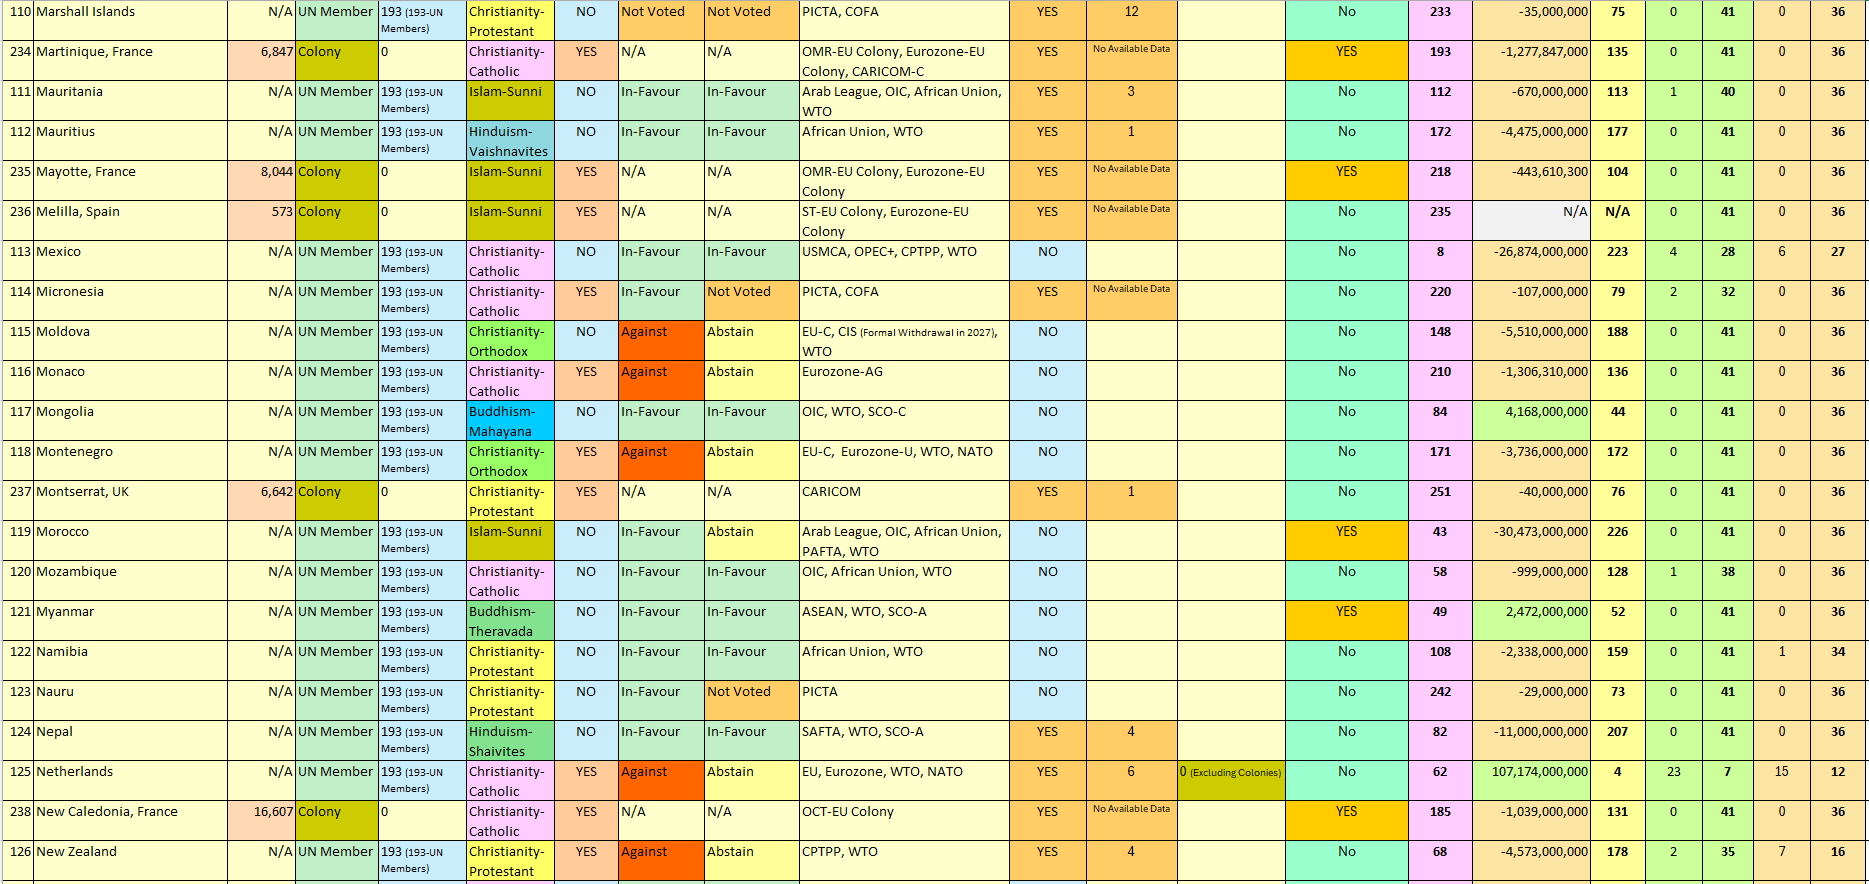
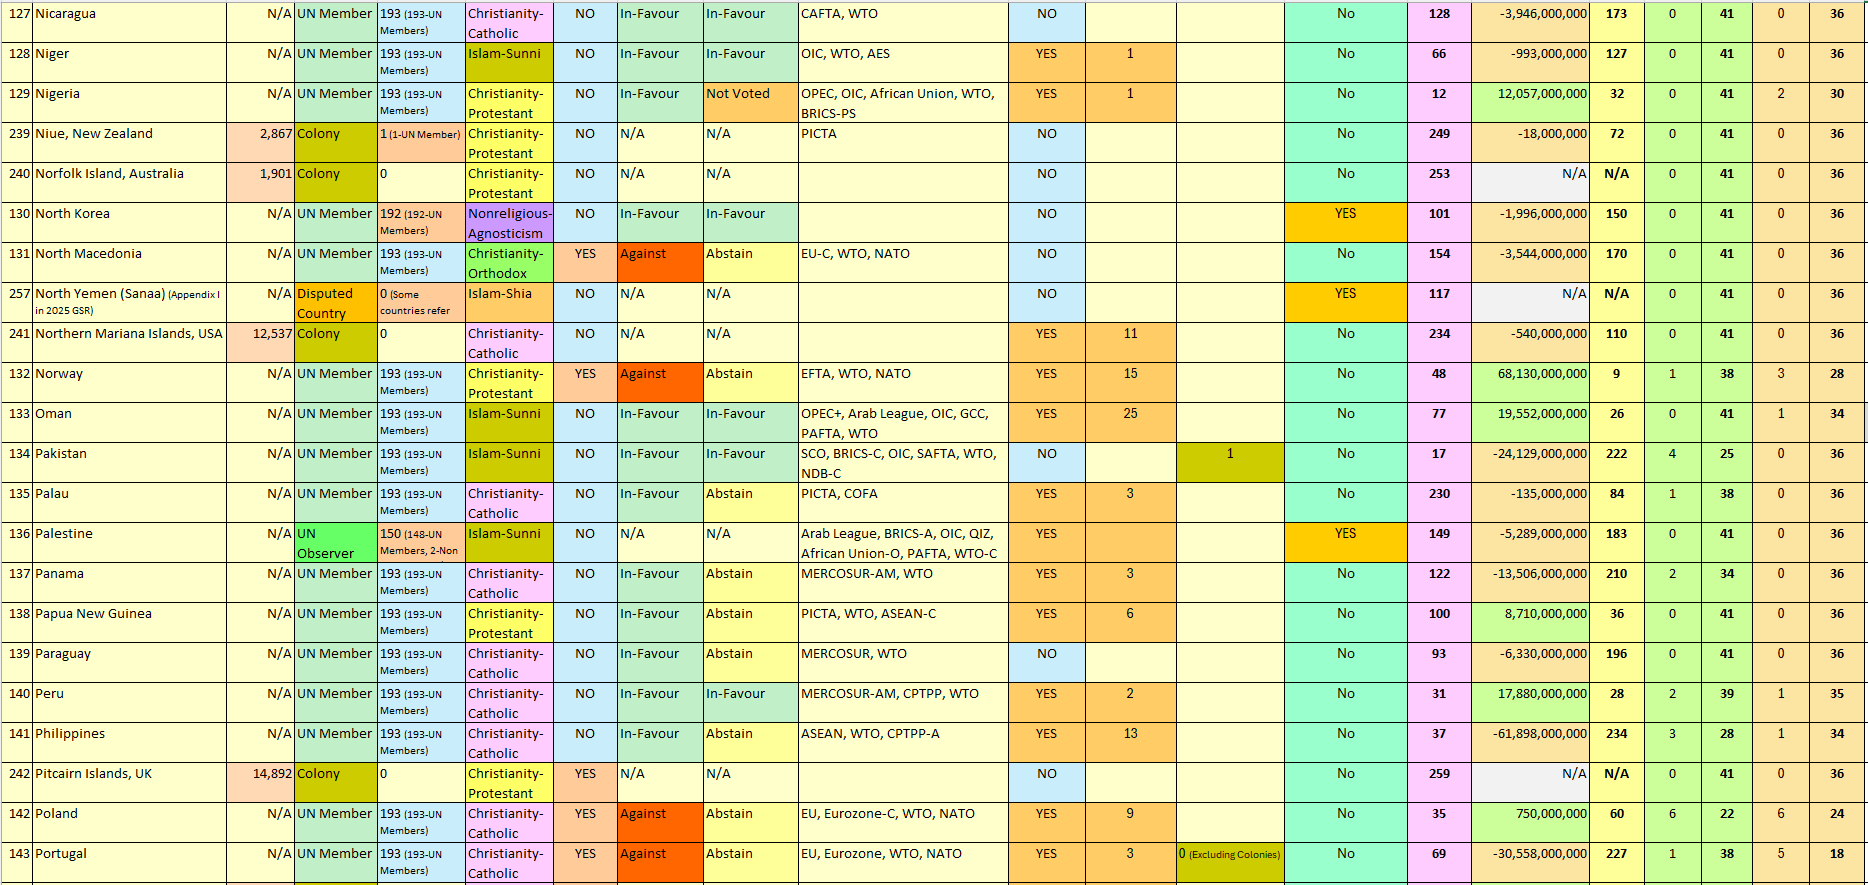
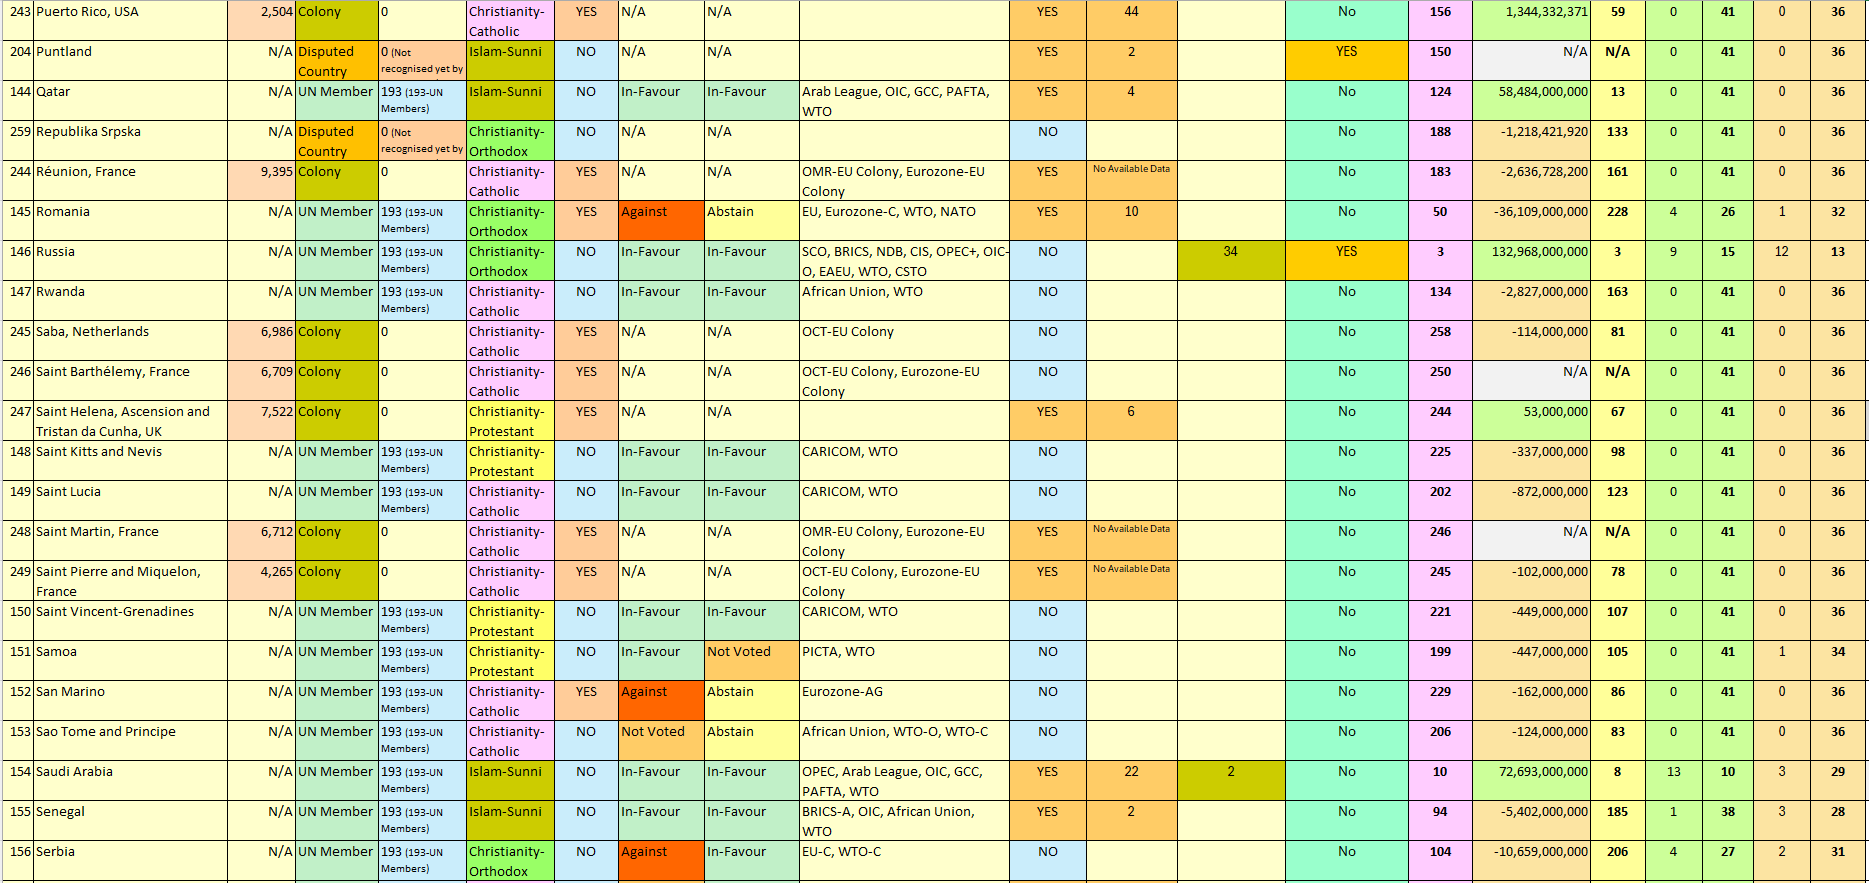
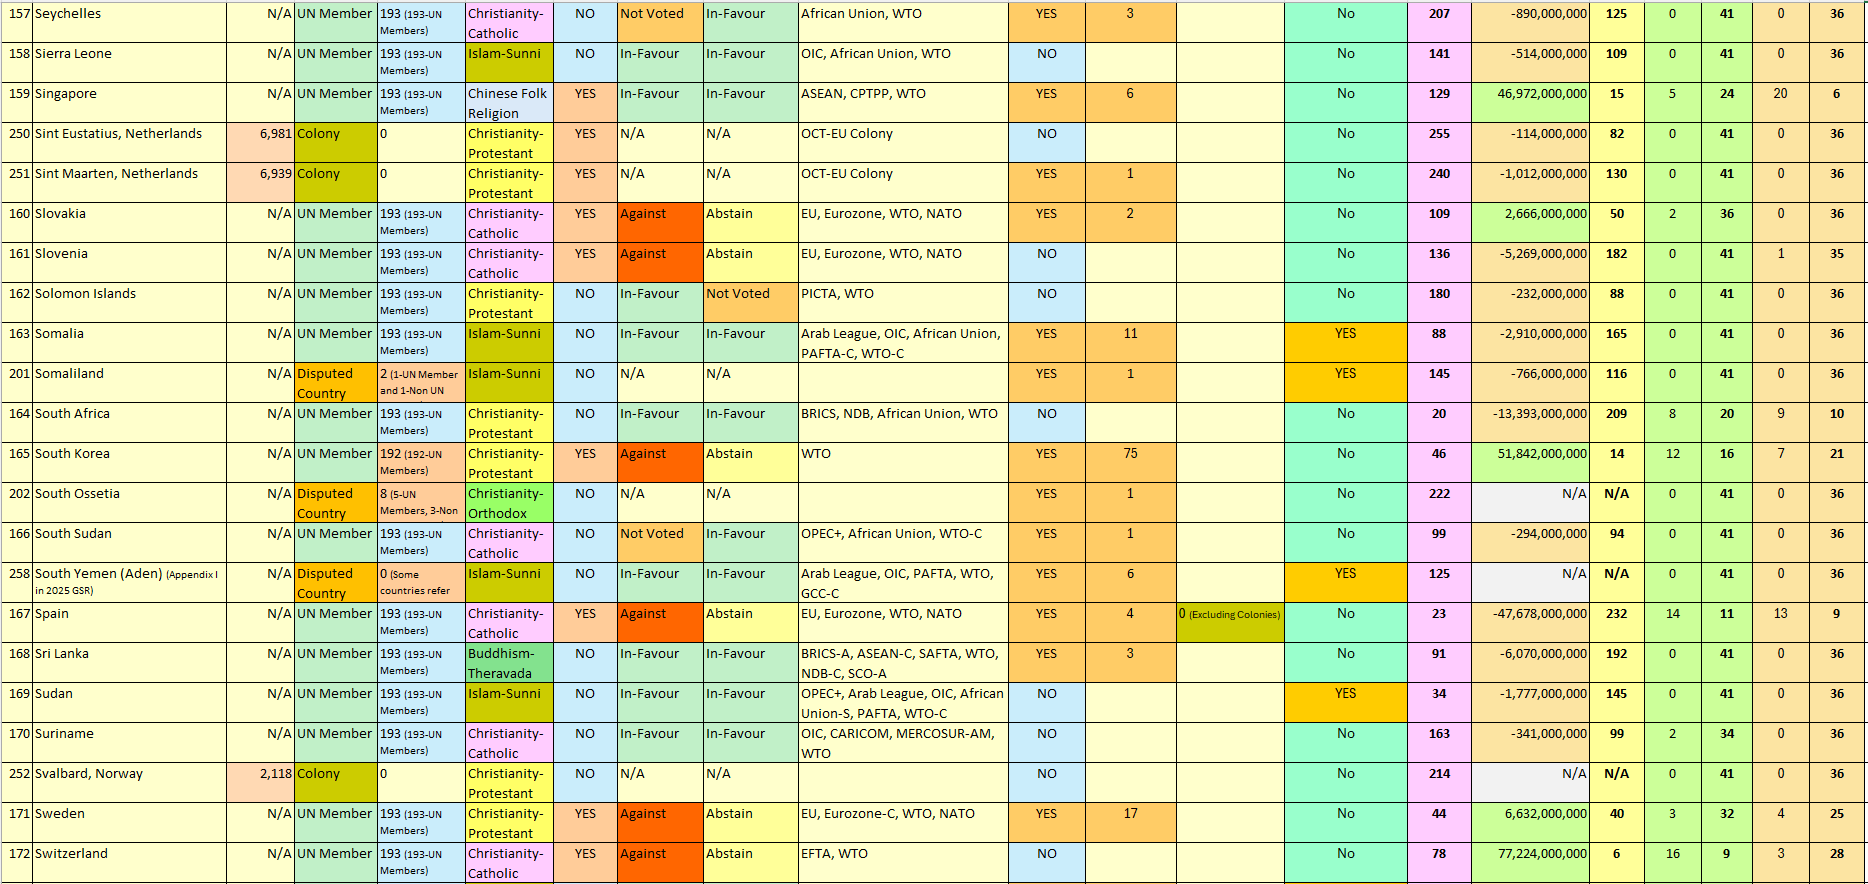
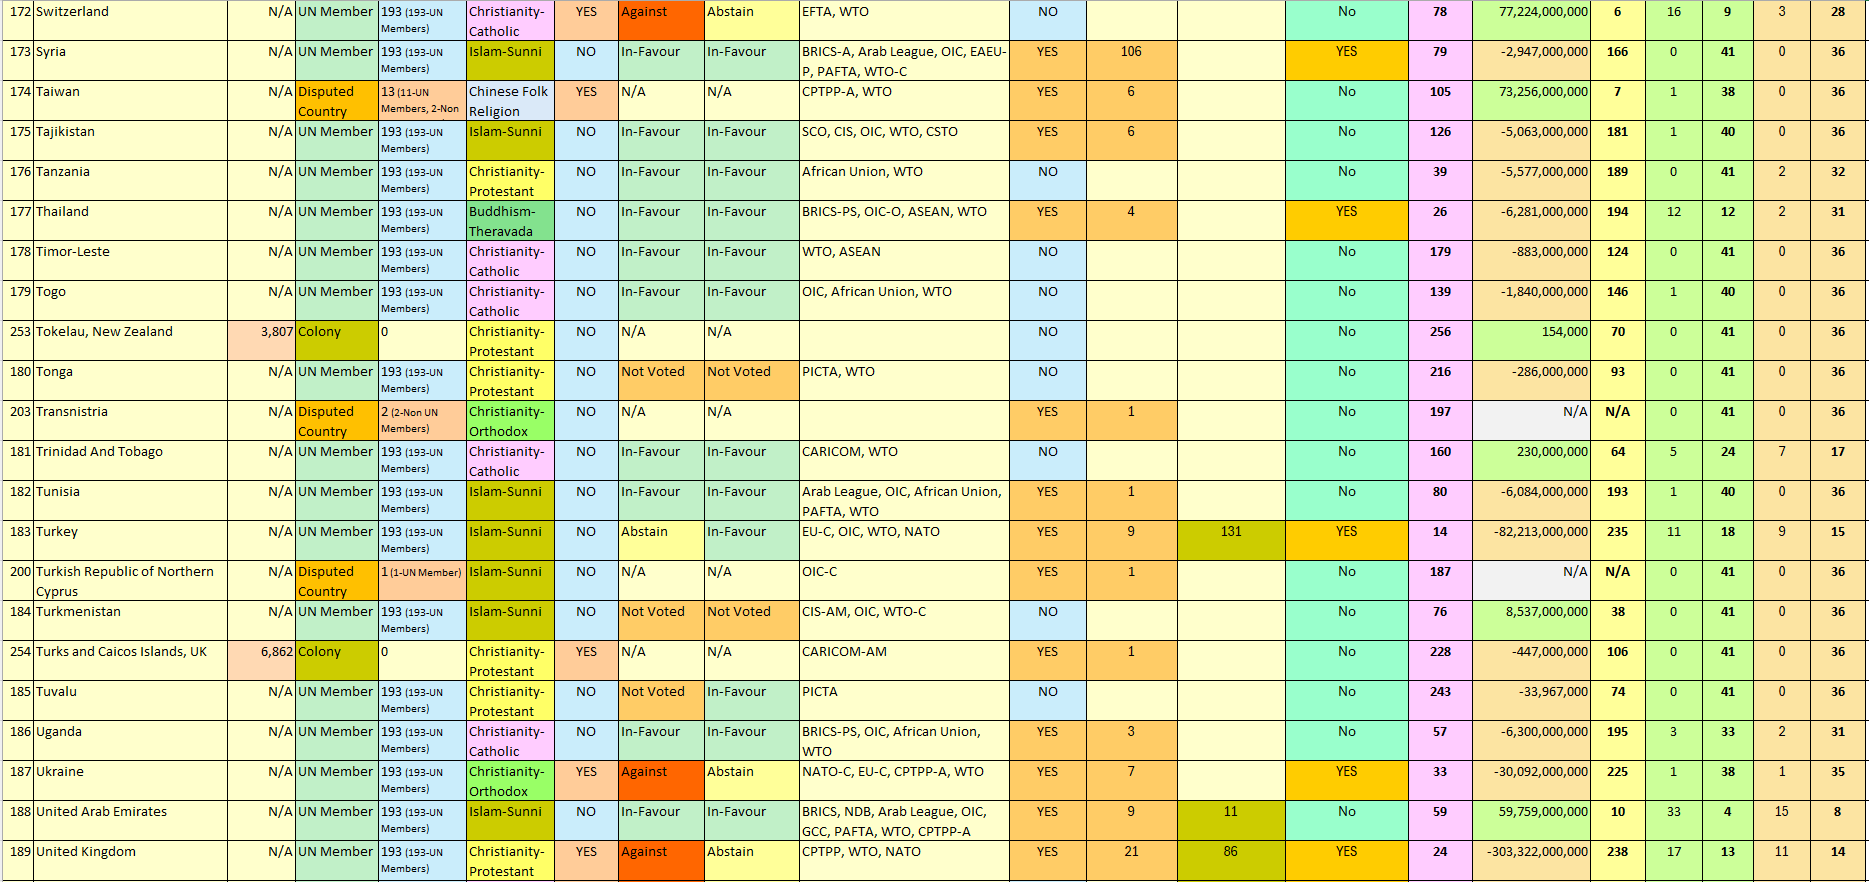
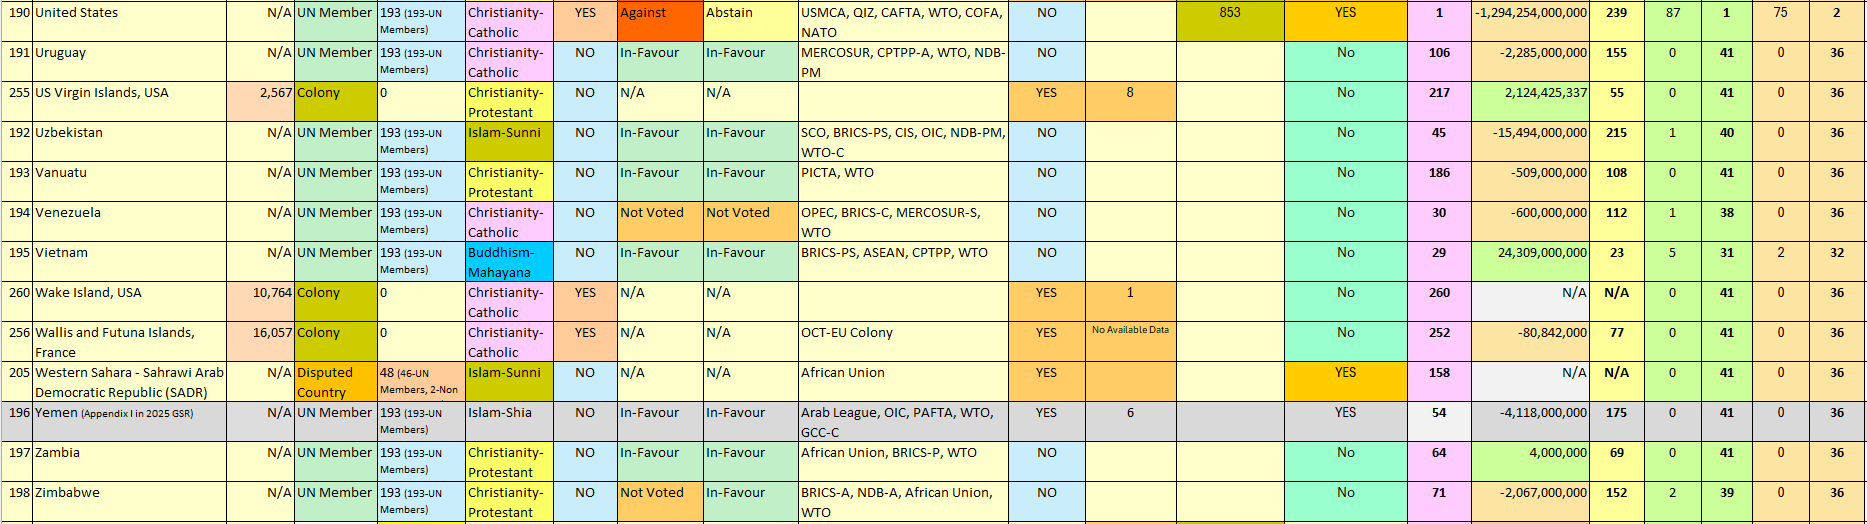
Section 3.5.1 The Impact of Region on International Trade: All UN Members and Non-UN Members
Table 15. Average of International Trade in 2024 by Region, sorted by the Average of International Trade Balance in 2024
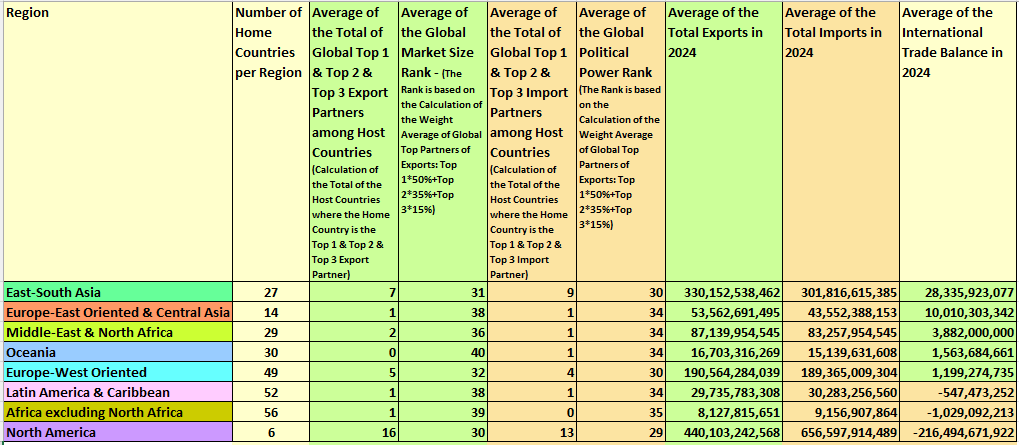
Notes: For the Region of Each Home Country, Please see Table 14. The Number of Home Countries per Region includes Home Countries with some missing data on International Trade.
Chart 5. The Impact of the Region on Exports, Average of the Total Exports in 2024
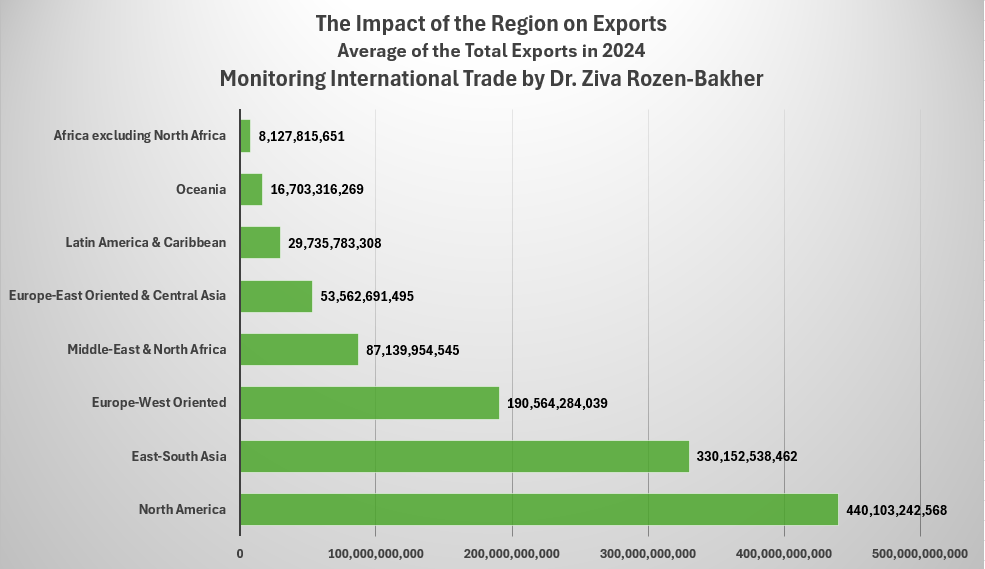
Section 3.5.2 The Impact of Religion on International Trade: All UN Members and Non-UN Members
Table 16. Average of International Trade in 2024 by Main Religion, sorted by the Average of International Trade Balance in 2024
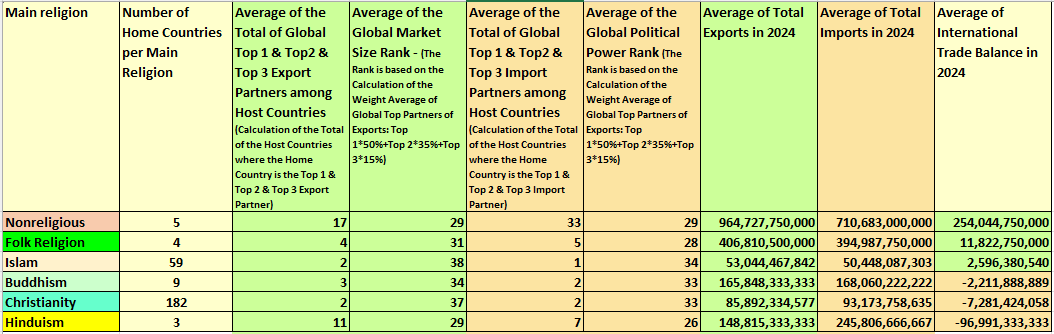
Notes: For the Religion of Each Home Country, Please see Table 14. The Number of Home Countries per Main Religion includes Home Countries with some missing data on International Trade.
Table 17. Average of International Trade in 2024 by Main Religious Denomination, sorted by the Average of International Trade Balance in 2024
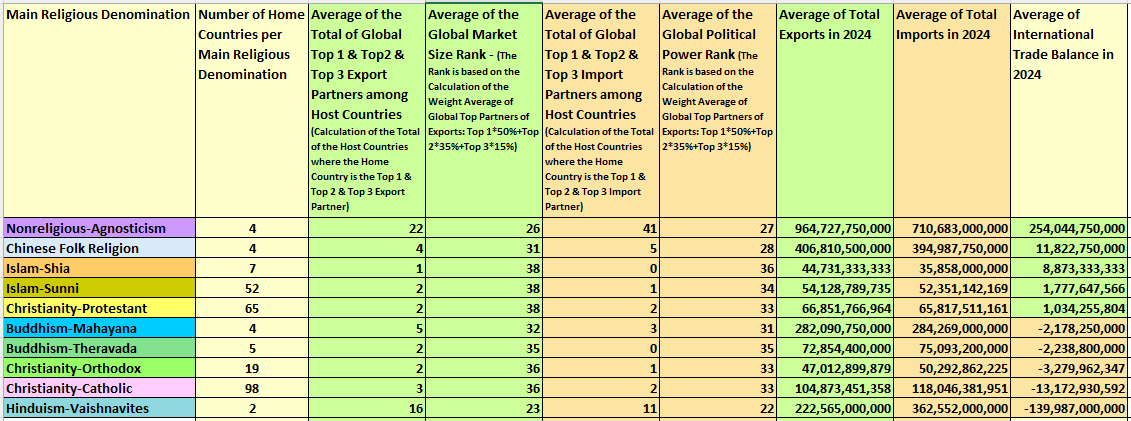
Notes: For the Religion of Each Home Country, Please see Table 14. The Number of Home Countries per Main Religious Denomination includes Home Countries with some missing data on International Trade.
Section 3.5.3 The Impact of Sovereignty Status on International Trade: All UN Members and Non-UN Members
Chart 6. The Impact of the Sovereignty Status on International Trade
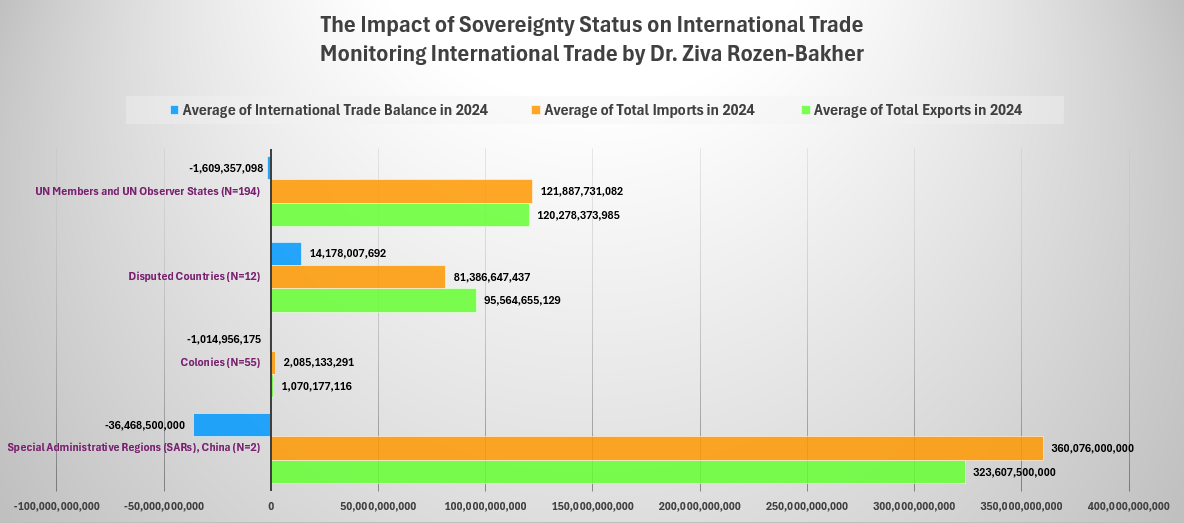
Notes: For the Sovereignty Status of Each Home Country, Please see Table 14. The Number of Home Countries per Sovereignty Status includes Home Countries with some missing data on International Trade.
Section 3.5.4 The Impact of Limited International Recognition on International Trade: All UN Members and Non-UN Members
Table 18. Average of International Trade in 2024 by the Categories of Limited International Recognition, sorted by the Average of International Trade Balance in 2024
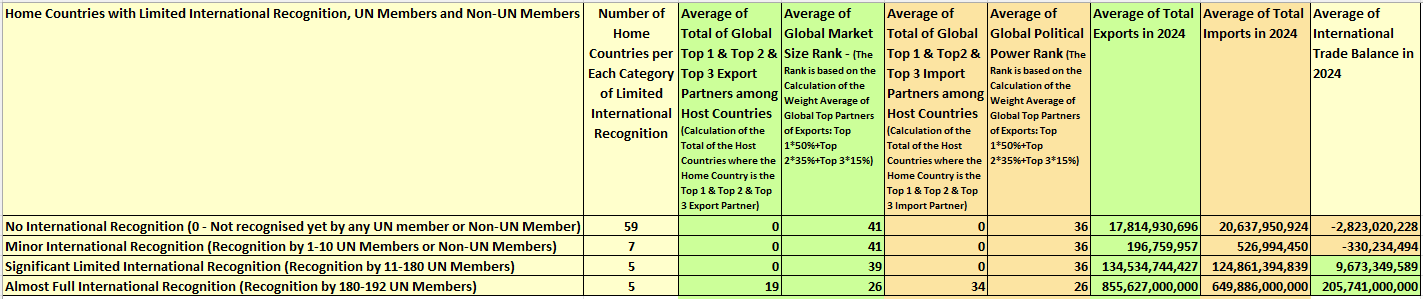
Notes: For the International Recognition of Each Home Country, Please see Table 14. The Number of Home Countries per each category includes Home Countries with some missing data on International Trade.
Section 3.5.5 The Impact of the Attitude towards the New International Economic Order on International Trade: Countries with UN Vote Right
Map 6. Results of UN Vote on New International Economic Order by UN Members
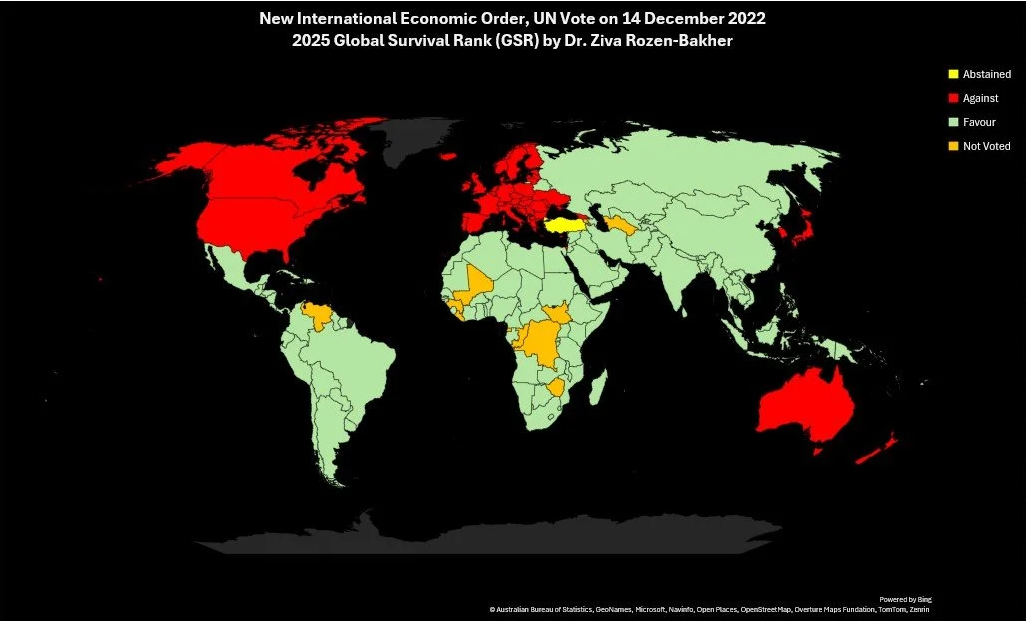
Source: Section E3.2 UN Vote on New International Economic Order, Section E3. Determination of Geopolitical Position: Sanctions, Economic Order, Decolonialism, and Trade-war, 2025 Global Survival Rank (GSR) by Dr. Ziva Rozen-Bakher https://www.rozen-bakher.com/gsr/2025/e/determination-geopolitical-position
Chart 7. Average of International Trade Balance in 2024 by the Vote (Favour/Against) of UN Resolution on New International Economic Order
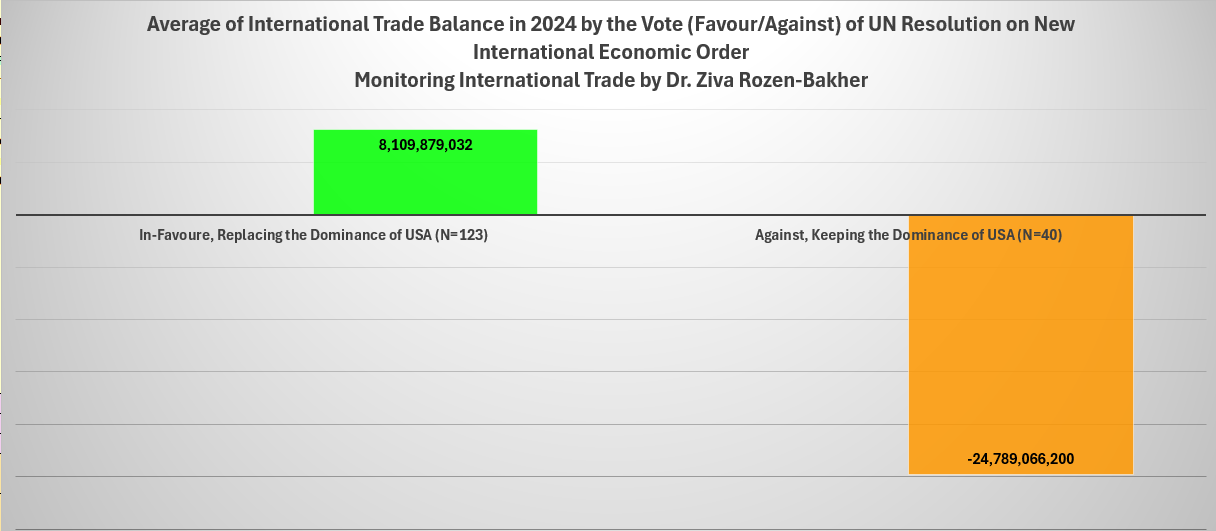
Note: For the Vote by Each Country, Please see Table 14.
Section 3.5.6 The Impact of Decolonialism on International Trade: All UN Members and Non-UN Members
Map 7. Results of UN Vote on Decolonialism by UN Members
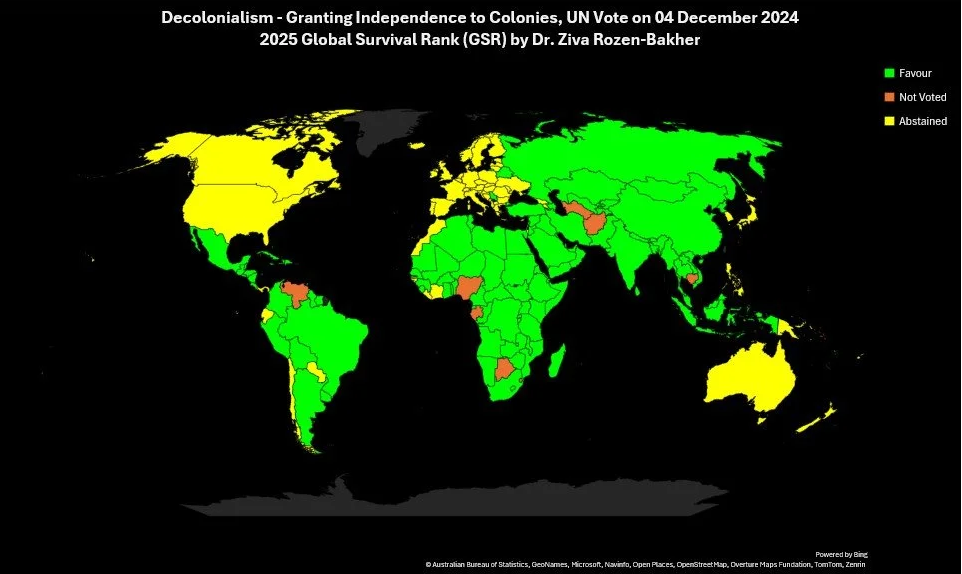
Source: Section E3.3 UN Vote on Decolonialism – Granting Independence to Colonies, Section E3. Determination of Geopolitical Position: Sanctions, Economic Order, Decolonialism, and Trade-war, 2025 Global Survival Rank (GSR) by Dr. Ziva Rozen-Bakher https://www.rozen-bakher.com/gsr/2025/e/determination-geopolitical-position
Chart 8. Average of International Trade Balance in 2024 by the Vote of UN Resolution on Decolonialism
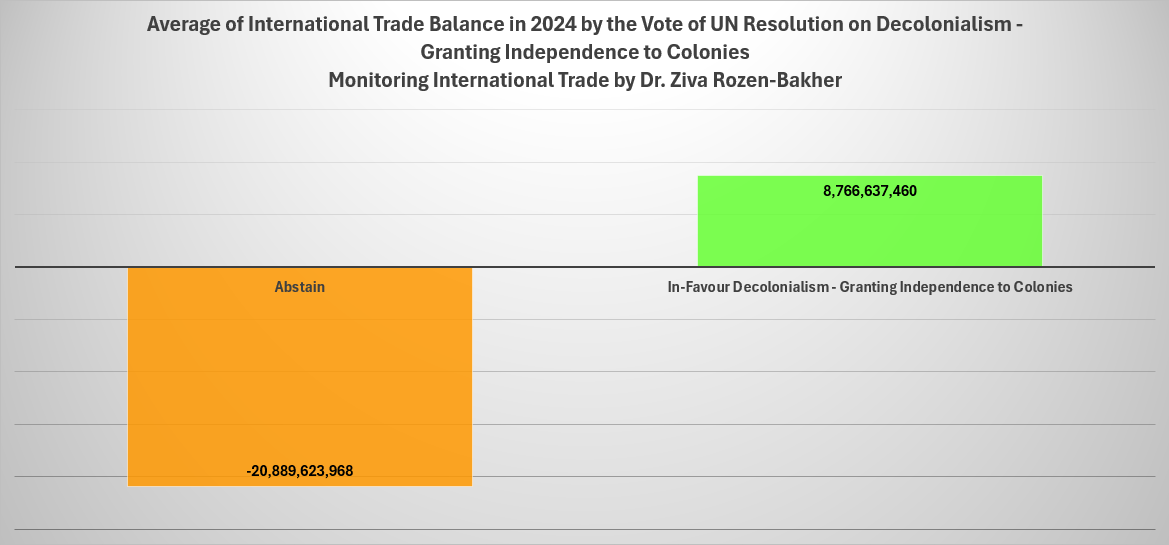
Note: For the Vote by Each Country, Please see Table 14.
Chart 9. Average of International Trade Balance in 2024 by Colonialism versus Decolonialism
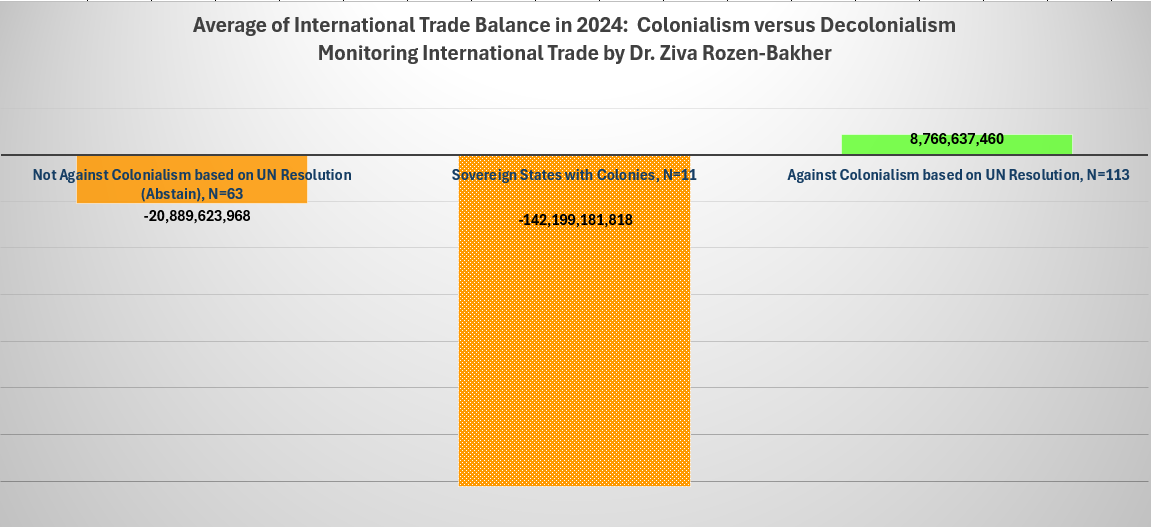
Section 3.5.7 The Impact of Multilateral Trade Alliances (Free Trade Agreements (FTAs)) and Multilateral Military Alliances on International Trade: All UN Members and Non-UN Members
Table 19. The Impact of Multilateral Trade/Military Alliances on International Trade, sorted by the Total of International Trade Balance in 2024
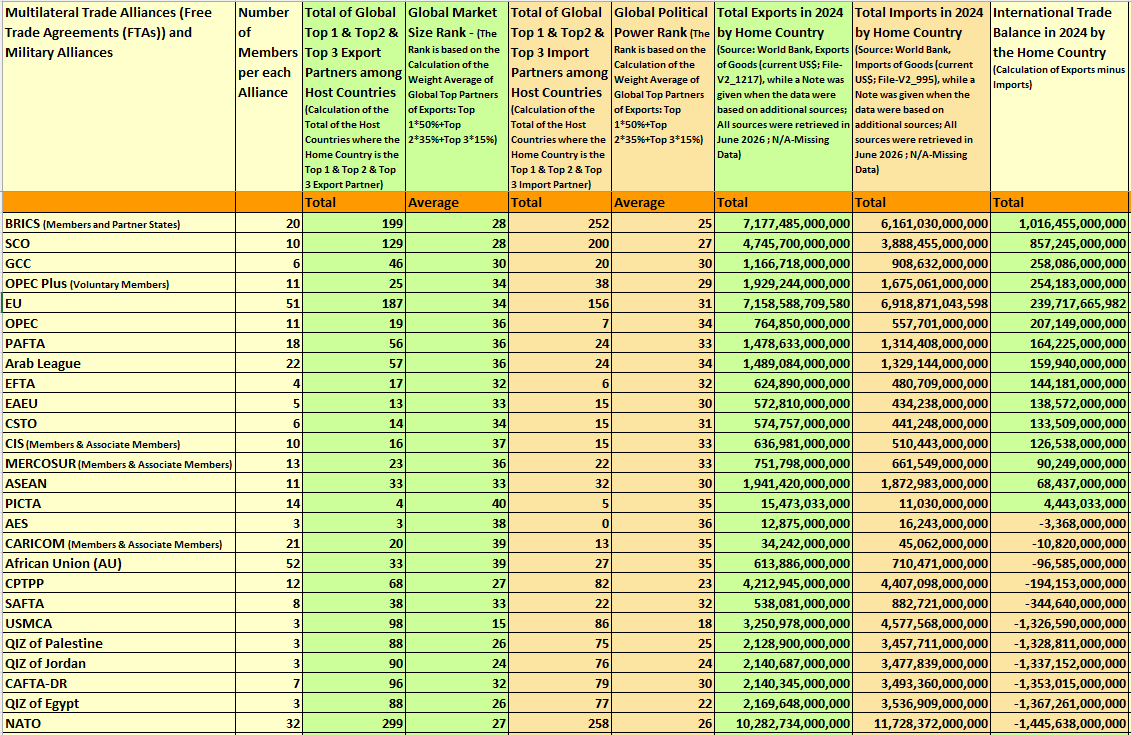
Note, For the Membership in Multilateral Trade/Military Alliances of Each Home Country, Please see Table 14, but keep in mind that Table 14 presents not only Multilateral Trade/Military Alliances, but also other types of Alliances, such as the Organisation of Islamic Cooperation (OIC) that acts only as a Political Alliance without aspects of FTA or Defence Pact.
Section 3.5.8 The Impact of Foreign Military Presence on International Trade: All UN Members and Non-UN Members
Chart 10. Average of International Trade Balance in 2024 by Foreign Military Presence
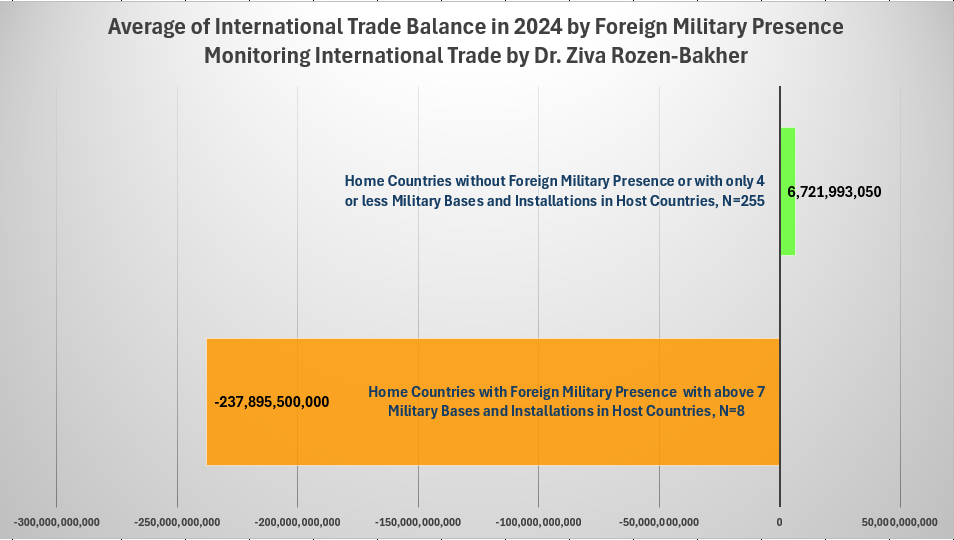
Note: For the Foreign Military Presence of Each Country, Please see Table 14
Chart 11. International Trade Balance in 2024: Home Countries with Foreign Military Presence with above 7 Military Bases and Installations in Host Countries
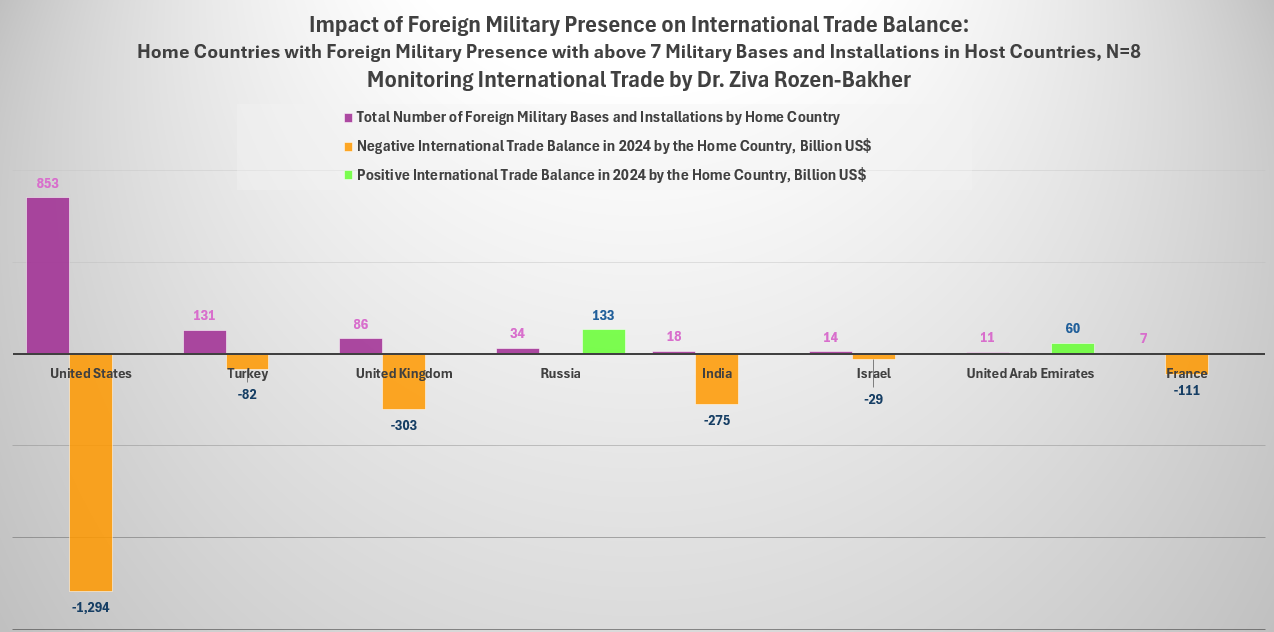
Section 3.5.9 The Impact of Sanctions on International Trade: All UN Members and Non-UN Members
Table 20. The Impact of the Sanctions against Russia on International Trade: Comparison between Home Countries that Imposed Sanctions on Russia versus Home Countries that did not impose sanctions on Russia, Sorted by International Trade Balance

Section 3.5.10. The Impact of Involvement in Wars, Occupations, and Military Conflicts on International Trade: All UN Members and Non-UN Members
Table 21. The Impact of Involvement in Wars, Occupations, and Military Conflicts in 2024 on the International Trade, sorted by International Trade Balance in 2024
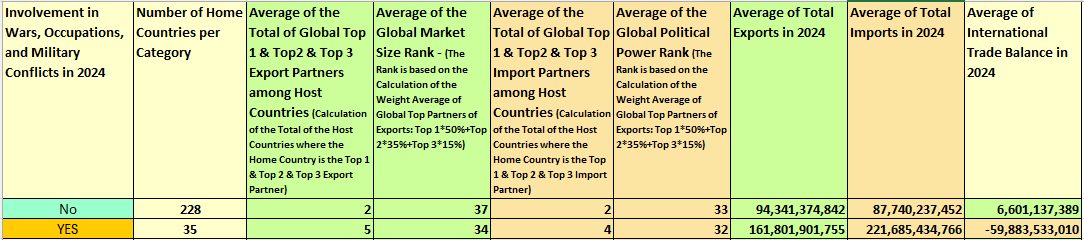
Section 3.6. Global Survival Rank (GSR) as a Moderator for Two Geopolitical Factors: Sanctions and Involvement in Wars
Section 3.6.1 The Impact of Sanctions on International Trade: Global Survival Rank (GSR) as a Moderator
Table 22. Countries Under Sanctions - Russia, Iran, Afghanistan, Cuba, and North Korea - Comparison of 2025 Global Survival Rank (GSR) versus the Rank of International Trade Balance, Sorted by 2025 Global Survival Rank (GSR)
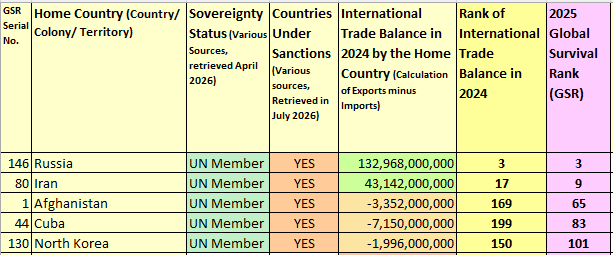
Table 23. Countries Under Sanctions - Russia, Iran, Afghanistan, Cuba, and North Korea - Comparison of the Indicators (R1-R7) of 2025 Global Survival Rank (GSR), Sorted by 2025 Global Survival Rank (GSR)

Section 3.6.2 The Impact of Involvement in Wars, Occupations, and Military Conflicts on International Trade: Global Survival Rank (GSR) as a Moderator
Table 24. Involvement in Wars in 2024 - All UN Members and Non-UN Members: Positive International Trade Balance vs Negative International Trade Balance in 2024, sorted by 2025 Global Survival Rank (GSR)
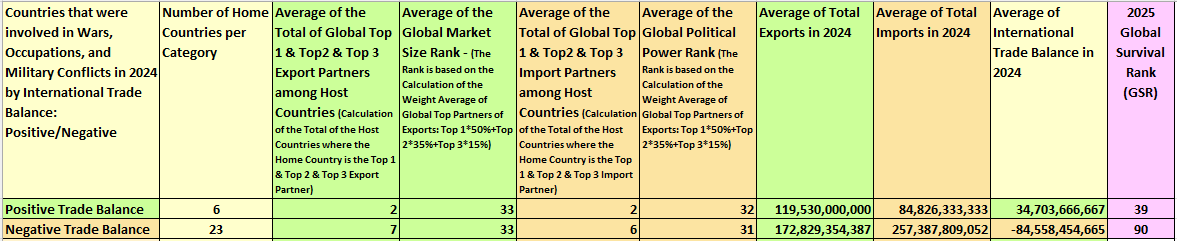
Table 25. Involvement in Wars in 2024 - Russia, Iran, Ukraine, and Israel - Comparison of 2025 Global Survival Rank (GSR) versus the Rank of International Trade Balance, Sorted by 2025 Global Survival Rank (GSR)
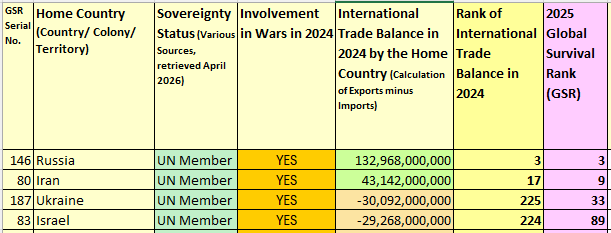
Table 26. Involvement in Wars in 2024 - Russia, Iran, Ukraine, and Israel - Comparison of the Indicators (R1-R7) of 2025 Global Survival Rank (GSR), Sorted by 2025 Global Survival Rank (GSR)

Section 3.7. The Impact of Market Size versus Comparative Competitive Advantages on International Trade
Table 27. Market Size versus Comparative Competitive Advantages: All UN Members and Non-UN Members, sorted by Alphabetical Order
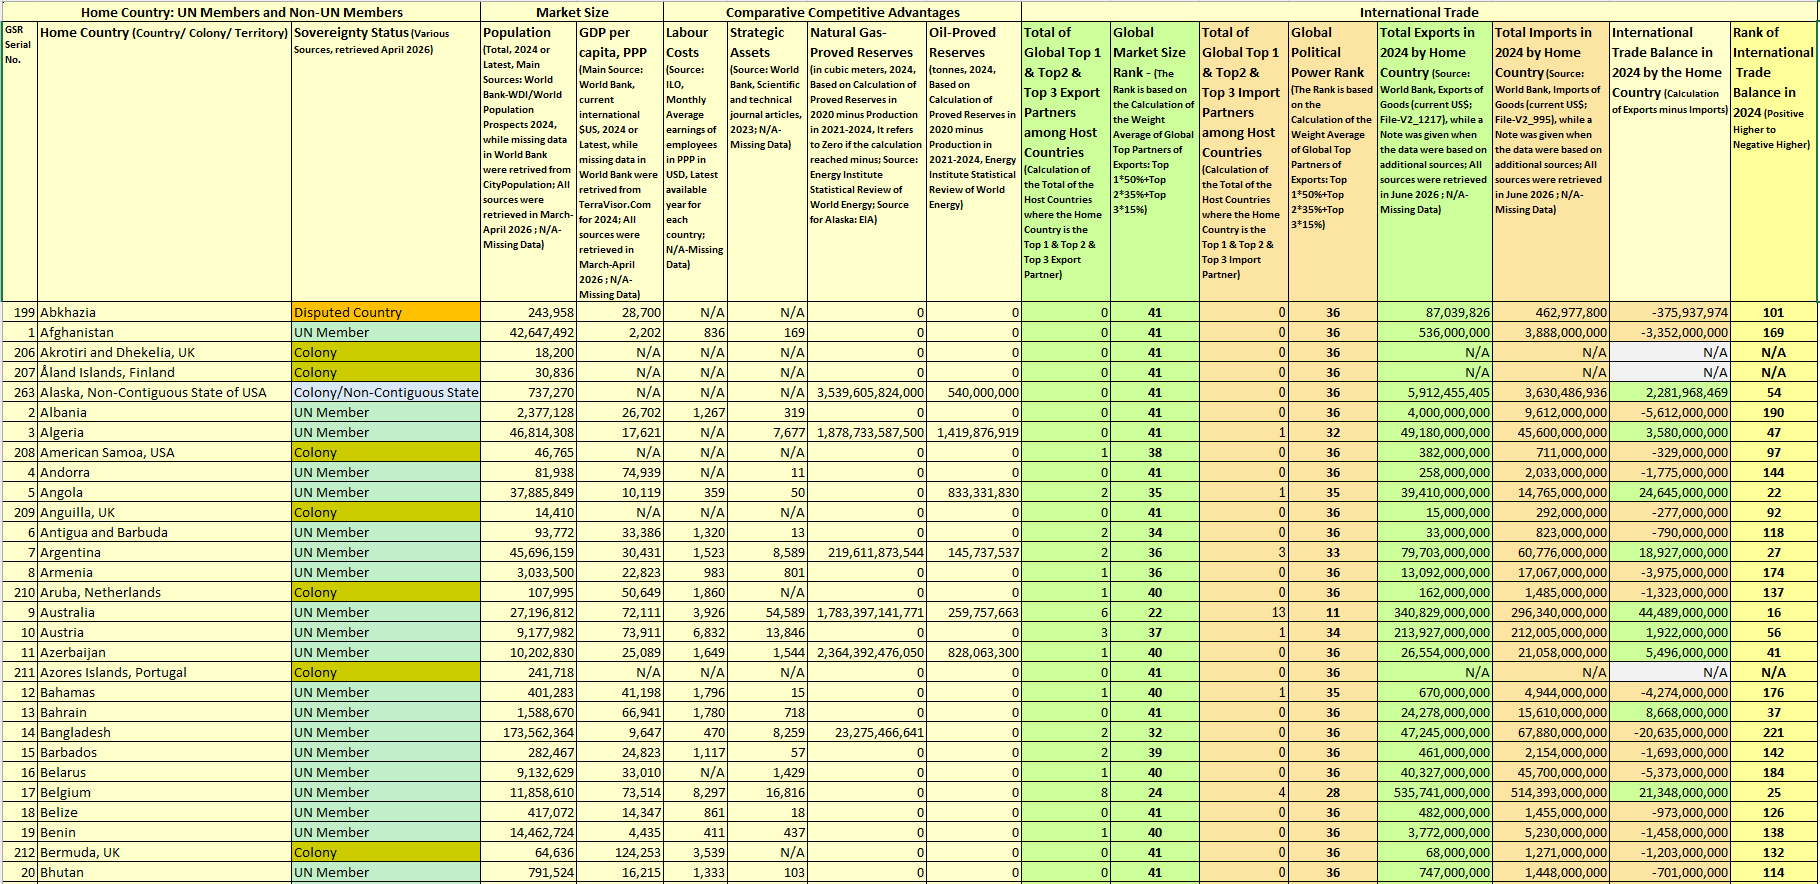
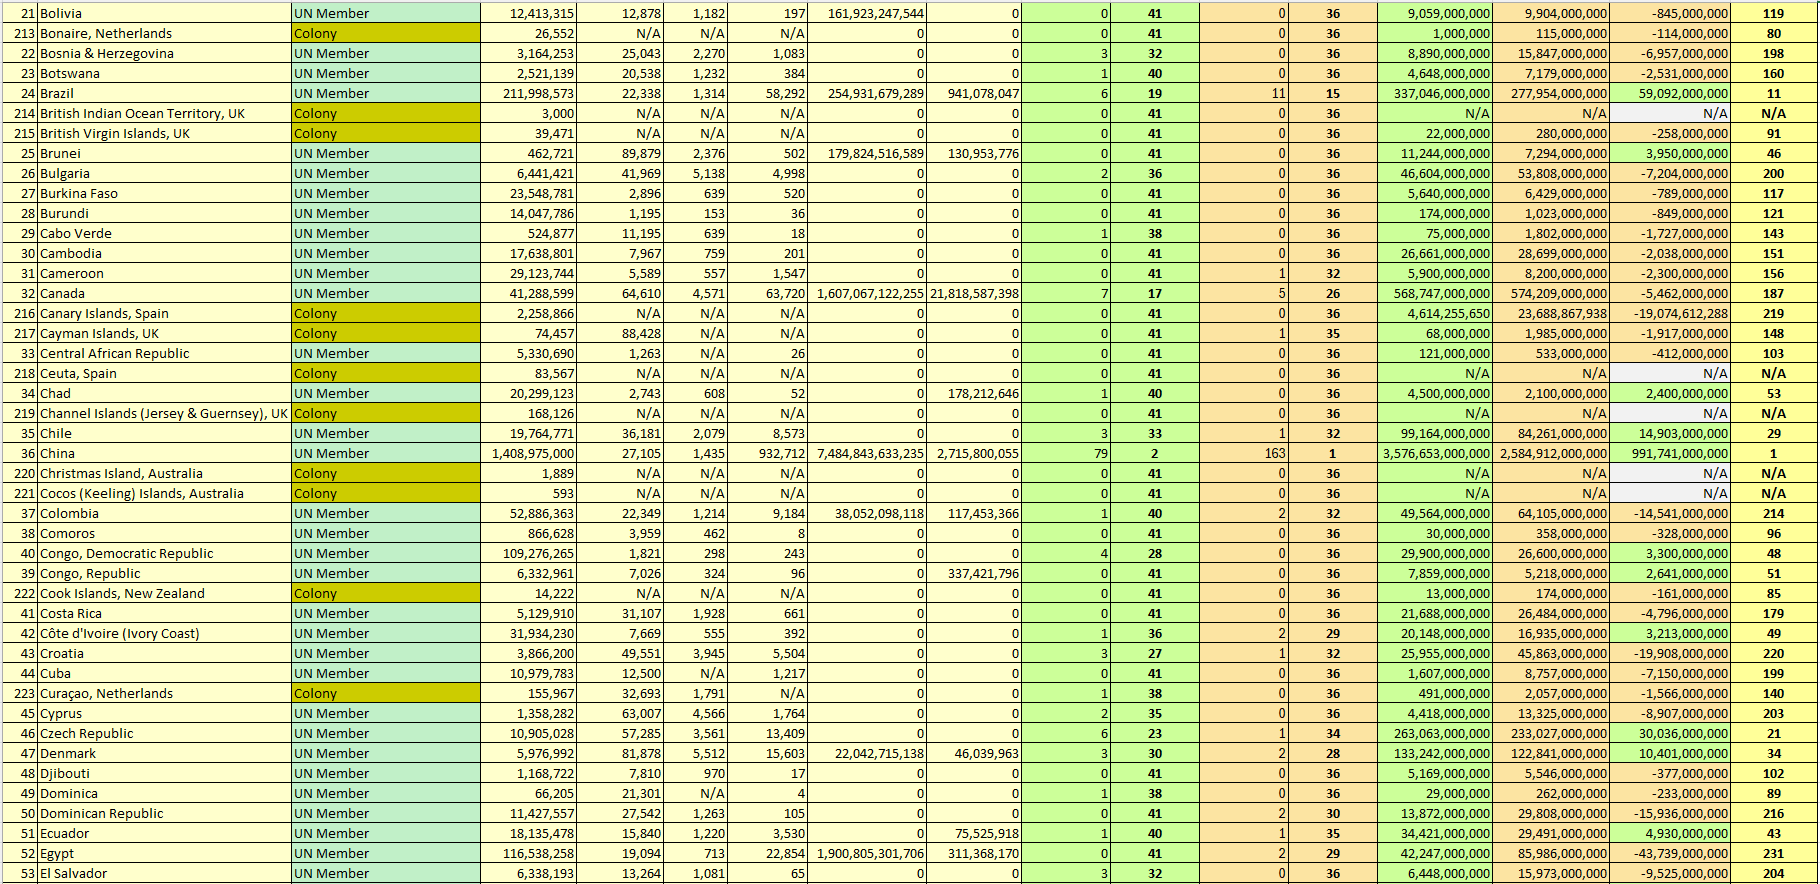
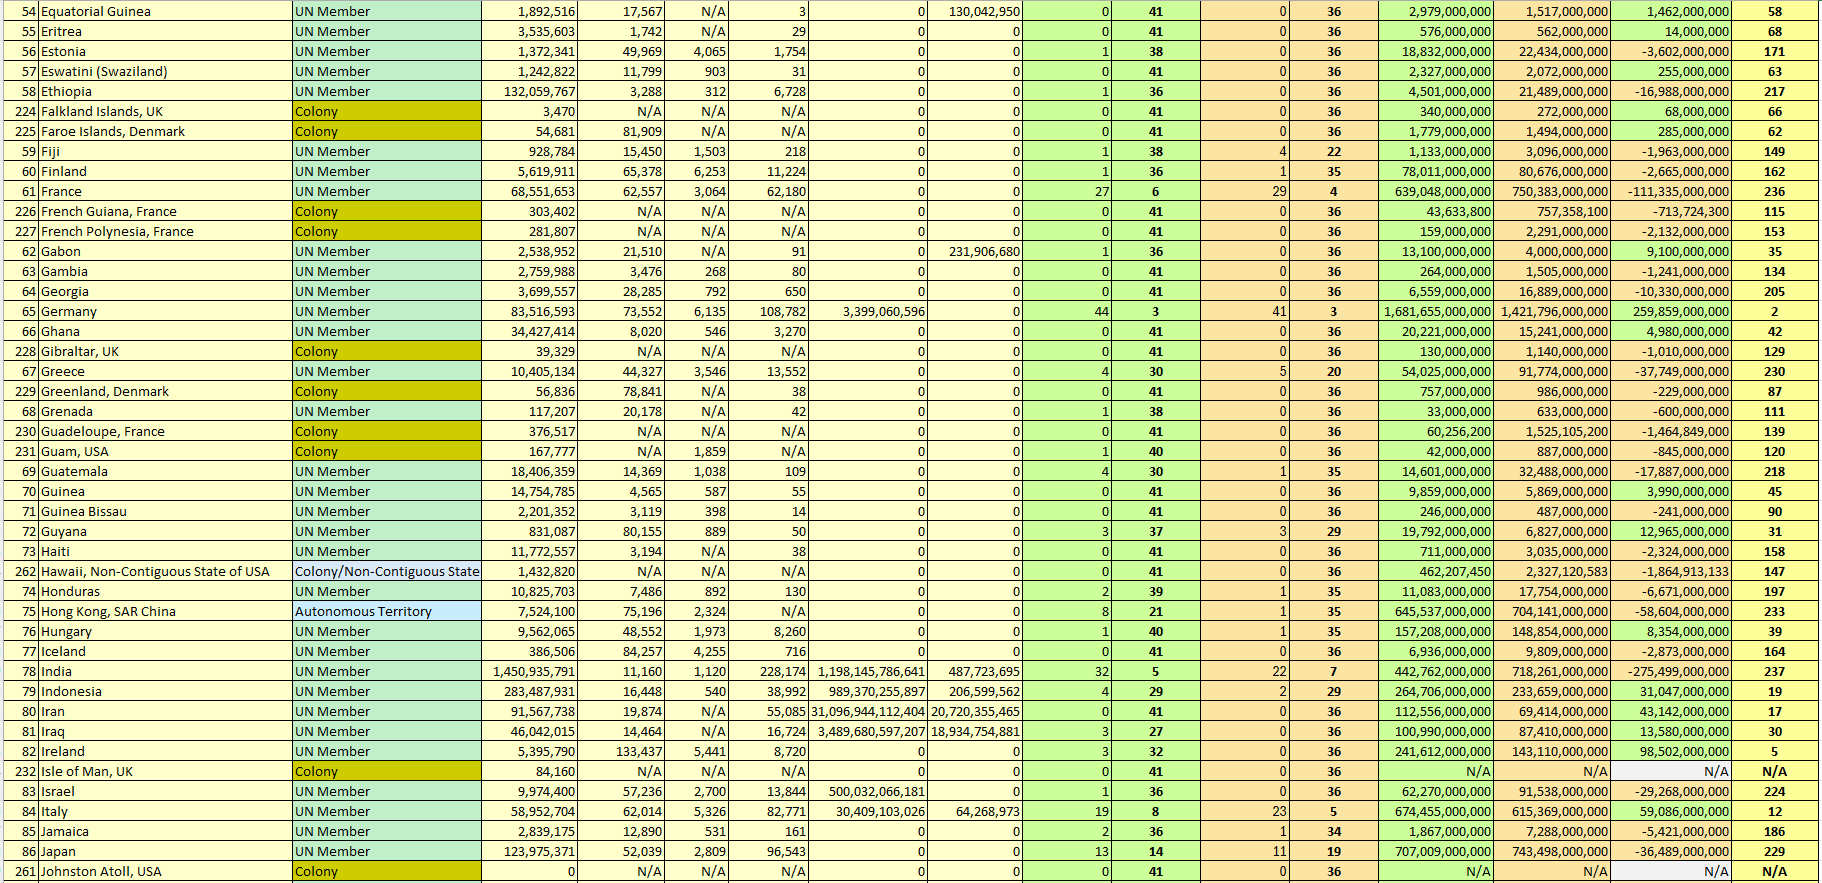
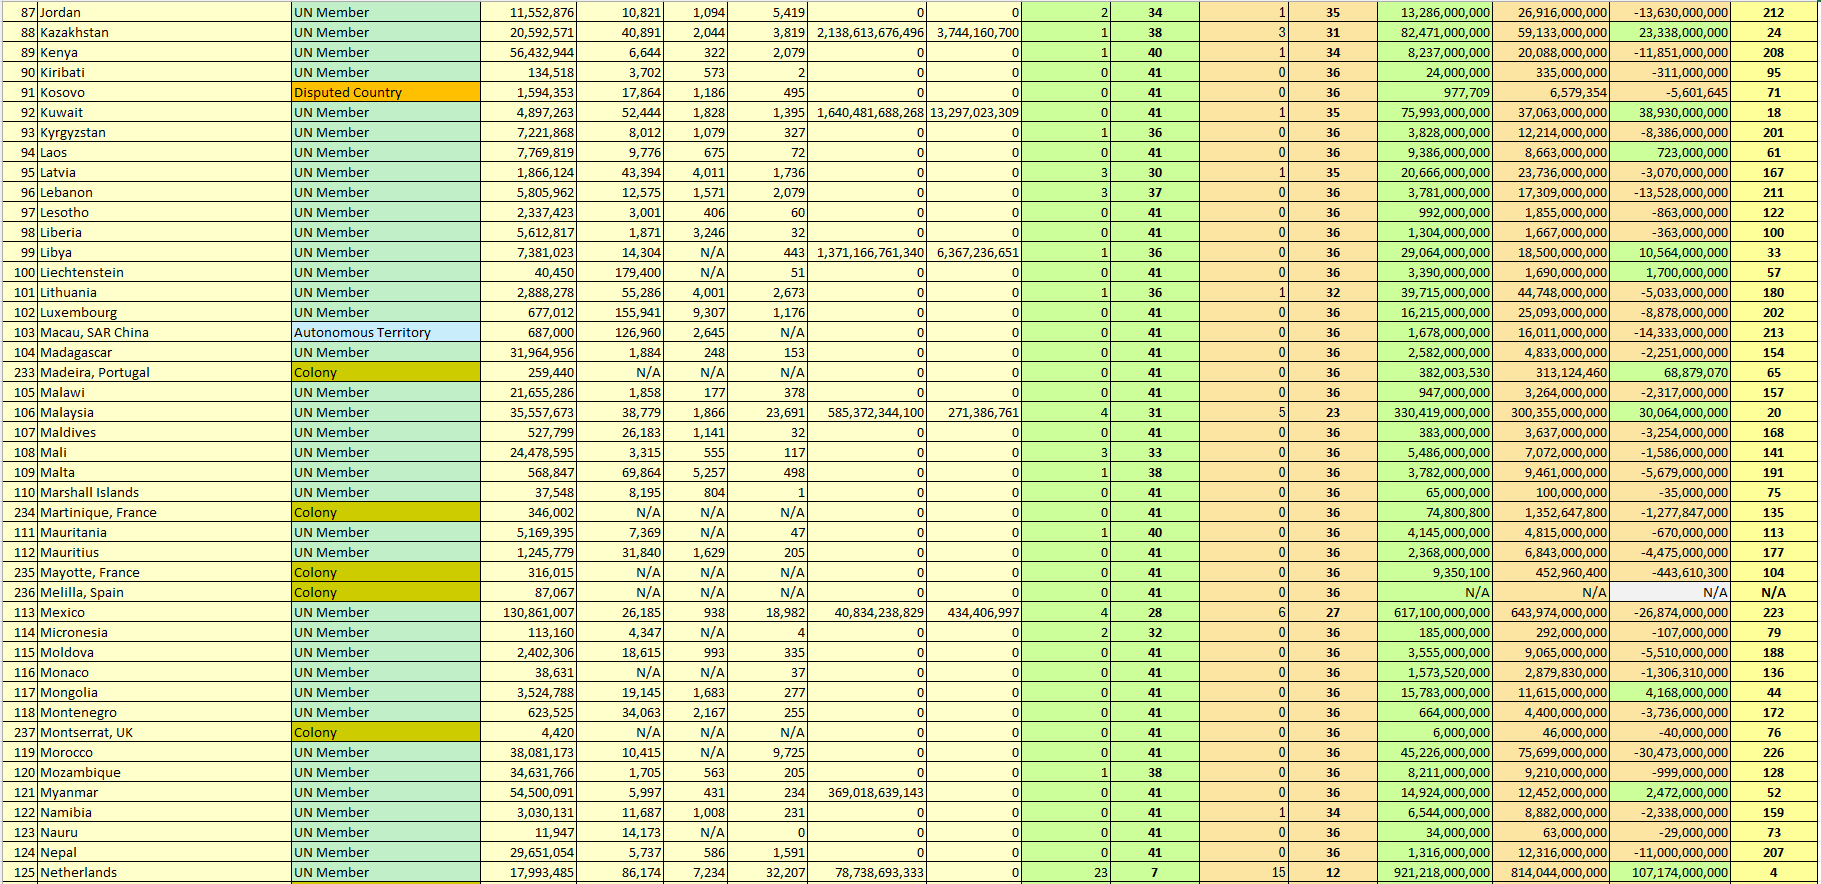
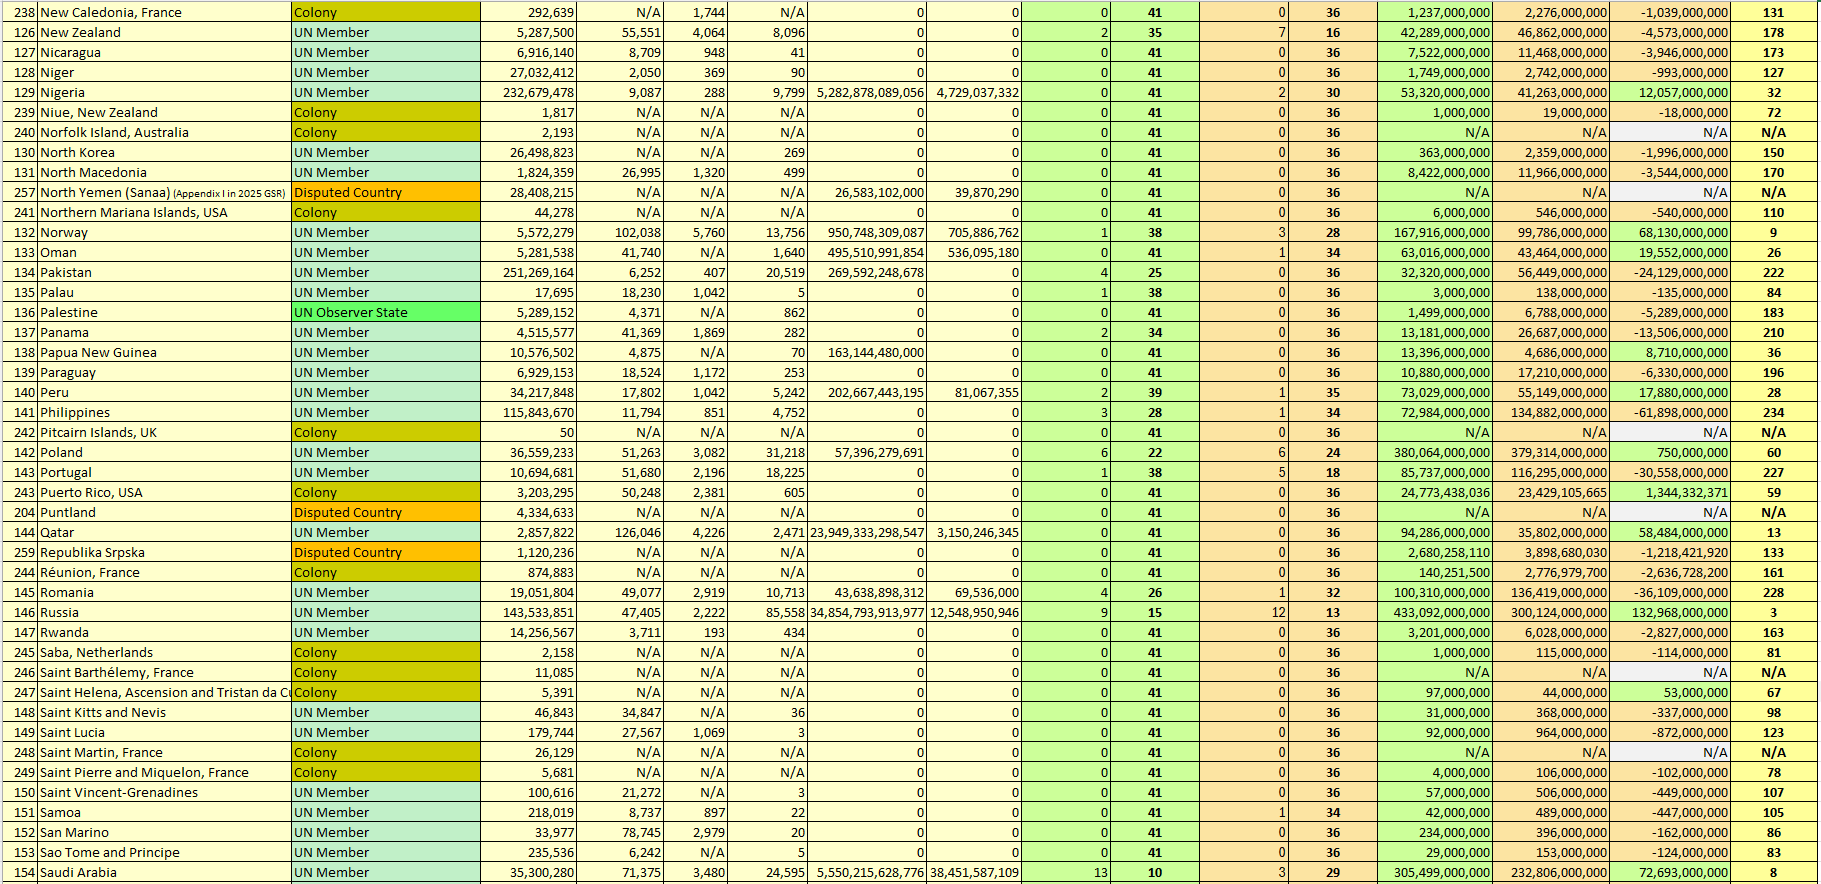
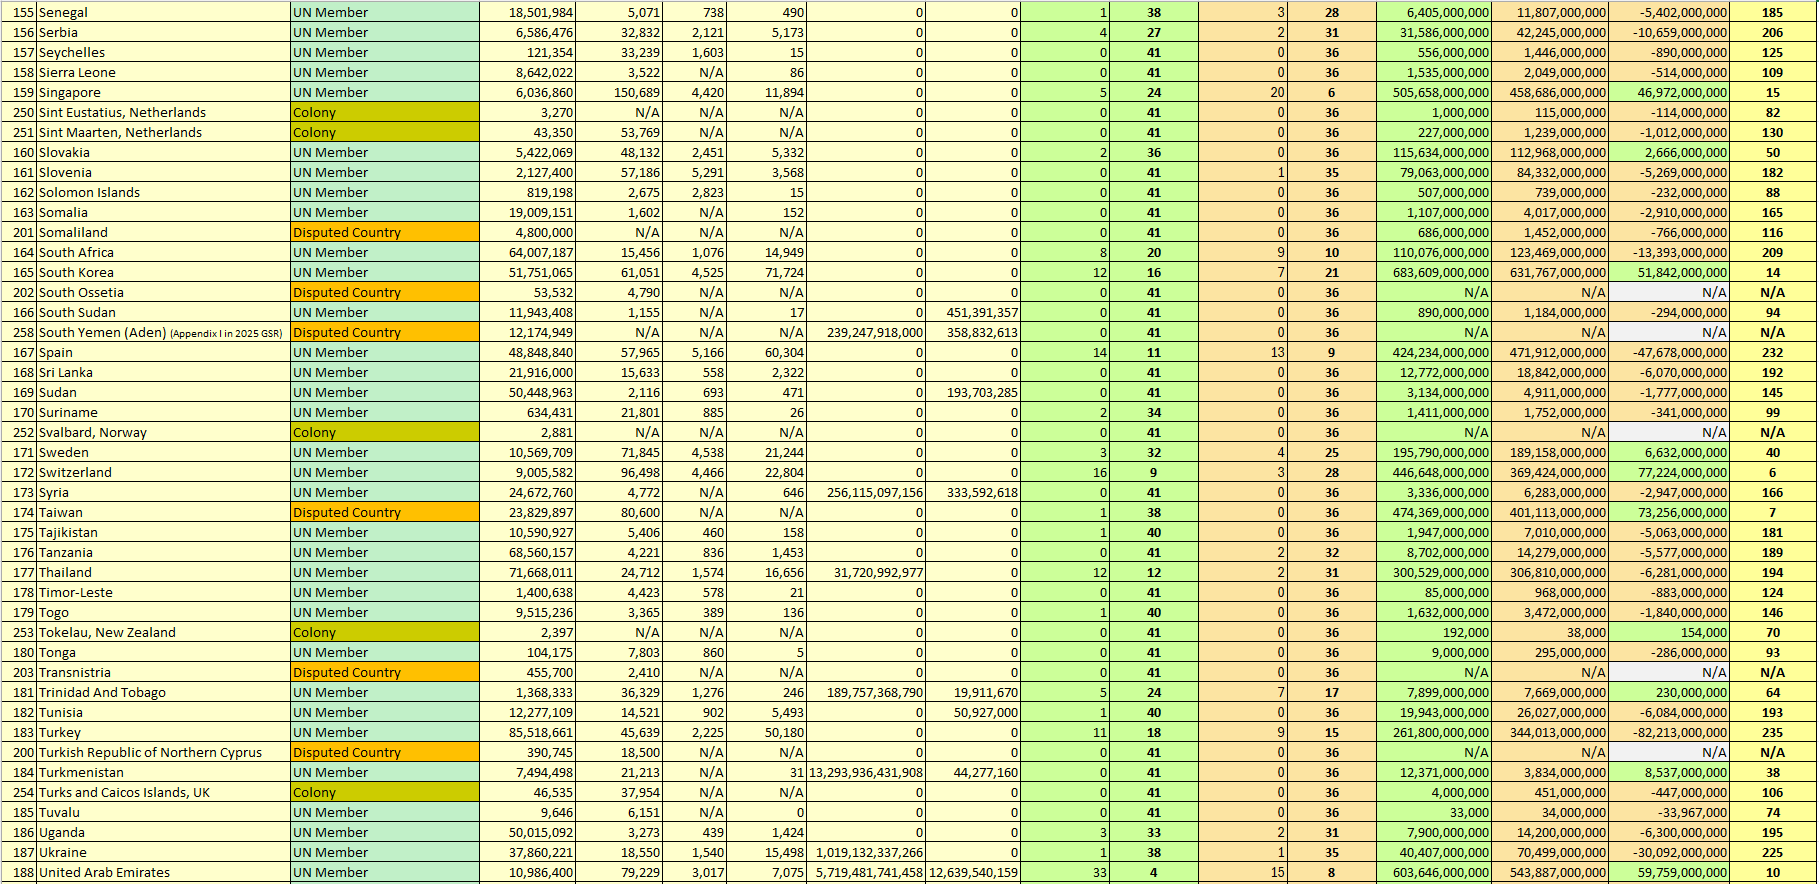

Section 3.7.1 The Impact of Market Size on International Trade: Population Size and the Level of GDP per Capita
Table 28. The Impact of Population Size on International Trade, Average by Each Category of Population Size
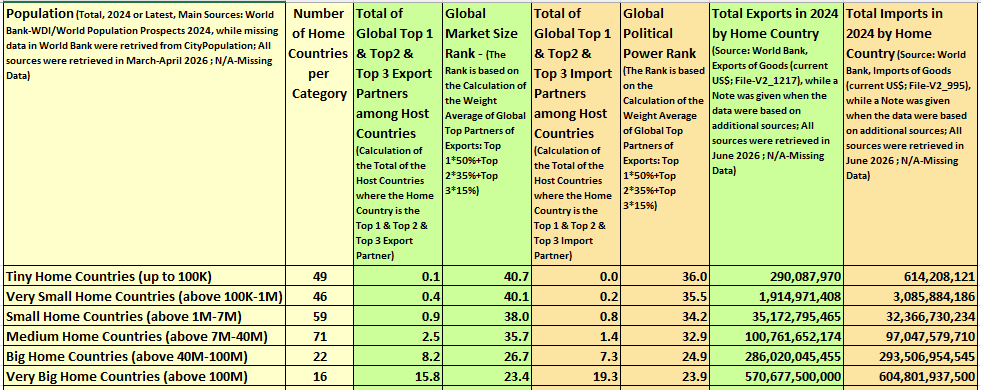
Note: For the Population Size of Each Home Country, Please see Table 27.
Table 29. The Impact of GDP per Capita on International Trade, Average by Each Category of GDP per Capita
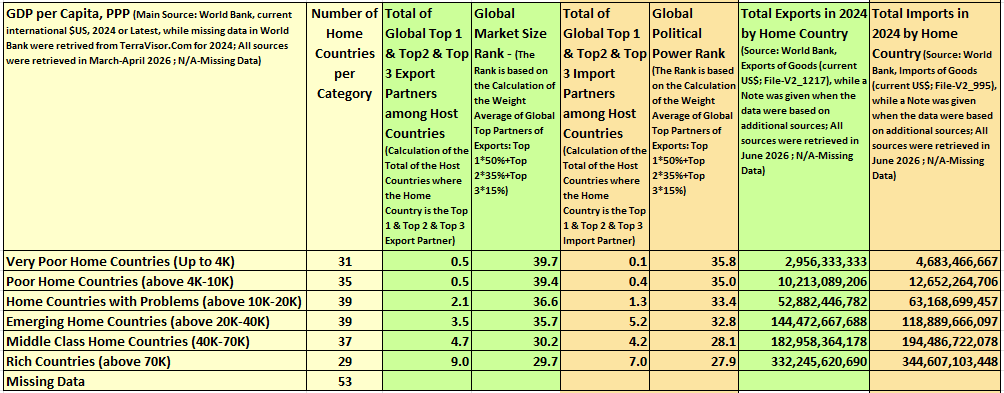
Note: For the GDP per Capita of Each Home Country, Please see Table 27.
Section 3.7.2 The Impact of Comparative Competitive Advantages on International Trade: Labour Costs, Strategic Assets, and Natural Resources
Table 30. The Impact of Labour Costs on International Trade, Average by Each Category of Labour Costs
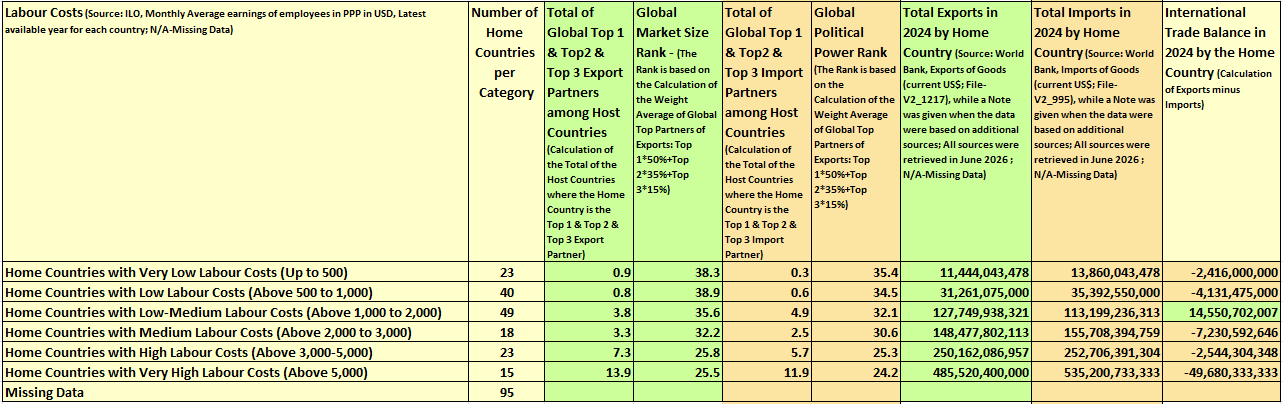
Note: For the Labour Costs of Each Home Country, Please see Table 27.
Table 31. The Impact of Strategic Assets on International Trade, Average by Each Category of Strategic Assets
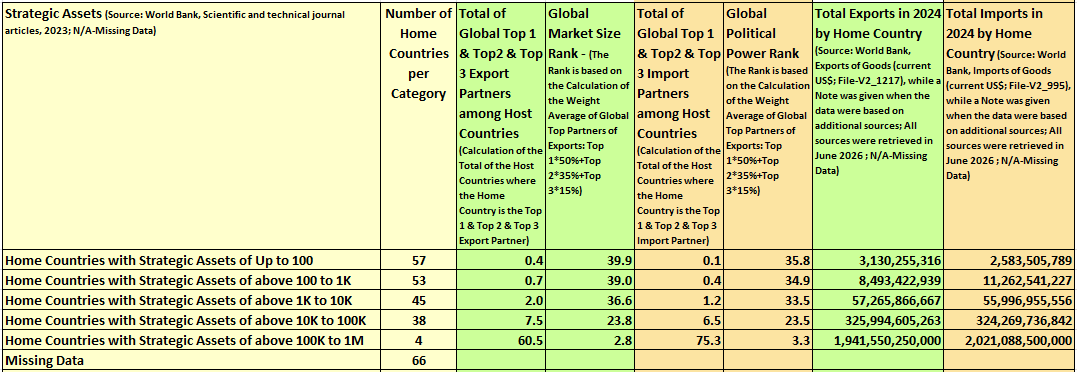
Note: For the Strategic Assets of Each Home Country, Please see Table 27.
Table 32. The Impact of Natural Resources on International Trade: Gas-Proved Reserves and Oil-Proved Reserves, Average by Each Category of Gas and Oil
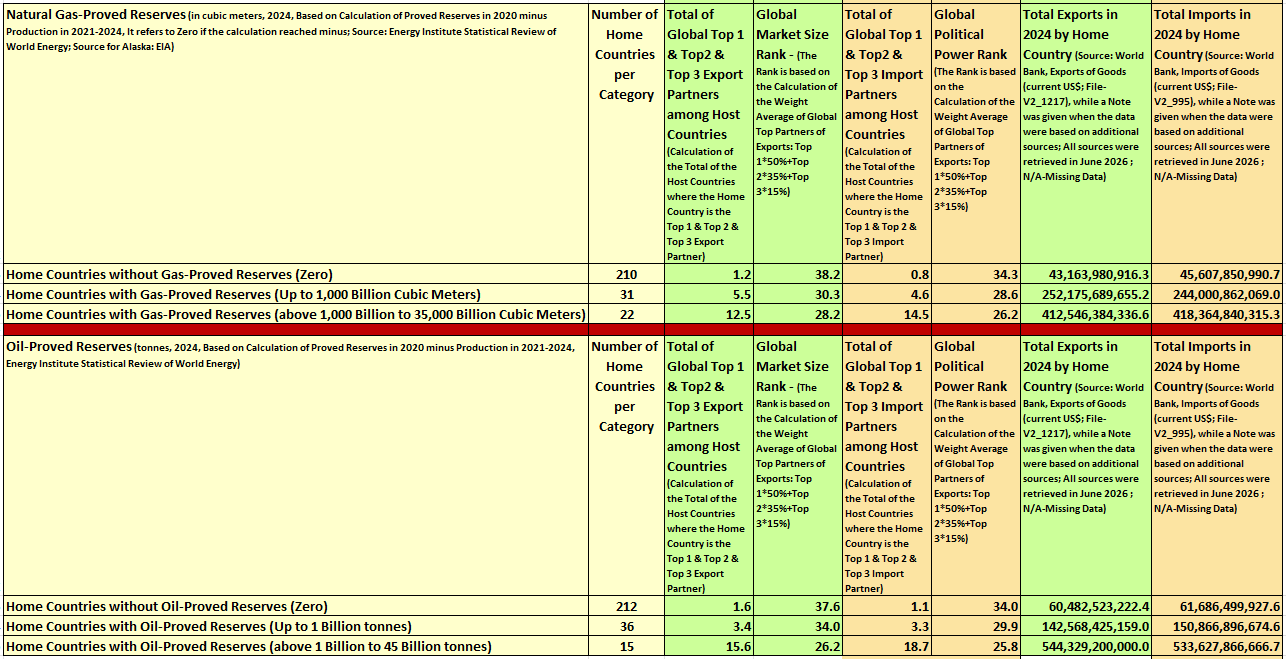
Note: For the Gas-Proved Reserves and Oil-Proved Reserves of Each Home Country, Please see Table 27.
Section 3.8. The Impact of the Government Policy on International Trade: Trade Policy and Labour Market Policy
Table 33. Government Policy - Trade Policy and Labour Market Policy: All UN Members and Non-UN Members, sorted by Alphabetical Order
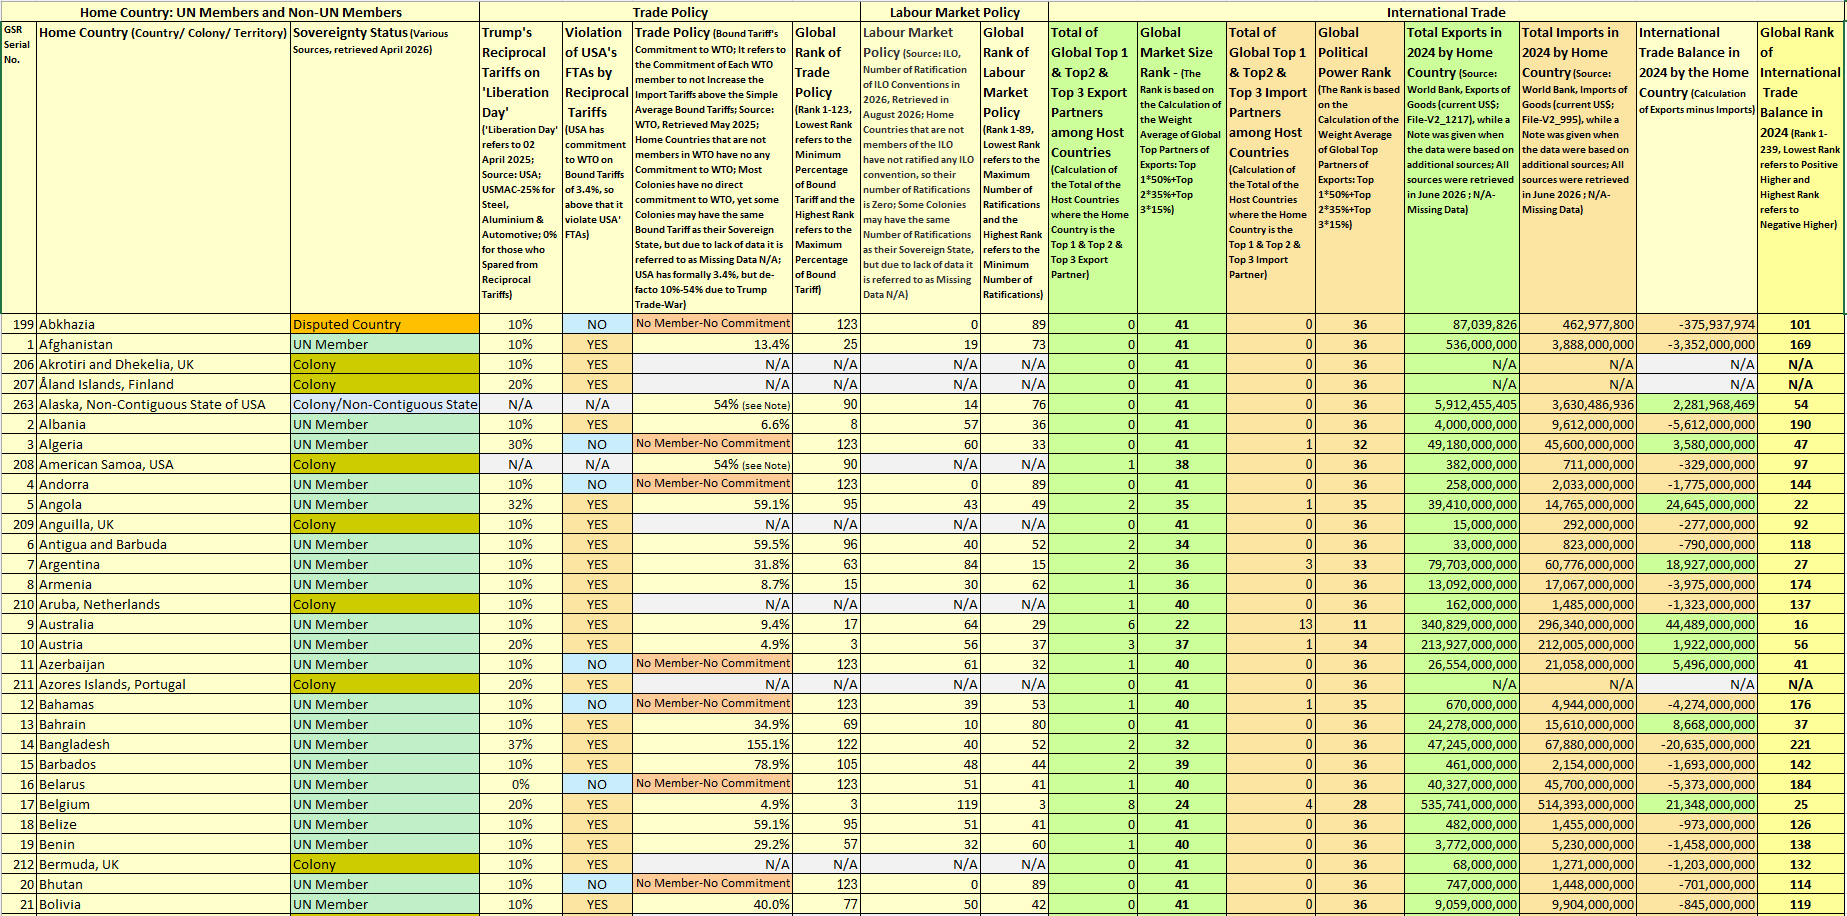
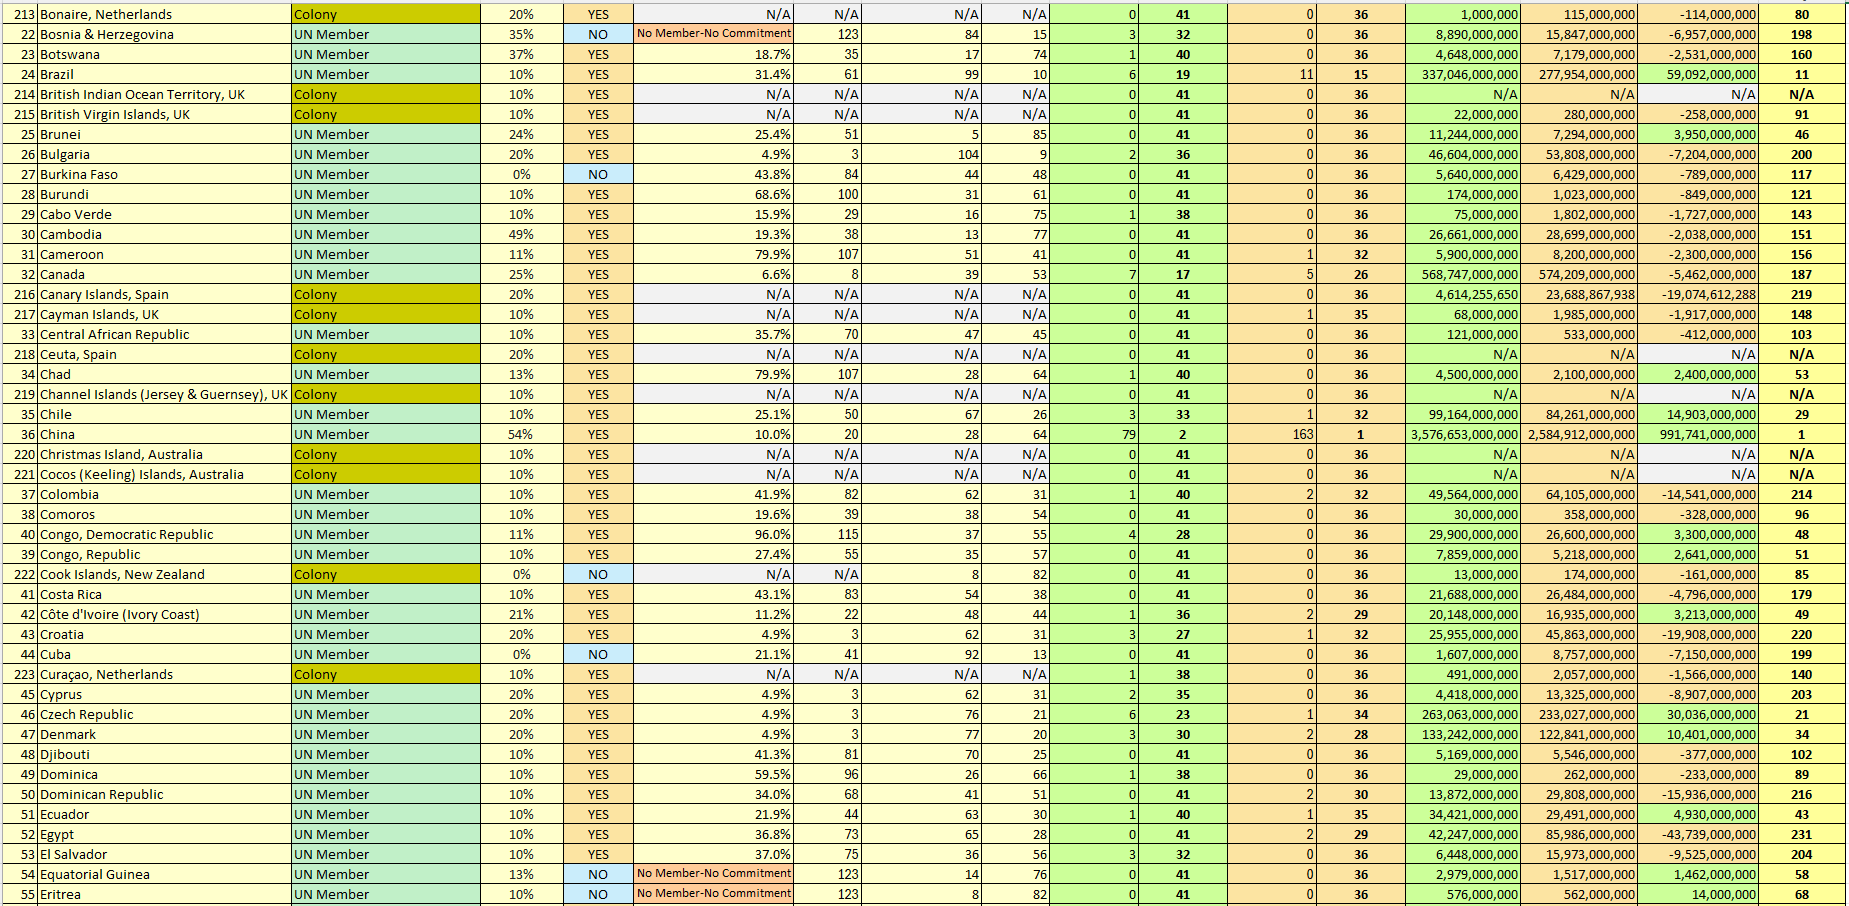
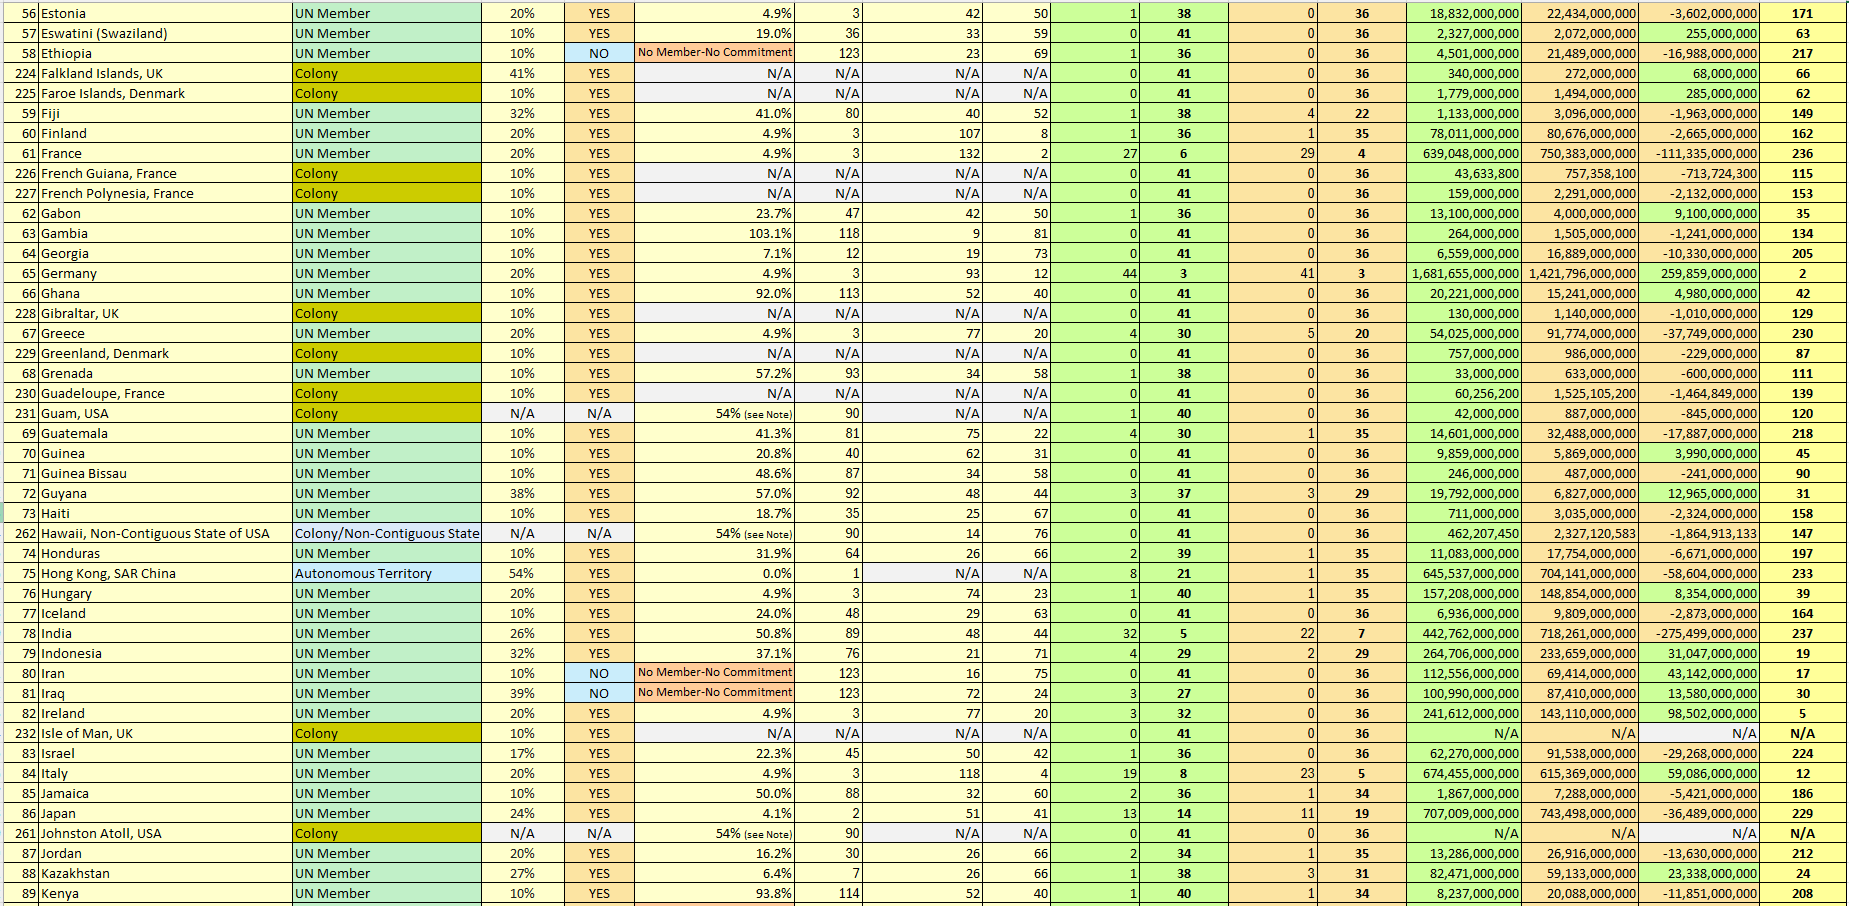
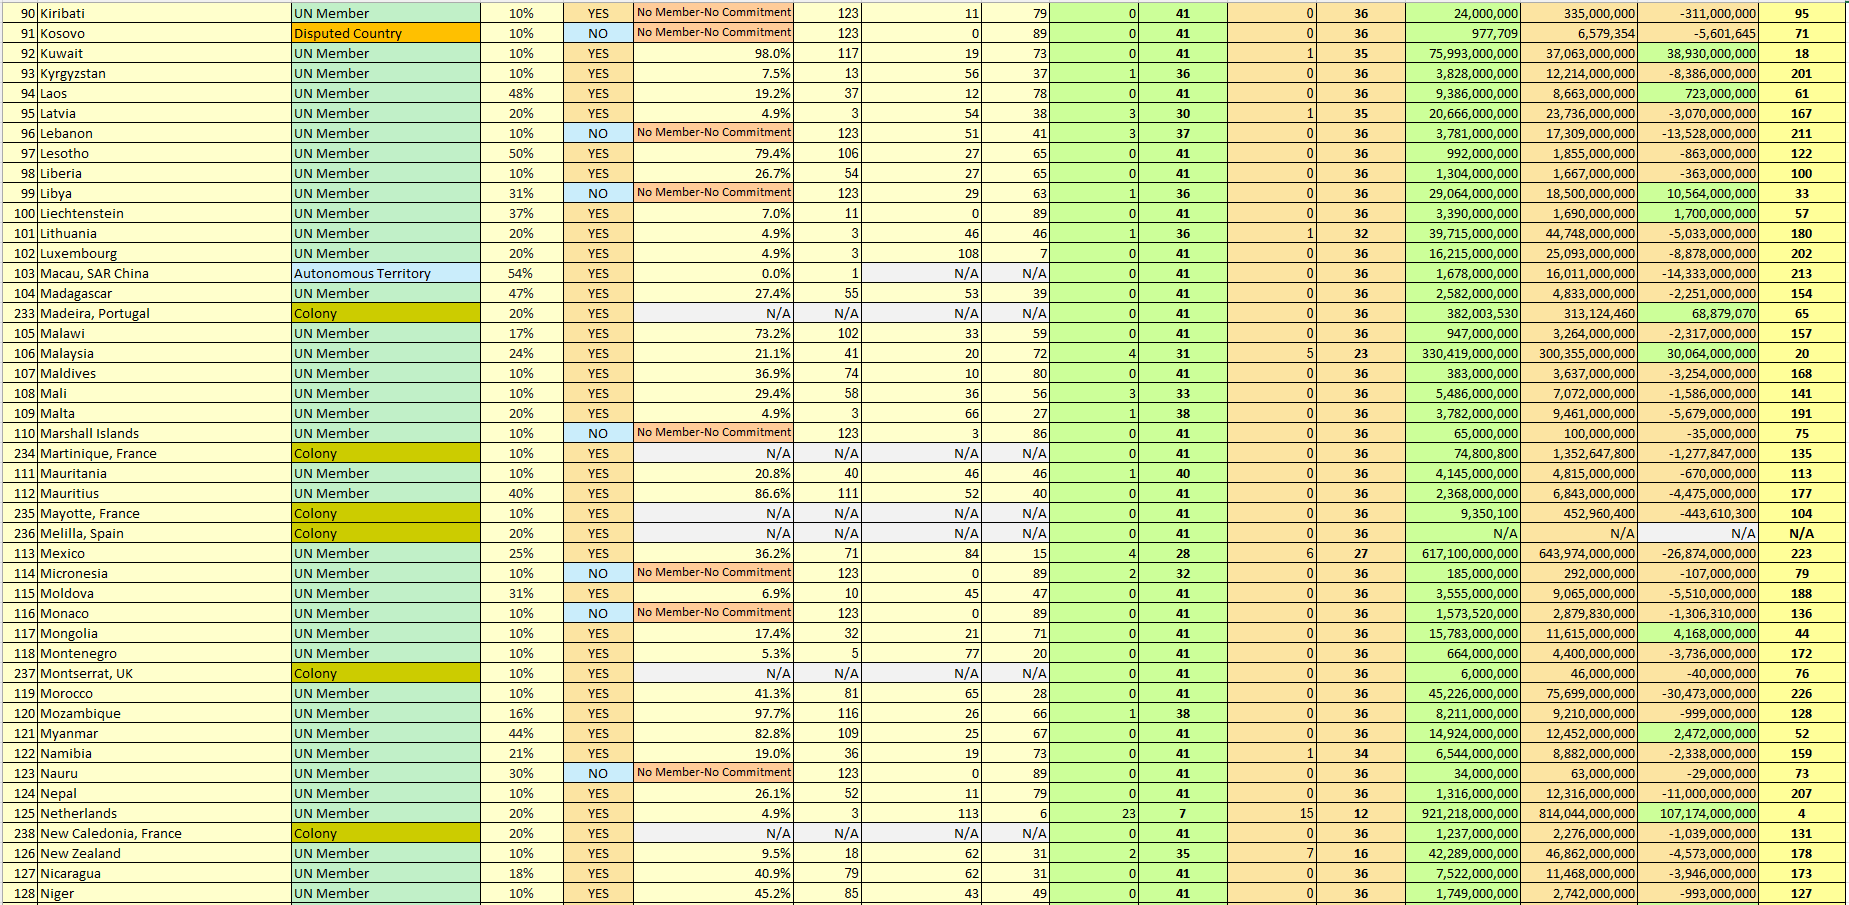
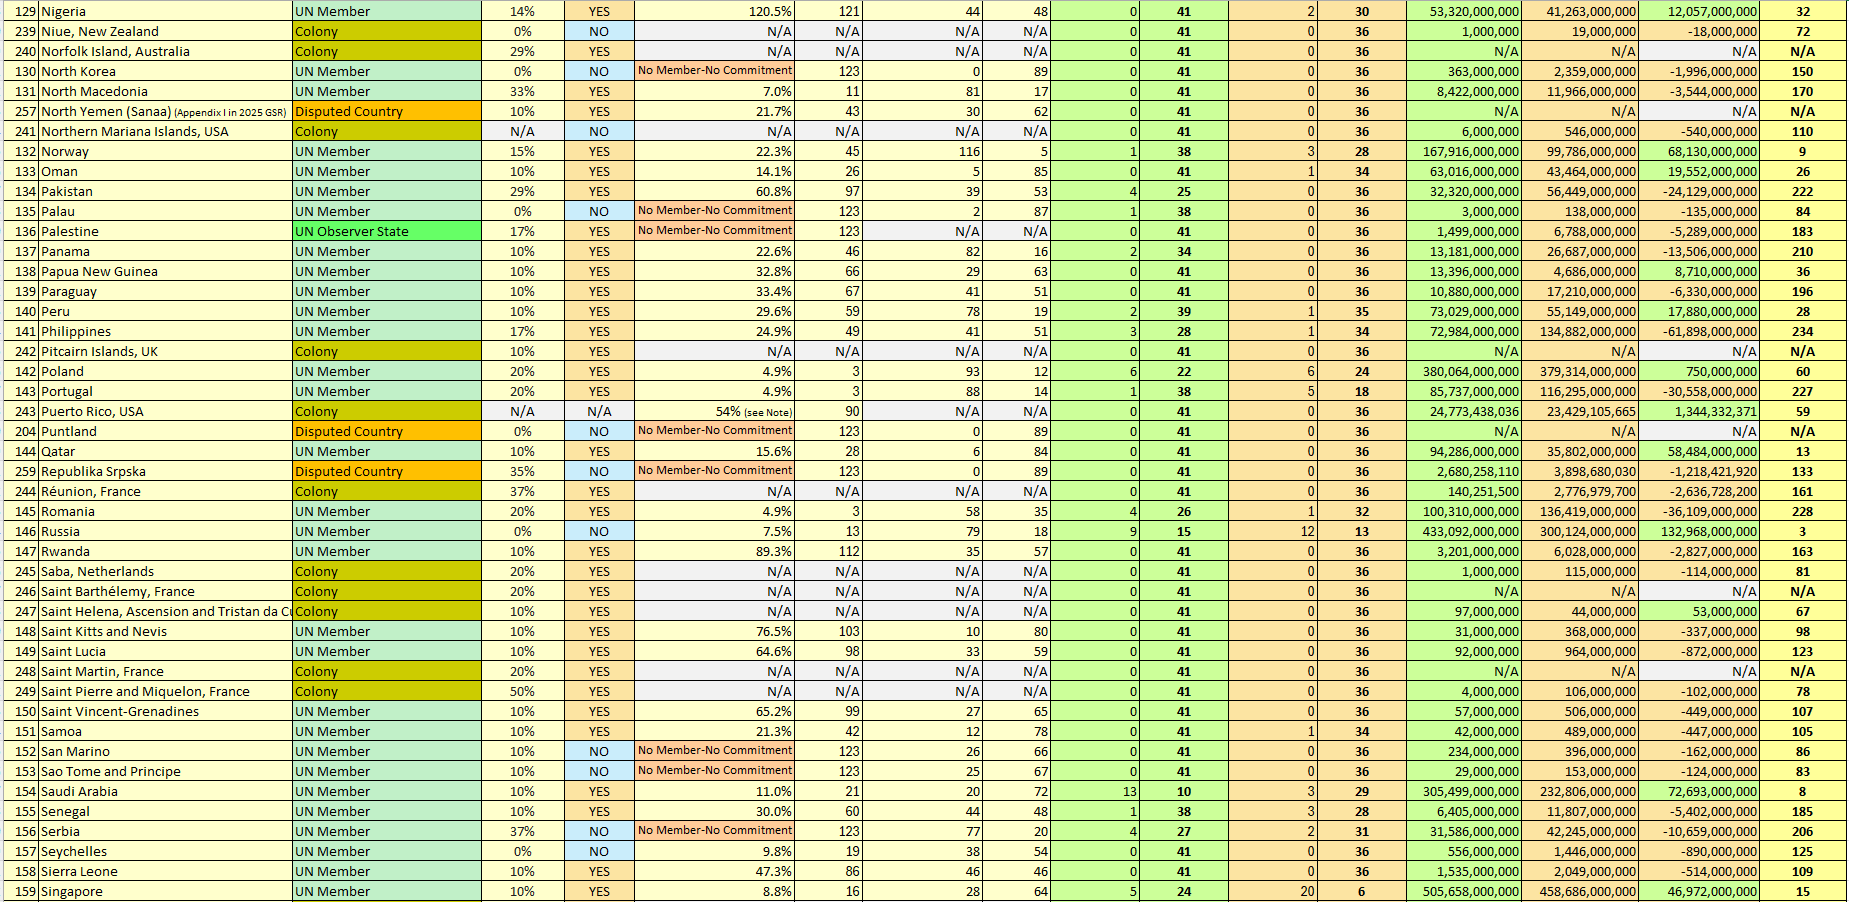
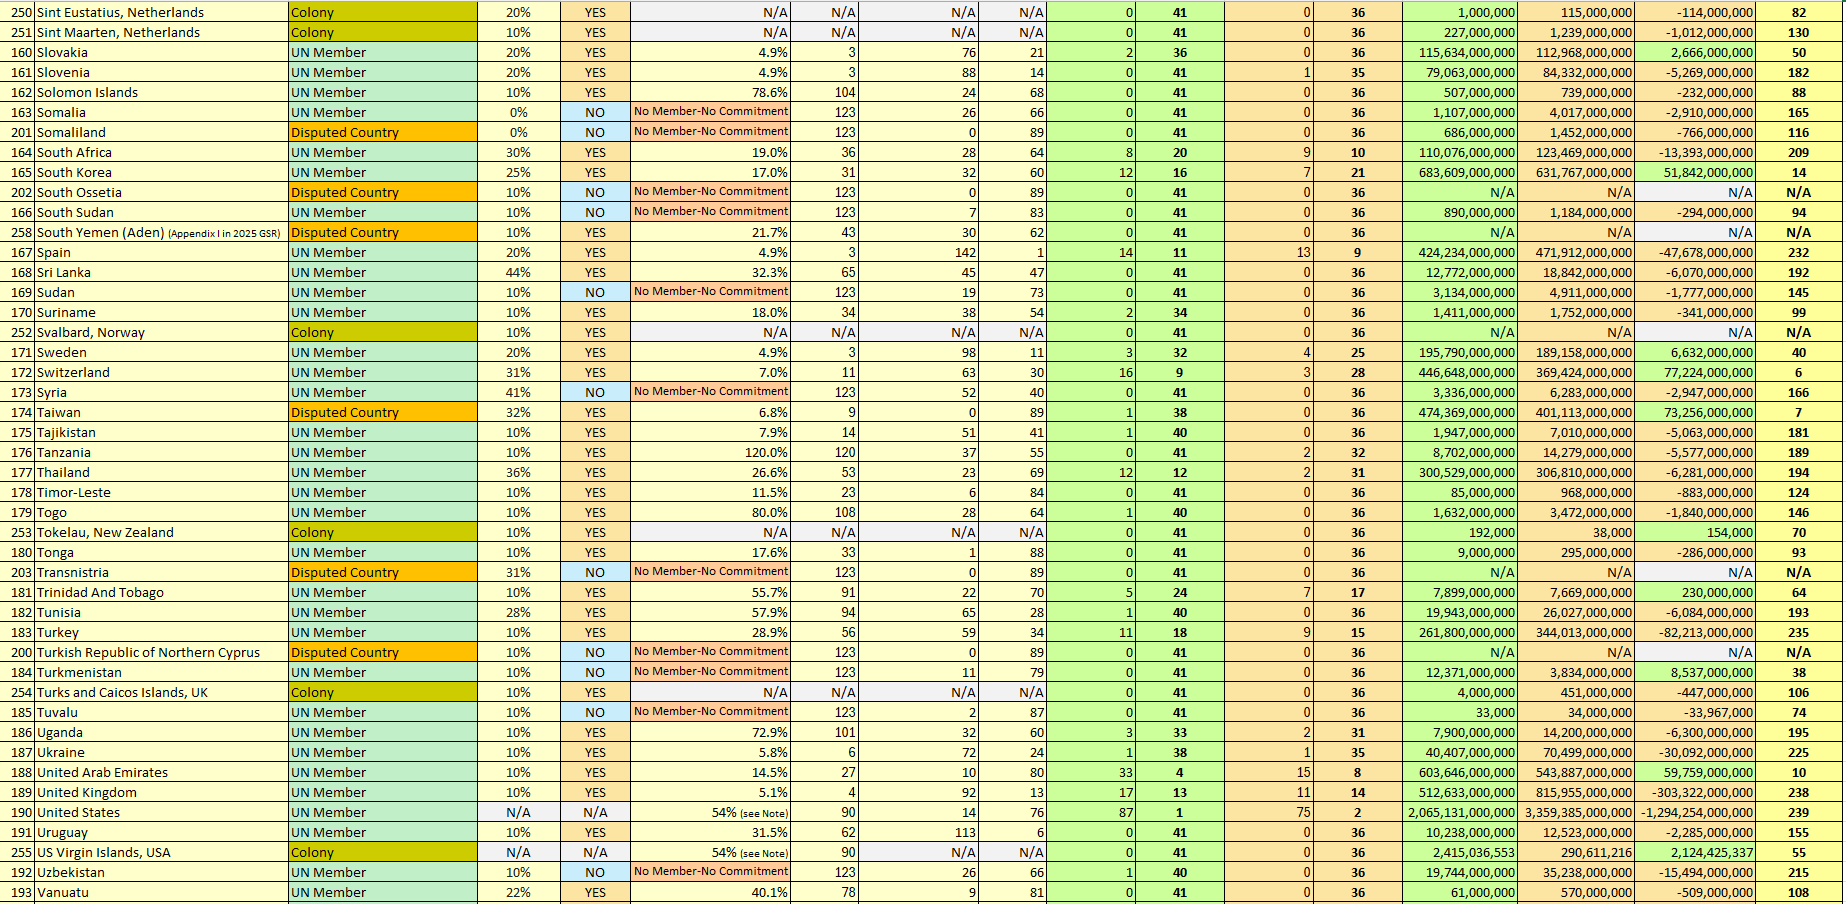

Table 34. The Impact of Trade Policy on International Trade, Average by Each Category of Trade Policy
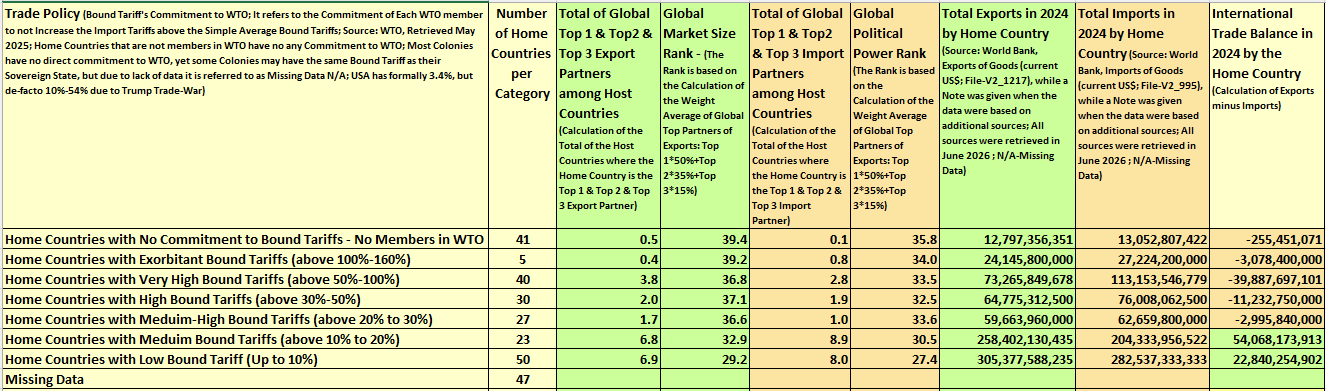
Note: For the Trade Policy of Each Home Country, Please see Table 33.
Table 35. The Impact of Labour Market Policy on Strategic Assets and Labour Costs, Average by Each Category of Labour Market Policy
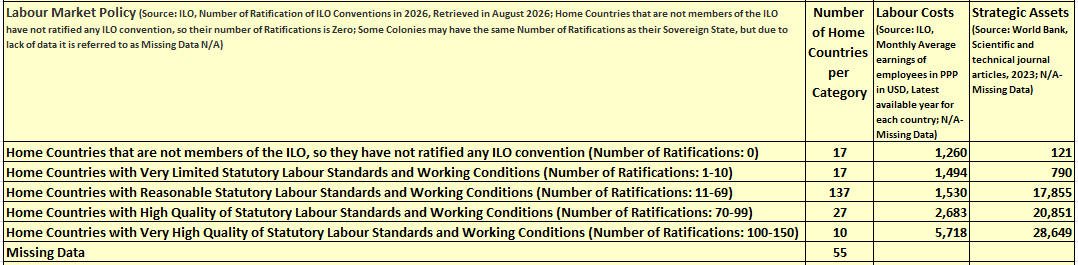
Note: For the Labour Market Policy of Each Home Country, Please see Table 33.
Section 4. Analysis of the Results:
Comparison between China, USA and Germany - Why China and Germany have the Best Positive Trade Balance, while the USA has the Worst Negative Trade Balance?
Monitoring International Trade by Dr. Ziva Rozen-Bakher for the year 2024 shows that there is a substantial difference between being a Global Top Import Partner and being a Global Top Export Partner, as shown in Chart D. that presents the three leading Global Top Partner of Export vs Import for the Year 2024: China, USA and Germany. The results show that China is the Global Top 1 Import Partner for 85 Home Countries, while respectively the USA for 33 Home Countries and Germany for 20 Home Countries, which indicates that China not only has the biggest export compared to others (see Table 13), but also China conducts exports to the larger number of home countries as their Top 1 Export Partner. In contrast, the USA is the Global Top 1 Export Partner for 87 Home Countries, while respectively China for 79 Home Countries and Germany for 44 Home Countries, which indicates that the USA not only has the biggest import compared to others, but also the USA conducts imports to the larger number of home countries as their Top 1 Import Partner (see Table 12).
Chart D. Top Export Global Partners vs Top Import Global Partners for 2024: China, United States, and Germany
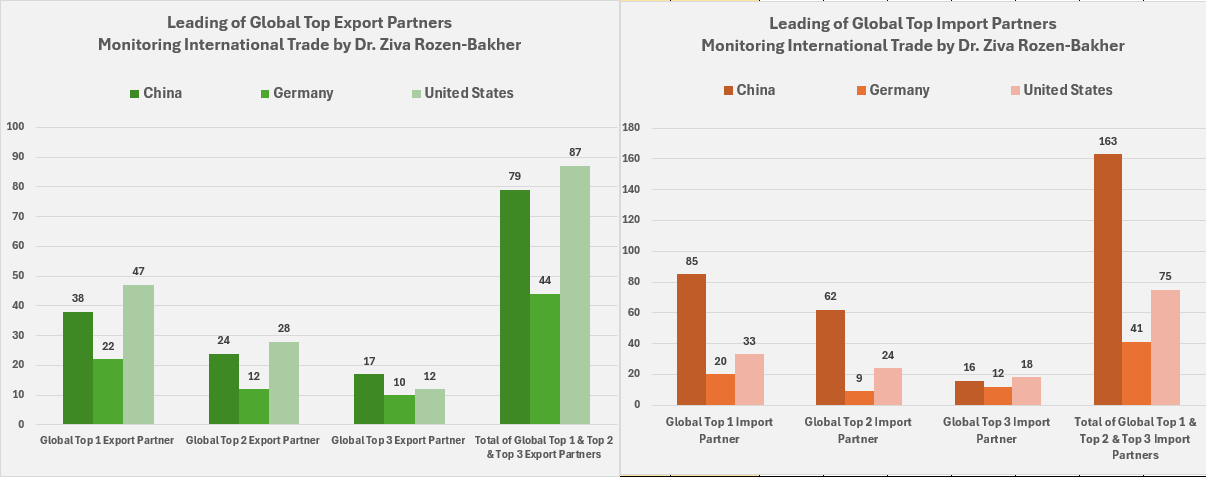
However, these results are good news for China, but bad news for the USA, because it means that China is strong in Export, while the USA is strong in Import, which significantly affects the International Trade Balance, as shown in Table E that presents the International Trade data of the three leading Global Top Partners for 2024. As shown in Table E, China has the best Global Rank of International Trade Balance (Rank=1), while the USA has the worst Global Rank of International Trade Balance (Rank=239). Still, the BIG question is Why the USA as a Superpower got into this trouble.
Table E. Top Export Global Partners vs Top Import Global Partners: China, United States, and Germany, sorted by the Global Rank of International Trade Balance
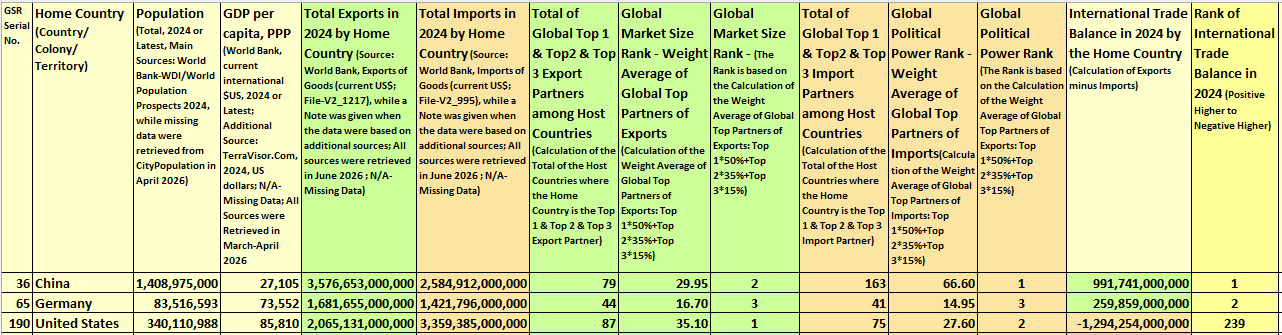
Thereby, if we look at this from a historical perspective based on the data on International Trade Balance of China vs the USA vs Germany over the years 1960-2024 as shown in Chart E, then we might think that Trump is right about his Trade-war through the Reciprocal Tariffs (Cite 80), regardless of the fact that the Reciprocal Tariffs violate the USA’s FTAs (Cite 81). More specifically, the historical data shows that 1968 was the first year when the USA ran into a Negative International Trade Balance (-1.3 Billion USD), and in most subsequent years as well, but from 1976 until 2024, the USA remained in a Negative International Trade Balance throughout those years, yet the Negative Balance grew significantly from -15,7 Billion USD in 1976 to -1,294 Billion USD in 2024. Thus, now, we should ask Why the USA as a Superpower has fallen into the trap of a negative trade balance already from the 1960s-1970s until today, despite that the USA even became a hegemonic superpower for over many decades due to the fall of USSR, which was changed into triple superpowers - USA, China, and Russia - only at the beginning of the 21st century.
Chart E. Historical Data on International Trade Balance, 1960-2024: China vs USA vs Germany
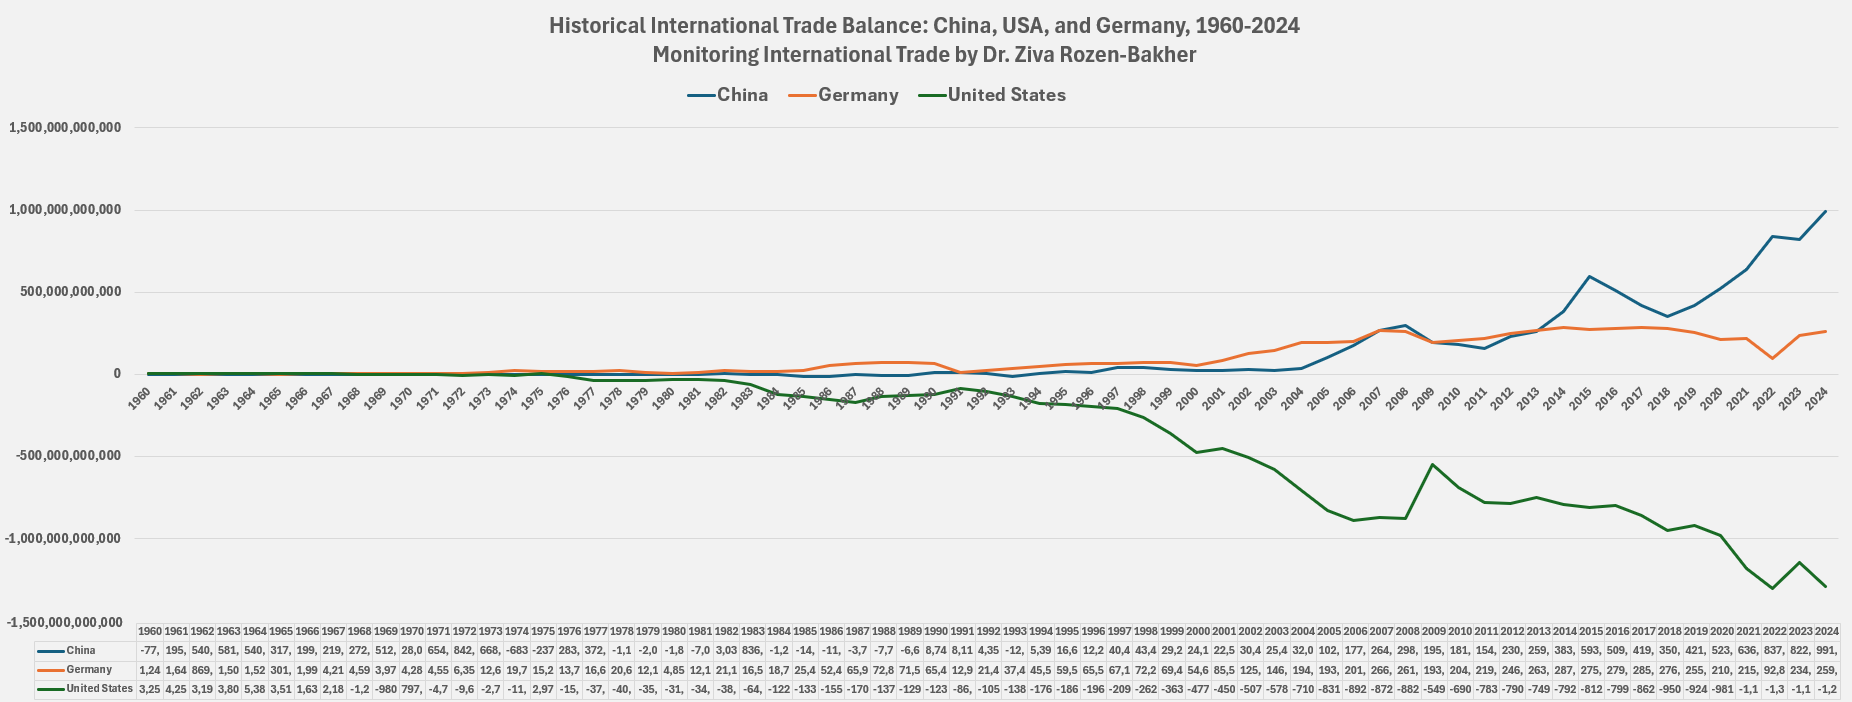
However, if we look at that from the perspective of how a country loses its Comparative Competitive Advantages in the long-run (see Chart F), then Trump's policy of 'America First' will lead to the opposite results, namely to an increase in the negative International Trade Balance of the USA as has happened to the USA since the 1960s, so the answer for the question of Why the USA got into the trouble of negative trade for more than 60 years may stem from losing the Comparative Competitive Advantages of the USA, but yet the question is Why the USA lost its Comparative Competitive Advantages. As shown in Chart F, a government that prevents from its MNEs from reducing costs by forcing `Domestic Production` over `International Production’ in order not to loss domestic jobs, will get into a `Domino Effect` spiral that will destroy, year after year, the Comparative Competitive Advantages of the country, because the MNEs will lose their ability to invest in R&D due to the lower profit under the `High-Cost Local Production`, resulting in an inability to create new strategic assets that are like `To Be or Not to Be’ for countries, especially for advanced countries (Cite 30). Thus, without Strategic Assets, the country will not be able to compete in the global market, and as a result, its market share will decrease at the global level.
Chart F. The ‘Domino Effect’ of the Lack of Comparative Competitive Advantages on Falling into the Trap of a Negative International Trade Balance versus the Positive Long-Term Impact of Comparative Competitive Advantages on Creating a Positive International Trade Balance
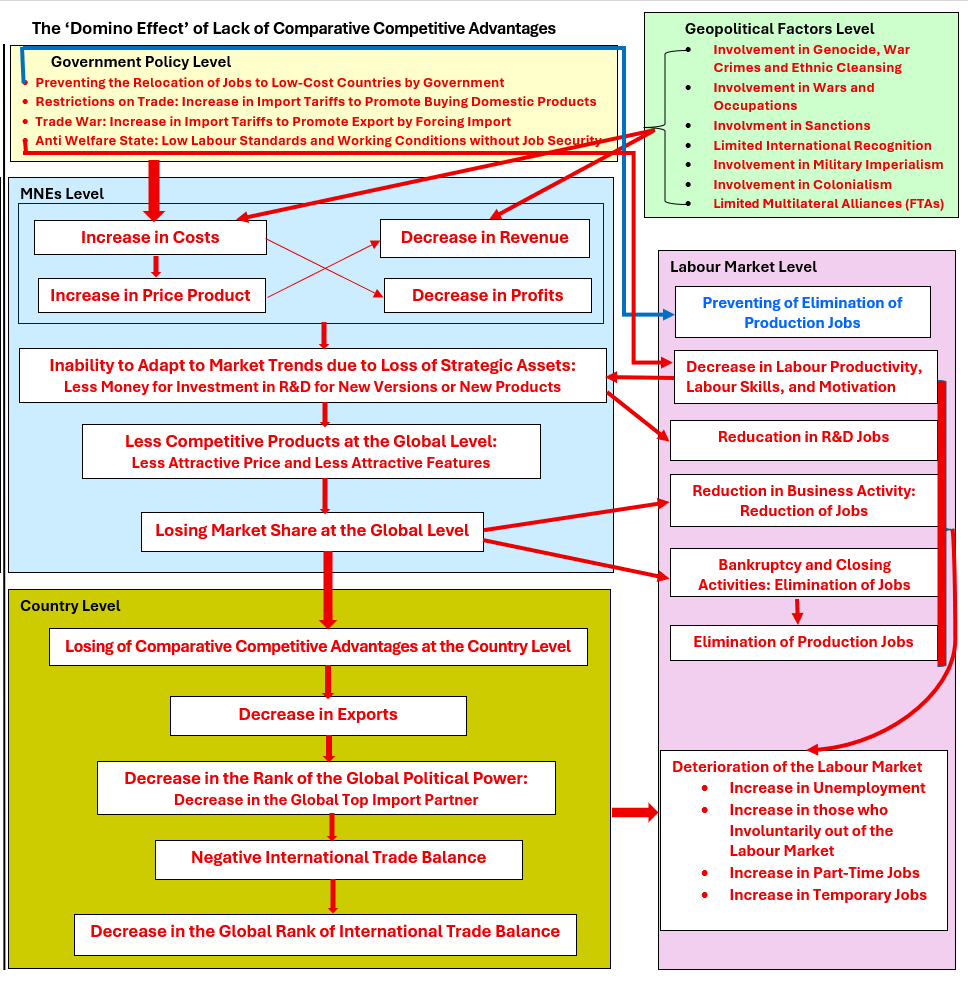
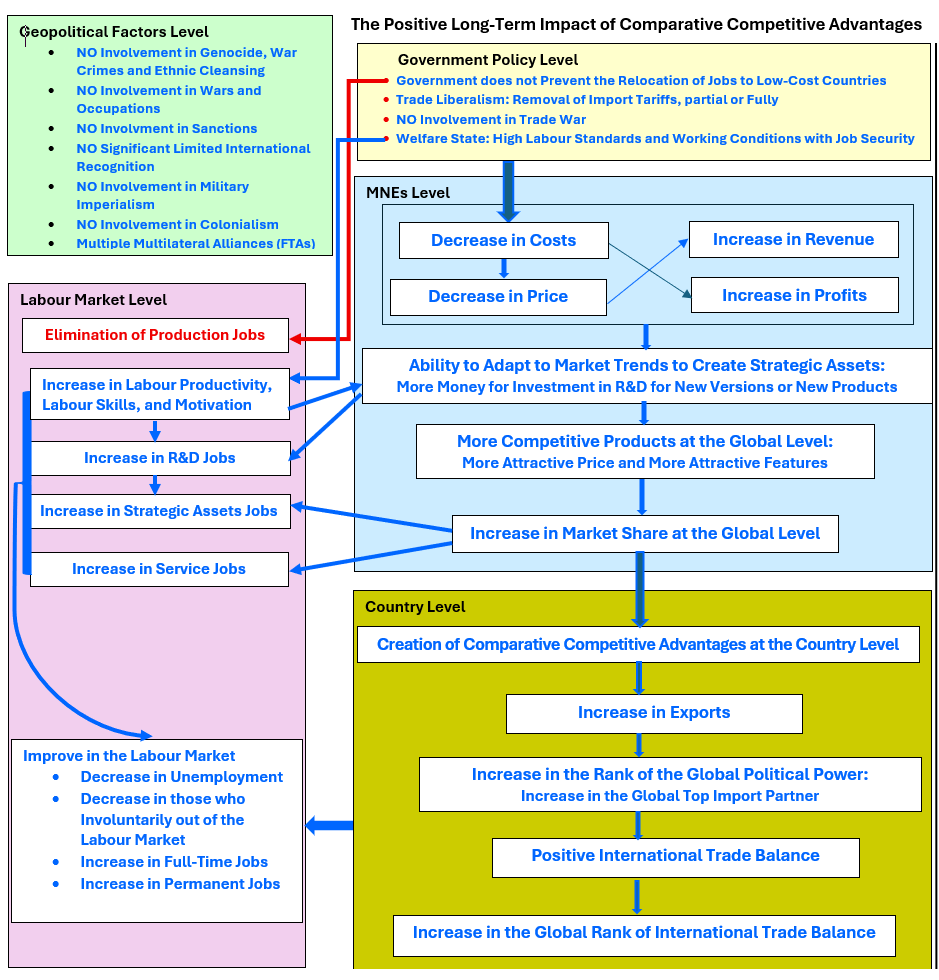
The fall of the American Automotive Industry in Detroit (Cite 82) may illustrate in a clear way how the 'Domino Effect' has led to the loss of Comparative Competitive Advantages of the USA in the long-run due to its long-term American policy of 'Nationalism-Mercantilism'. As shown in Chart G. that presents the Global Market of the Automotive Industry, the USA had 75.7% of the global market share in 1950, while it had only 11.3% in 2023. Therefore, paradoxically, the long-standing USA policy of keeping production jobs in the USA has led to the opposite result in the long-run, namely to the closure of American Automotive firms, and even to the Bankruptcy of Chrysler (Cite 92), one of the 'Big Three' (General Motors, Ford, and Chrysler), which was rescued twice by the US government from bankruptcy, and yet, despite all the money that was spilled by the USA government to save the Automotive jobs in the USA, the population of Detroit, including its jobs, fell from 1.8 million in 1950 to 600K in 2020, as shown in Chart H that shows Detroit's population from 1925 to 2020. Therefore, if in the 1950s and 1960s, the USA auto manufacturing was relocated to low-cost countries by the 'Big Three' and other American Automotive firms, then it is likely that the USA's share of Vehicle Production would be much higher now than it is today, and Detroit and its labour market might be in much better place than they are today, because of the higher profits due to `Low-Cost International Production` that may allow the creation of Strategic-Assets to secure the market share of the American cars in the global market. Thereby, it might be better to relocate production jobs to save the future of MNEs, rather than to keep production jobs at high costs that will lead in the long-run to a significant loss of market share and even to the closure of firms, resulting in elimination of jobs. In other words, it may be better to eliminate jobs to keep profitable firms, rather than to eliminate jobs due to the fall of firms as happened in Detroit.
Chart G. Global Vehicle Production, Market Share by Leading Countries, 1950-2023
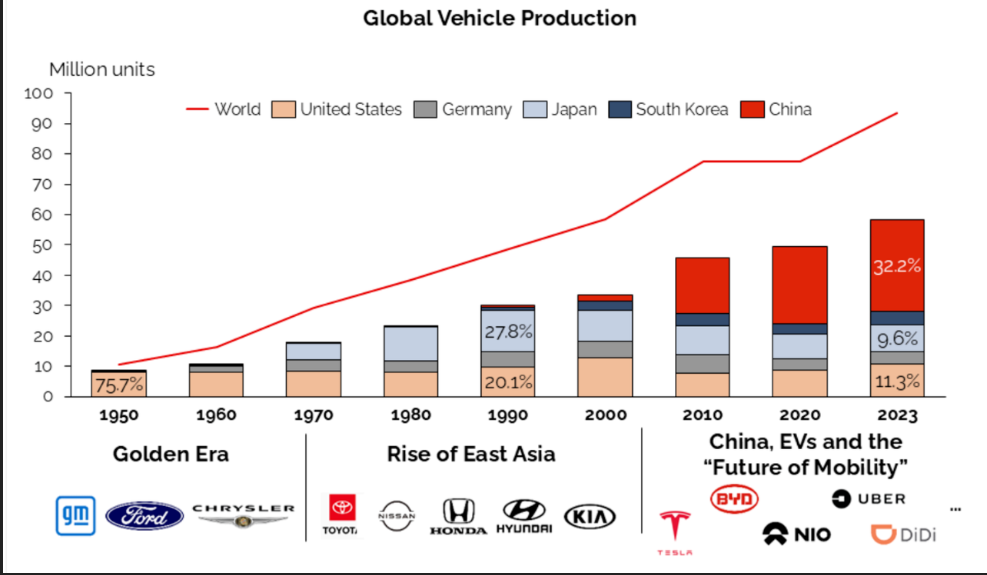
Chart H. Detroit Population, 1925-2020
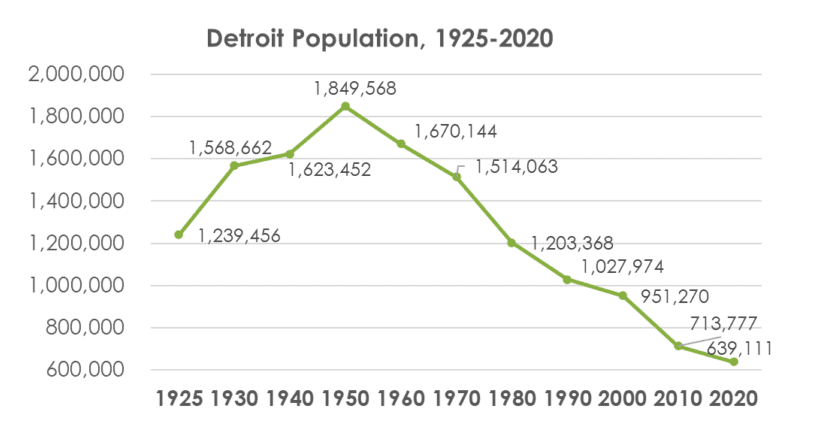
The historical data on Strategic Assets as shown in Chart I that compares China vs USA vs Germany over the years 1996-2023, confirms the assumption that the Strategic-Assets are like `To Be or Not to Be’ for the creation of Comparative Competitive Advantages of a country, even for Emerging countries as shown in Chart J. that presents the Top 15 Home Countries with the Highest Strategic Assets. First, as shown in Chart I, the growth in the Strategic Assets of the USA and Germany over the years has been minor compared to China, namely the Strategic Assets of China has grown in unprecedented way over the years, but since 2016, China even has become the top leader in Strategic Assets with a significant advantage compared to other countries. Second, as shown in Chart J. the reason that China has more Strategic Assets compared to the USA is not because of the big population but due to the investment in R&D, because if we compare China to India that both have the same population size, then China has more significant Strategic Assets compared to India (932,712 vs 228,174).
Chart I. Historical Data on Strategic Assets, 1996-2023: China vs USA vs Germany
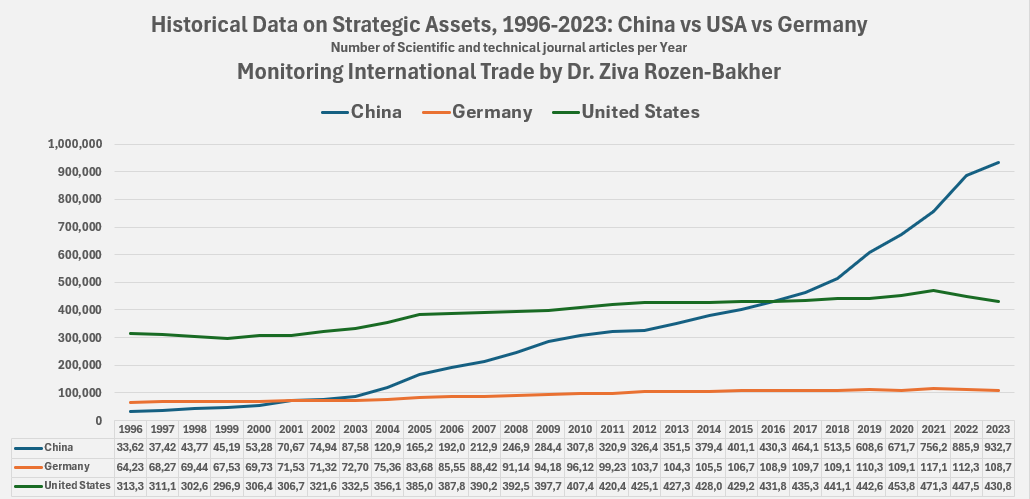
Chart J. Top 15 Home Countries with the Highest Strategic Assets
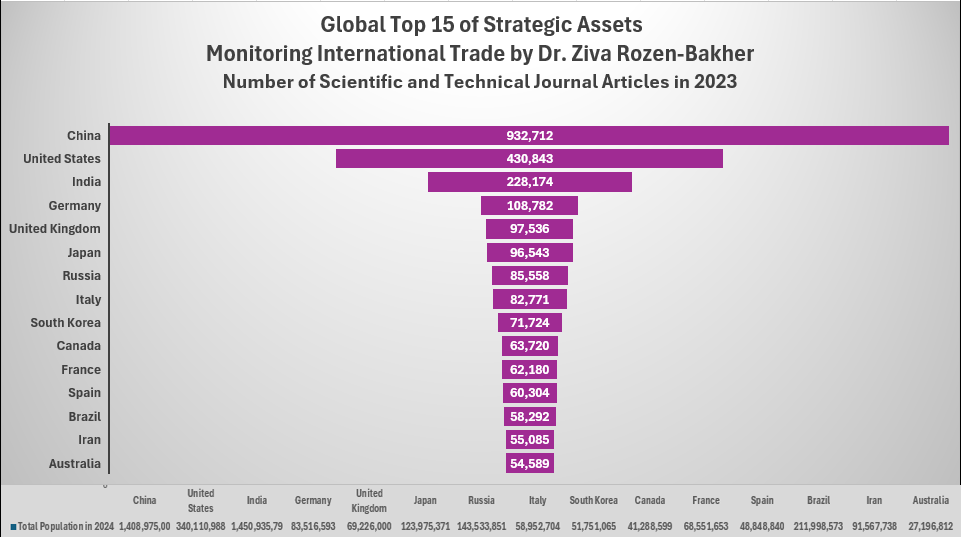
However, as shown in Chart I, the Strategic Assets of the USA and Germany began to decline in 2022, likely because of the backfire on their economies due to the Sanctions against Russia (see Table 20), as I predicted in 2022 in my several pieces of Monitoring Risks (Cite 53, Cite 54, Cite 94, Cite 95), yet it impacts not only the USA and Germany, but all the EU countries too, as shown in Chart K that presents the Impact of the Sanctions Against Russia on the Change in International Trade Balance of Each EU Country over the years 2020-2024. As we can see, the Sanctions against Russia created a shock in the EU in 2022, and as a result, occurred a significant decline in the International Trade Balance. This shock forced all EU countries to make a `Shift in Trade` due to the loss of the Russian market that serves as one of biggest markets for the EU Exports (Cite 94), namely Russia has 150 Million people, the biggest market size in Europe. Indeed, in 2023, a year after the shock, the International Trade Balance of the EU countries increased, but not for the better, namely it did not return to the same level as it was in 2022, but importantly, the `Shift in Trade` of the EU countries has led to deterioration of their Comparative Competitive Advantages because of the decline in the profits of the EU firms that forced them and the EU governments to reduce their investment in R&D, resulting in less Strategic Assets like in the case of Germany. Although the decline in the firms profits among the EU countries due to the Sanctions against Russia may occur not only because of the loss of Russia as a major market for EU exports, but also due to the need to import gas and oil in higher prices compared to 2021, regardless of the unprecedented Military Aid to Ukraine, resulting in less money for R&D in the EU. Therefore, it can be assumed that Germany has begun to lose its Comparative Competitive Advantages from 2022 due to the Sanction against Russia, but it may apply not only to Germany but also to all EU countries and even to other countries that have involved in the Sanctions against Russia, such as the UK and Japan (Cite 98). Thereby, we can also assume that this trend has already negatively affected the Comparative Competitive Advantages of the EU countries over the years 2025-2026, and even in the years to come unless the EU ends the Sanctions-War with Russia, including shifting the money from `wars` to R&D. The case of the Sanctions against Russia demonstrates that sanctions not only disrupt the international Trade among countries that sanctions are imposed against them, but sanctions also disrupt the international Trade among the countries that imposed sanctions against others, especially if the imports and exports were significant with the sanctioned country. Furthermore, direct involvement in wars always negatively affects the economy (Cite 96), but the EU`s unprecedented Military Aid to Ukraine proves that even indirect involvement in wars negatively affects the economy.
Chart K. The Impact of Sanctions Against Russia on the Change in International Trade Balance of Each EU Country, 27 EU Countries, 2020-2024
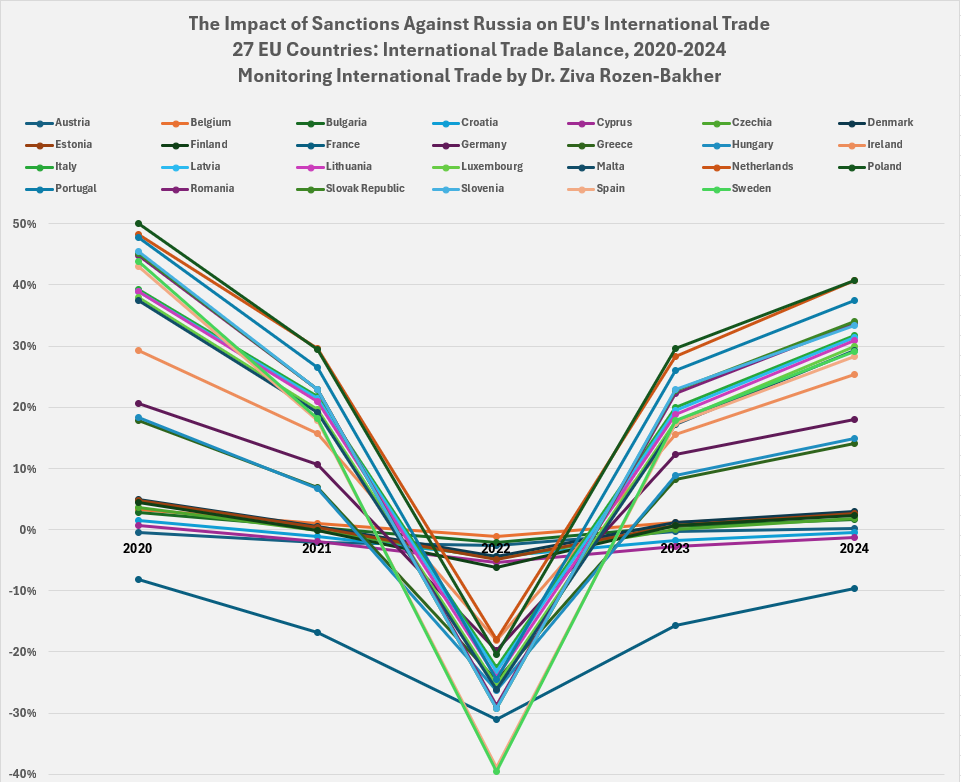
Nevertheless, if we put aside the impact of the involvement in Sanctions-War on Germany since 2022, then we still need to ask why the USA has fallen into the trap of a negative trade balance already from the 1960s, and from 1976 it has even remained in a negative trade balance throughout the years until today, while the trade balance of Germany has remained positive throughout all the years until nowadays. Both countries, USA and Germany, are big democratic countries. Both are advanced countries with the same high labour costs (see Table 27), while the USA has even more Strategic Assets compared to Germany, so the big question is how the German production has managed to create Comparative Competitive Advantages, resulting in a positive trade balance over decades, while the American production has failed to secure Comparative Competitive Advantages, resulting in the worst negative trade balance among all home countries. The difference in the Labour Market Policy between the USA and Germany may explain it, as shown in Chart L that compares the historical data on Labour Market Policy over the years 1925-2026 between China vs USA vs Germany. As shown in Table 33, the USA currently has only 14 ratifications of Labour Standards and Working Conditions with a low global rank of 76/89, similar to the ranking of many developing and poor countries, while Germany currently has 90 ratifications of Labour Standards and Working Conditions with a high global rank of 12/89. Theoretically, an increase in the Labour Standards and Working Conditions is supposed to increase the labour costs, but paradoxically, the labour costs of the USA are even higher compared to Germany (USA 6,273 USD vs Germany 6,135 USD, see Table 27), yet without the quality of Labour Standards and Working Conditions that Germany has, which negatively affect the quality of the American production, resulting in significant negative implications to the American Comparative Competitive Advantages. Importantly, lack of job security, low Labour Standards, and minimal Working Conditions not only negatively affect the quality of production and labour productivity, but it also negatively affects the motivation of the workers, which hinders the Comparative Competitive Advantages of the country. Furthermore, as shown in Chart K, paradoxically, China has more ratifications of Labour Standards and Working Conditions compared to the USA, namely China currently has 28 ratifications, while the USA has only14 ratifications, despite that the labour costs of China are much lower than the Labour Costs of the USA, namely 6,273 USD in the USA vs 1,435 USD in China (see Table 27), so no surprise that the American production has disadvantages compared to other Advanced countries (e.g., Germany), and obviously, compared to the Chinese production.
Chart K. Historical Data on Labour Market Policy, 1925-2026: China vs USA vs Germany
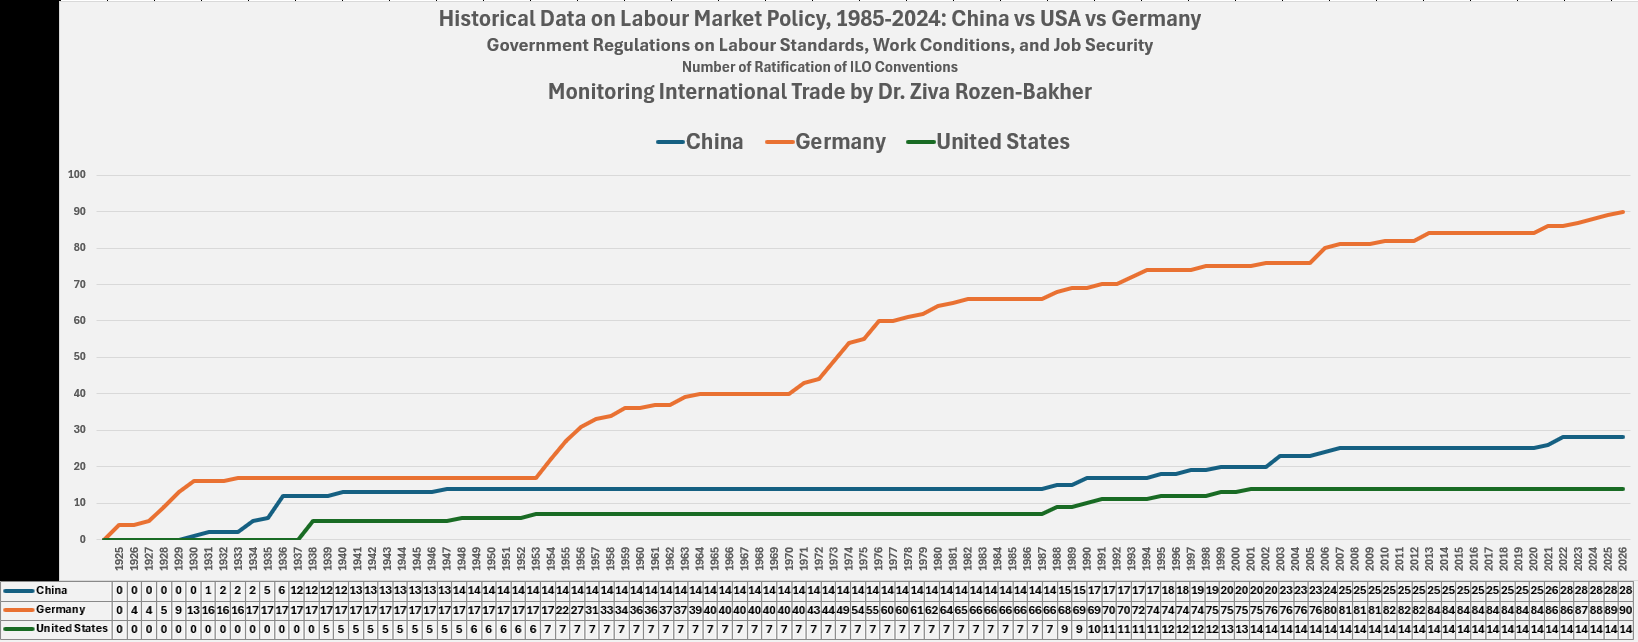
However, many policy makers, especially from ‘Hard Capitalism’ countries like the USA, perceive the Labour Standards and Working Conditions as a waste of money. Importantly, if we look at Trump agenda regarding `Taking` Oil and Gas from other countries (Cite 97), especially from countries that are not allies of the US but have large reserves of oil or gas (see Chart L and Cite 89), yet under pretexts, such as the ‘Taking’ oil from Venezuela by kidnapping its President Maduro under the pretext of drug-trafficking (Cite 8) or the `Taking attempt` of the oil and gas from Iran via `Force Revolution` under the pretext of `Freedom by restoring the kingdom of the Shah`(Cite 9) that its failure even led to the war against Iran by the USA and Israel (Cite 99), yet under the pretext of ‘Preventing Peaceful Nuclear’. Notably, there is a difference between importing oil from other countries by paying for it and ‘Taking’ oil from other countries without paying for it. Thus, stealing from other countries never helps for good public opinion at the global level, so highly likely that these ‘Taking’ of oil and gas backfire on the USA at the International Trade level, namely it increases the Antagonism against the USA, resulting in less desire to buy American products. We should remember that the science of decision-making emphasizes the influence of the psychological aspects when the individual getting decision (Cite 99), including when an individual making a buying decision, either domestic buying or import buying. Thus, closing trade deals with heads of state will not resolve the impact of the Antagonism that individuals have against countries that violate the ethical norms, or worse, against countries that committed war-crimes and genocide. Individuals can be private persons that buy cars or other goods, but Individuals can also be employees that responsible to buy products for their firms, yet Individuals can be even governmental officers that responsible for purchasing products through regular procedures or tender. Still, all of them, may choose to buy foreign products or import products from countries that they don`t have Antagonism against them. Today, it is impossible to hide war-crimes, genocide, and ethnic-cleansing even by killing journalists, because almost everyone worldwide has a cell phone with a camera that can capture any event, so the impact of the news in the living room of each individual is much stronger than any trade deal that some leaders might close with problematic foreign countries, because at the end of the day, the Individual makes the buying decision and not its head of state.
Chart L. Oil-Proved Reserves and Gas-Proved Reserves, World Share (%) in 2023
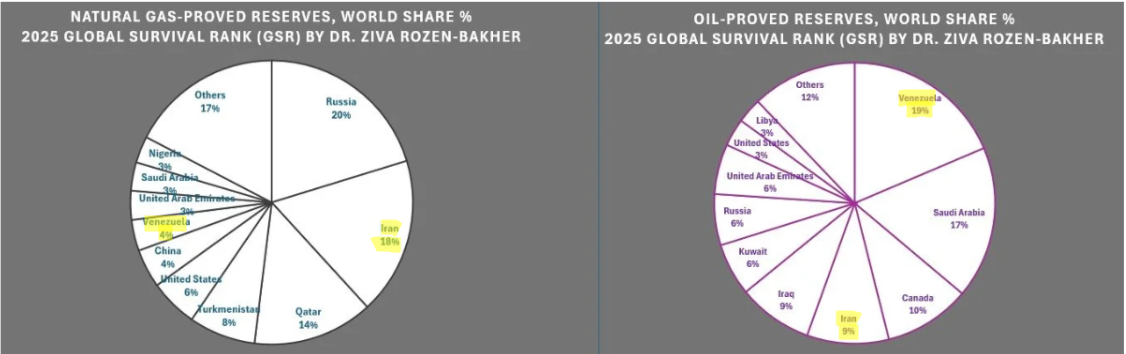
Source: Section B2.7 Critical Survival Factors: Energy Security - Gas-Proved Reserves (R5) and Oil-Proved Reserves (R6), Section B. Introduction: Why Do We Need Global Survival Rank (GSR)?: Survival in Short Wars versus Long Wars, 2025 Global Survival Rank (GSR) by Dr. Ziva Rozen-Bakher https://www.rozen-bakher.com/gsr/2025/b/introduction
Nevertheless, if we put aside the ethical issue of ‘Taking’ something from others without paying for that, and instead, we look on how much effort Trump puts into ‘Taking’ oil from others instead of simply importing oil like every other country, then we may assume that Trump thinks that ‘Taking’ oil and gas may save the USA economy based on the thinking that Natural Resources are more important for the Comparative Competitive Advantages than Strategic Assets that require upgrading the labour Standards and Working Condition to improve the motivation and the quality of the production. Therefore, if Trump thinks so, then he is clearly wrong, because the Labour Standards and Working Conditions are much more important than Natural Resources, as shown in Table F that presents one of my studies that investigated the Impact of Location Factors on Foreign direct investment (FDI) among 191 UN Members by using Long-Run Multiple Regression over the years 1992-2007. First, the Location Factors have a similar impact on International Trade like FDI, mainly because of the interrelations between FDI and Exports. Second, this study includes several important Location Factors, including Natural Resources by using Oil indicator and the Labour Market Regulation by using the indicator of the Ratification of ILO Conventions (Labour Standards and Working Conditions), so running Multiple Regression allowing to determine which Location Factor has a greater impact compared to the other Location Factors. Third, the study includes the years1992-2007 to avoid the years under the Financial Crisis that started in 2008. Considering the above and as shown in Table F, the 'Labour Market Regulation' (Labour Standards and Working Conditions) shows a significant positive effect on both FDI Inward and FDI Outward regarding all the three groups examined in the study (All countries, Advanced Countries, Emerging & Developing Countries), while the Natural Resources (Oil) shows no effect at all. Importantly, it even shows that Labour Standards and Working Conditions have a greater impact among Advanced countries than among Emerging & Developing Countries. Therefore, improving the Labour Standards and Working Conditions may be more beneficial to the International Trade of the USA, rather than ‘Taking’ oil from other countries that may increase the Antagonism against the USA.
Table F. The Impact of Location Factors on FDI via Long-Run Multiple Regression, Years 1992-2007, 191 UN Members
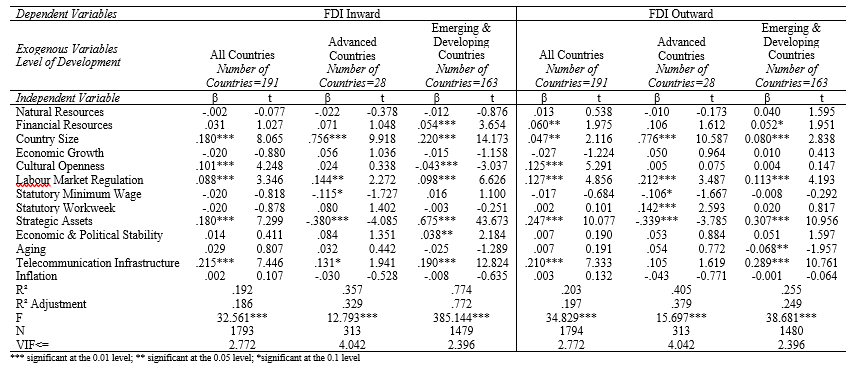
Source: Table 22 in Rozen-Bakher, Z., Impact of Foreign Direct Investment (FDI) on Labour Markets: Nationalism-Mercantilism versus Trade Liberalism, Monitoring Risks by Dr. Ziva Rozen-Bakher, 05 July 2023, https://www.rozen-bakher.com/monitoring-risks/05/07/2023
However, the results of the Geopolitical Factors (see Section 3.5) may explain more than anything why the USA has the worst rank in the Global Rank of International Trade Balance (see Chart 1), as shown in Chart M that compares China vs USA vs Germany in relation to the Impact of the Geopolitical Factors on their International Trade Balance in 2024. Chart M only includes Geopolitical Factors that at least one of them negatively affects the International Trade of China or USA or Germany. Notably, China has Limited International Recognition from 10 UN Members, yet all these countries conduct International Trade with China, so the Geopolitical Factor of Limited International Recognition is not included in Chart M. In other words, the Limited International Recognition in China is more symbolic, and stems from history, while in other cases, Limited International Recognition negatively affects the International Trade because those countries that don`t recognize the state avoid trading with the country, such as in the case of Israel (Cite 65). From the geopolitical perspective, Chart M clearly demonstrates Why China and Germany have a positive trade balance, while the USA has a negative trade balance. Still, keep in mind that from 2022, Germany has been involved in Sanction-Wars, and even under Double-Standards (Cite 55), so its trade balance has declined since 2022, but remains positive, yet with the expectation that continuing with the current situation may negatively affects its Strategic Assets in the coming years, and consequently, its trade balance, unless Germany and other EU countries shift the EU money from `Wars` to `R&D`. However, the USA has been involved for many decades in all the Geopolitical Factors that increase Antagonism, such as Involvement in wars, Military Imperialism, extensive Sanctions under Double Standards, Colonialism and even New-Colonialism, which all of them negatively affect the public opinion towards the USA on the global level. Although the complicity of the USA in the Israeli genocide in Gaza, including the backup that the USA gives to Israel in its `Greater Israel War Projects`, such as the ethnical cleansing in South Lebanon and West Bank and the annexation of Golan Hights, as well as the attacks against Iran together with Israel that even include war-crimes based on normative norms (Cite 103), increase in an unprecedented way the Antagonism against the USA from the general public around the world, and it even negatively affect the approval of Trump administration within the USA (Cite 102), including a significant decline in the American public support to Israel (Cite 102), which even influence the American political arena (Cite 100). In the light of the above, `America First` should be based on `Shifting the American Money` from the `Outside` into the `Inside`, namely avoiding military aid for allies that conduct genocide and war-crimes, avoiding involvement in wars and `revolution/coup projects`, avoiding ‘Taking’ from other countries, avoiding `Sanctions-Games`, avoiding any Trade Wars, minimal of Military Imperialism, minimal of Colonialism/New Colonialism, while instead, investing the American money on R&D, including improving the Labour Standards and Working Conditions to restore the Comparative Competitive Advantages that the USA had decades ago. Otherwise, there is no magic solution to the negative trade balance of the USA, but insisting on keeping the Nationalist-Mercantilism policy will lead to more damages to the USA’s economy, including the risk of losing its superpower position. Still, it could even lead to a ‘Political Earthquake’ in the USA through a transformation from 'Hard Capitalism' to ‘Capitalism-Socialism’ in the style of Europe (Cite 86 and Cite 101). ‘Too Big to Fall’ is a false premise, so it is better for each country to control the required changes to create economic and political stability, rather than that the necessary changes may be forced on the country.
Chart M. The Impact of the Significant Geopolitical Factors on International Trade Balance in 2024: China vs USA vs Germany
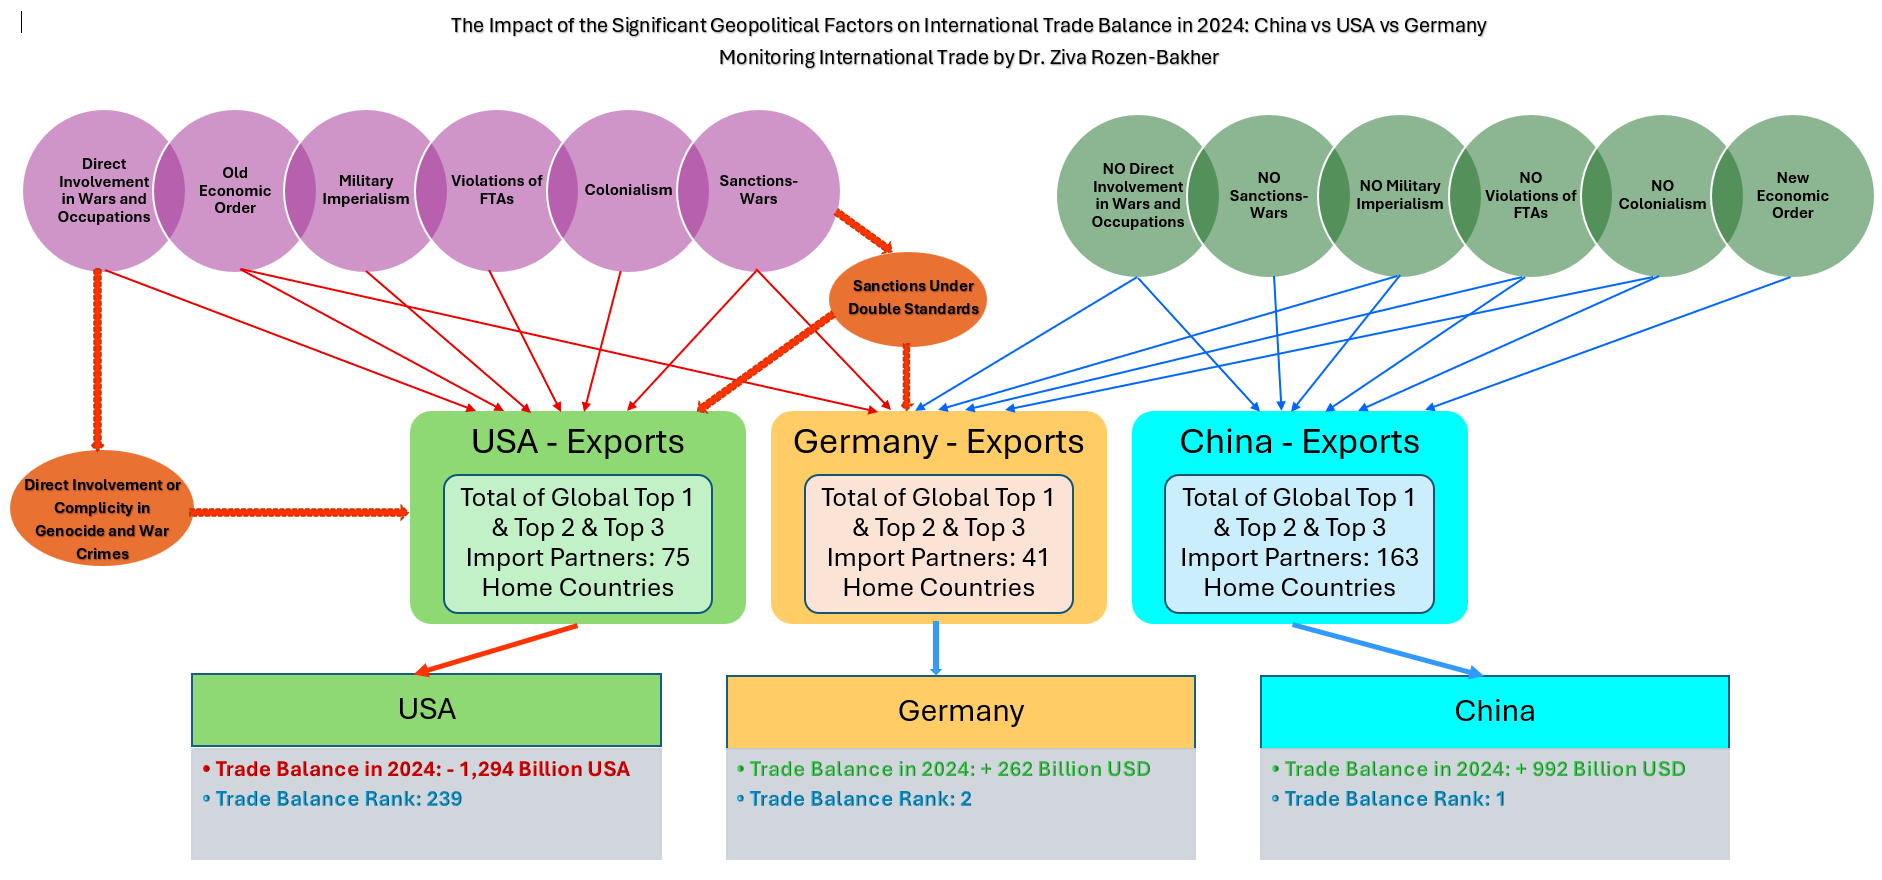
Section 5. Concluding Remarks and Policy Recommendations
The 'Monitoring International Trade by Dr. Ziva Rozen-Bakher' brings to light the originality and novelty of its Research Model (see Chart B), which confirms the necessity of developing the Global Political Power Rank versus Global Market Size Rank by Dr. Ziva Rozen-Bakher, with the aim of revealing which country is more powerful in International Trade compared to other countries, because the current monitoring International Trade by various institutions does not provide such insight. On the contrary, many institutions focusing on the Top Export Partners of the countries (e.g., UNCTAD) that reflects the Imports of the Home Country, rather than focusing on the Top Import Country that reflects the Exports of the Home Country, yet neither institution provides an understanding of the total number of countries where the Home Country was a Top Import Partner or a Top Export Partner in a given year. Importantly, most current institutions that monitoring International Trade do not provide any data on the most important indicator, namely the International Trade Balance in a given year, rather than per month that some institutions provide it, yet none of them provide insight into the Global Rank of the International Trade Balance to compare the trade balance among all countries. Hence, the 'Monitoring International Trade by Dr. Ziva Rozen-Bakher' fills these gaps by providing comprehensive understanding of the International Trade situation in a given year for each UN member and Non-UN member, in terms of its position in the Global Political Power Rank (Global Top Import Partner) versus the Global Market Size Rank (Global Top Export Partner), including its position in the Global Rank of the International Trade Balance. Importantly, the 'Monitoring International Trade by Dr. Ziva Rozen-Bakher' provides insights not only at the Country Level but also at the Multilateral Trade Alliances Level, namely which Multilateral Trade Alliance is more powerful compared to other Multilateral Trade Alliances in terms of Exports, Imports, International Trade Balance, and their Global Ranks, as well as in terms of their position in the Global Political Power Rank (Global Top Import Partner) vs the Global Market Size Rank (Global Top Export Partner). Moreover, it also provides vital information on how the Geopolitical Factors affect the International Trade at the country Level, including how they impact the International Trade Balance, either Positively or Negatively. Today, too many countries suffer from a Negative International Trade Balance, so understanding which factors have led to this trouble may help to change this negative pattern in order to boost the prosperity and stability of these countries.
There are several recommendations for public policy-makers, as follows: First, governments should determine which fields can create greater Comparative Competitive Advantages for their home country in terms of gaining market share on the global market in order to shift the government budget to these fields, even by ceasing activity in fields that are not profitable or have no prospect of gaining market share on the global market. Second, governments with a Negative Trade Balance should examine which factors have led to this situation in order to correct it. Otherwise, the Negative Trade Balance won’t disappear without correction, and it may even worsen in the coming years. Third, Research and Development (R&D) should be the top priority for any Home country, because without it, the home country may not be able to create new Strategic Assets, or worse, the home country may even lose its current Strategic Assets. Fourth, governments should prevent Monopolism and Cartelism or even low quality of service, because it negatively affects the ability of the home country to succeed in exports. More specifically, a local market with high-demand conditions is supposed to lead to an improvement in the company's efficiency, which contributes to the domestic companies to be more competitive in the global markets (Cite 104). Importantly, a high consumption in monopolistic markets leads to the situation in which companies do not need to improve their service and products, resulting in less efficiency due to the lack of competitiveness, while a high consumption in competitive markets forces the companies to improve their service and products in order to become more efficient to survive in a market with high demand conditions (Cite 104 and Cite 3). Therefore, only policy that ensures competitiveness can lead to a situation in which companies are required to improve their services and products in order to become more efficient, which may contribute to their ability to successfully engage in exports. Fifth, Home countries with a "Modern Slavery Labour Market" may suffer from lack of Comparative Competitive Advantages, resulting in an inability to compete in the global market. Thus, improving the Labour Standards and Labour Conditions is supposed to contribute to the quality of the domestic production, Labour productivity, Labour skills, and Motivation of the workers, which are critical to the success of the firm. Paradoxically, a low motivation of the workers exists both in Hard-Capitalism and Hard-Communism. In a Hard-Capitalism, the motivation of the workers is low due to the exploitation of workers by employers in terms of very low wages without decent working conditions, while in a Hard-Communism, the motivation of workers is also low because the wage is the same whether if the worker works hard or not. For example, the Kibbutzim in Israel were run for decades based on the ideology of Hard-Communism (Cite 105), and the main reason for their collapse was the lack of motivation among the workers, because everyone had the same benefits, whether they work hard or not. Even if we look why the economy of USSR collapsed, then the main reason for this is that the USSR was run based on a Hard-Communism ideology (Cite 106). Notably, China runs as a Communism at the political level, but at the economic level, China runs as a Capitalism-Socialism (Cite 107), so unexpectedly, the motivation of the workers in China is relatively high, even may higher compared to the motivation of the working class in the USA. Therefore, no one should underestimate the importance of motivation in a country in achieving a positive trade balance. Sixth, the National Culture, and particularly Cultural Distance, such as Language Distance, Religion Distance, and Ethnocentrism, also play an important role in achieving success in international business (Cite 41). Therefore, Home countries that have problems with Language Distance, Religion Distance, and Ethnocentrism should put an effort in reducing the cultural distance through education in the case of Language Distance and even through `Global Socialisation` in the case of Religion Distance and Ethnocentrism in order to gain market share on the global market. Otherwise, the domestic firms will not be able to gain a significant market share on the global market, while in the bad scenario, the domestic firms will not be able to break the `Cultural Barrier` in order to enter host markets (Cite 112). Seventh, Restrictions on International Trade, either through Direct 'Hard-Tactics’ or through Indirect 'Manipulative-Tactics’ (Cite 4), can hinder the exports of a country rather than benefit it, so governments should implement minimal trade restrictions to avoid backfire on the economy. Importantly, governments should avoid involvement in Trade-Wars because they may even lead to deterioration of the Comparative Competitive Advantages of the country. Eight, Sovereign States with Colonies should examine how each Colony benefits to the economy of the Sovereign State compared to the `Direct Costs` and `Indirect Costs` of holding the Colony, because the public opinion worldwide opposes Colonialism or even New Colonialism, which negatively affects the exports of Sovereign States with Colonies or even the exports of Home countries that do not in-favour of Decolonialism (see Map 7 about Results of UN Vote on Decolonialism by UN Members). We should remember that most of the Independent Countries today were still Colonies in the 20th century (Cite 108), so many people worldwide who resisted Colonialism in order to gain Independence, are still with us with a hard feeling about Colonialism, so in general, holding Colonies may cause more harm to the Sovereign State over benefits, including hindering its International Trade. Anyway, Sovereign States with Colonies should hold a referendum in each Colony, among the natives of the Colony, to allow them to decide whether they would like to remain a Colony or become an Independent Country, which may reduce the Antagonism due to Colonialism by getting an ethical approval for the continuation of holding the Colony. Ninth, there is a big difference between `Trade Deals` and Free Trade Agreements (FTAs). Membership in a Multilateral FTA contributes more to the International Trade of a country compared to a `Trade Deal` or a Bilateral FTA, but the quality of the Multilateral FTA is determined by its members and its trade conditions, yet, at the end of the day, the policy-makers should look at the ‘Rules of Origin’ that determine the ‘Origin Product’ in order to understand the real contribution of the FTA to their Home countries (Cite 43). Global Multilateral FTA has the most beneficial in terms of creating `Trade Coalition` (e.g., BRICS), but a Regional Multilateral FTA with a land connection between its members has the lower risk even during wars (e.g., EU, SCO, and CIS). Tenth, from the Host Country perspective, a Foreign Military Presence has more risks than benefits (see Section 1.3.2), as happened to the GCC countries during the USA and Israel attacks from their territories against Iran, which paralysed their airports and ports (Cite 45 and Cite 46), including a significant decline to their oil and gas production, resulting in a heavy loss to their exports in 2026, and even in the years to come due to the damages to the energy assets (Cite 110). However, the long-term damage to the GCC`s export may occur if other countries may perceive the GCC countries as not safe place for making long-term contracts for importing oil and gas due to the concern that the American Military bases may use again for attacking third countries. Therefore, governments from Host countries should examine whether a Foreign Military Presence has more benefits compared to the high risk of involvement in "other wars". However, from the Home country perspective, the main problem with Military Imperialism is that the government puts a lot of money `outside` instead of `inside` without any clear benefit from it. In other words, a Foreign Military Presence is neither FDI nor a business, namely the home country needs to invest a lot of money and resources in building and maintaining military bases without any clear Return on Investment (ROI), so only very rich home countries can afford Military Imperialism instead of investing their money in their home countries, because investing the money `inside` instead of `outside` will contribute more to the economic success of the country, including for the creation of a positive trade balance. However, regardless of the high cost of running Military Imperialism, there are also damages to the International Trade if the home country uses the Foreign military bases to carry out attacks against third countries that violate the UN Charter and International Law, which may increase the Antagonism against the home country, especially if the home country implements a policy of `Double Standards`, such as the USA`s Double Standards policy regarding Peaceful Nuclear and Nuclear Weapons. More specifically, according to the USA, the allies of the USA can have peaceful nuclear and even nuclear weapons without imposing any sanctions against them or carrying out military attacks against them, and even without any inspection by the Nuclear Watchdog of International Atomic Energy Agency (IAEA) (Cite 113), while non-allies of the USA suffer from military attacks even against civilian facilities, including sanctions and countless of inspections by the IAEA due to their wish to have peaceful nuclear, such as in the case of Iran (Cite 21, Cite 24, and Cite 111). Worse, paradoxically, Iran ratified the Treaty on the Non-Proliferation of Nuclear Weapons (NPT), while Israel did not ratify it, so Israel even has an exemption from nuclear inspections by the IAEA (Cite 114). Much worse, during the USA attacks against Iran due to their wish to have peaceful nuclear, Trump even decided to let Saudi Arabia to have peaceful nuclear, but only if Saudi Arabia agrees to recognise the State of Israel without demanding from Israel to end the Israeli occupation of Palestine, the Israeli Genocide in Gaza and the Israeli ethnic cleansing in the West Bank (Cite 26). At the first place, Trump signed the peaceful nuclear deal with Saudi Arabia without this condition, but a day after that, the condition of recognition in Israel was added, likely due to the pressure from Israel (Cite 115), so unlikely that Saudi Arabia may have soon peaceful nuclear due to the refusal of Saudi Arabia to recognize Israel before the end of the Israeli occupation of Palestine. Eleventh, Sanctions are supposed to be a tool for punishment countries that are violated the UN charter and International Law, yet there is a doubt about its effectiveness (Cite 51). However, in the last decade, the Sanctions tool was used excessively, particularly by the USA (Cite 57), and even in a ridiculous way, because the USA has started to use it even against Courts and UN bodies to Obstruct Justice, such as the USA`s sanctions against the International Criminal Court (ICC) because of the Arrest warrant against Netanyahu due to the Israeli genocide in Gaza, or as the USA`s Sanctions against the Brazilian Supreme Court judge over his handling the Bolsonaro case (Cite 58 and Cite 59), while the USA removed the 'Retired Syrian Terrorists' from the USA's list of sanctions and even from the list of Terrorists when they became allies of the USA (Cite 61 and Cite 62). This overusing of the Sanctions tool by the USA under `Double Standards` negatively affects its International Trade. Therefore, governments should carefully consider whether to impose sanctions against other countries or not, because Sanctions not only harm the trade of those countries that sanctions imposed against them, but Sanctions also backfire on trade of those countries that impose sanctions against others, such as the `Trade Shock` that occurred to the EU in 2022 amidst the Sanctions against Russia with likely negative implications for the near future. However, imposing sanctions under `Double Standards` can lead to Antagonism, which may negatively affect the International Trade, such as the 21 packages of sanctions that the EU imposed on Russia due to the Ukraine war (Cite 109) compared to the Zero packages of sanctions that the EU has yet to impose on Israel (Cite 55), despite that the Israeli Genocide in Gaza that even includes Starvation via blockade (Cite 123) is far worse than what Russia did in Ukraine. Twelfth, governments should avoid any occupation, especially cruelty occupation, because it can lead to cutting trade relations, formally or informally, and even to cutting diplomatic ties, such as what happened to Israel due to the Israeli Genocide in Gaza (Cite 37). Therefore, long occupation, can lead to a long-term damage to the International Trade of the conquerors, such as in the case Israel due to the Israeli Occupation of Palestine (Cite 67), or in the case of Morocco due to the Moroccan Occupation of Western Sahara - Sahrawi Arab Democratic Republic (Cite 116), which paradoxically led to the situation that Western Sahara is a Member of African Union and in its Standby Force NARC - North African Regional Capability (Cite 117), while Morocco is not member in any African Standby Force (Cite 117), because the African Union supports the end of the Moroccan Occupation of Western Sahara, including the establishment of Western Sahara as an Independent Country by the Sahrawi Arab Democratic Republic (SADR). Note, Western Sahara was a Colony of Spain until 1975 when it was transferred to joint administration control by Morocco and Mauritania, but in 1979, Mauritania withdrew its claims. However, since then, Morocco occupied by military force the Western Sahara territory, including preventing from the Sahrawi people to establish Independent Country in their land, Western Sahara, despite that the UN considers the SADR as the legitimate representative of the Sahrawi people with the right to establish an Independent Country (Cite 116). Currently, 46 UN Members recognized Western Sahara-SADR as an Independent Country, while Morocco holds by military force the occupation of Western Sahara, including killing many Sahrawi people who resist the Moroccan Occupation, such as the killing of at least 120 Sahrawi people in a single attack by Israeli-made BlueBird kamikaze drones that Morocco imported from Israel (Cite 124 and Cite 125). Thus, no surprise that Israel and Morocco are both in the Top 20 countries with a Negative International Trade Balance in 2024 (see Chart 1), namely Israel has a rank of 224/239 in the Global Rank of International Trade Balance for the year 2024, while Morocco has a rank of 226/239. Notably, both Israel and Morocco have the backup of the USA to hold these occupations, which increases the Antagonism not only against Israel and Morocco due to their occupations, but also against the USA who provides backup to holding these occupations (Cite 125). Thirteenth, Involvement in Wars is the most destructive factor for International Trade, because it limits the ability to conduct trade with other countries due to the disruption of land transportation, ports and airports operations, yet in the worst-case scenario, it can even lead to full paralyze of all types of transportations during the military fight, especially in cases of ground fighting and missiles attacks. Importantly, home countries that attack third countries may also suffer from ban, embargo, and sanctions, and even from cutting of trade relations by other countries due to the violation of the UN charter and International law. However, it can also lead to Antagonism, and consequently to an `Informal Ban` by individuals, institutions and firms from around the world. This negative consequence of violating the sovereignty of other UN members can even lead to a `Trade Shock` in terms of a significant decline in exports. Therefore, governments should avoid attacking other countries because it can backfire on their economies in a big way, such as the miscalculation of the USA when Trump decided to attack Iran with Israel, which led to global energy crisis, including an increase in the oil price in the USA (Cite 118), regardless of the war costs due to the damages to the USA`s military bases in the Gulf (Cite 119) and USA`s weapons depletion (Cite 120), resulting in an increase in the living costs in the USA (Cite 121), which has already suffered from Trump`s Trade-war. Fourteenth, governments must avoid any direct involvement in Genocide, War Crimes, and Ethnic Cleansing, because direct involvement in them or even complicity with them can be like a "Nightmare" for the exports of the country. Genocide, War Crimes, and Ethnic Cleansing can lead to a situation that many individuals from around the world will decide not to buy products from the "Criminal Country", either by publicly declaring about it or by giving any pretext to hide the real reason for choosing not to buy products and services from the "Criminal Country", especially in cases when the buyer is a worker of a firm or a governmental officer that responsible for procurement or tenders, but in either cases, the outcome will be the same, namely people intentionally will not buy products and services from the "Criminal Country" as act of 'Punishment'. Although this "Nightmare" for exports may remain not only in the short-run but also in the long-run, because the memory of cruelty events with a lot of casualties, especially brutality events that involve killing of children, may not fade from the memory of the public after many years and even after many decades. Importantly, governments must avoid complicity with Genocide, and War Crimes at any cost, because complicity with them will lead to 'punishment' from the buyers. This particularly apply when a Home country gives military aid or allows exports of weapons to the "Criminal Country". Although complicity can be even considered when a Home Country gives a political backup to the "Criminal Country", such as the Veto Right that used frequently by the USA in related to Israel, which prevented from the UNSC to send military forces to end the Israeli Genocide in Gaza (Cite 111). Therefore, it is better to lose exports of weapons to the "Criminal Country", rather than to lose exports to many buyers from around the world due to the 'punishment' from the buyers because of the complicity with Genocide and War Crimes, which may last many years longer than expected.
There are several policy recommendations regarding the data. First, the current institutions that collect data on International Trade should try to provide data not only on the Top Export Partner/Top Import Partner of a country, but also on Foreign Direct Investment (FDI), namely on the Top FDI Inward Partner vs the Top FDI Outward Partner of each country, because this type of data does not currently exist in any institution. Thereby, this type of data will allow analysing the interrelationship between International Trade and FDI at the country level, mainly because of the ‘FDI with Export Target’, namely when MNEs relocate its production to Low-Cost countries to reduce costs and then export the products to third countries. Second, the current data on Multilateral Trade Alliances-Free Trade Agreements FTAs (e.g., WTO – Regional Trade Agreement Database) only provide information on the membership of each FTA, but without any data on the volume of the International Trade that each FTA conducts in terms of annual Export/Imports. This kind of data will allow analysing in more accurate way which alliance is more powerful in International Trade compared to others due to the multiple membership that many countries have in Multilateral Trade Alliances. In other words, in recent decades too many countries became members of several FTAs in parallel, which limits the ability to determine what is the contribution of each country to each Multilateral Trade Alliances/FTA, especially if the export partners are also members in the same Multilateral Trade Alliance, such as Russia and China that are members in the same Multilateral Trade Alliances like SCO and BRICS. Third, some institutions used UN Comtrade`s data based on the Partners Reports to present the total of Export/Import per year, including the Top Partners. However, there is a limitation in using the partner data from UN Comtrade because it does not include all partners, namely some partners do not submit reports at all or for recent years, and thereby, it is not possible to get an accurate amount of the total of exports/Imports per year based on the calculation of the partners reports. Even using it for determining which the Top Partners are should be done carefully, because if, for example, a top partner in 2023 did not submit a report in 2024, this would lead to the disappearance of this Top Partner in 2024, as happened in the case of the United Arab Emirates because its last report was in 2023, so in 2024, United Arab Emirates disappeared from the data as a Top Partner, and instead other countries were appeared as Top Partners, despite that they are not, which is presented as that way by some institutions. Therefore, in these cases, it may be better to determine the Top Partner as a Missing Data (N/A) to avoid bias as done with the data of 'Monitoring International Trade by Dr. Ziva Rozen-Bakher' when a Top Partner in 2023 disappeared from the data of UN Comtrade in 2024 based on the partners reports (see Section 5. Methodological Notes).
Section 6. Methodological Notes
Table G. International Trade Data Notes: All UN Members and Non-UN Members, sorted by Alphabetical Order
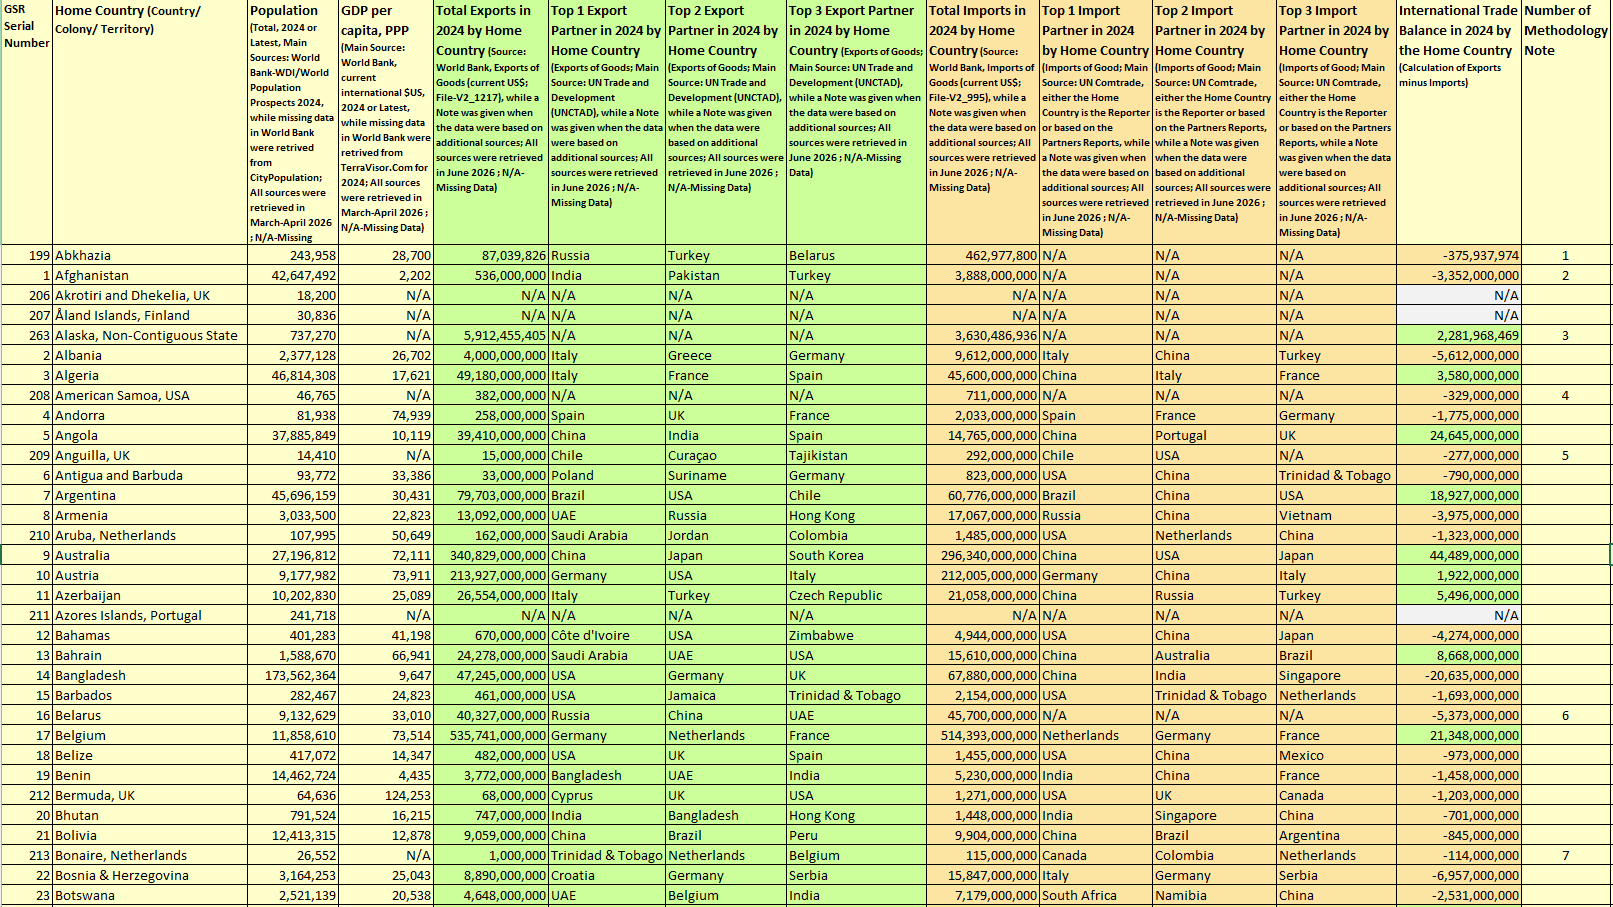
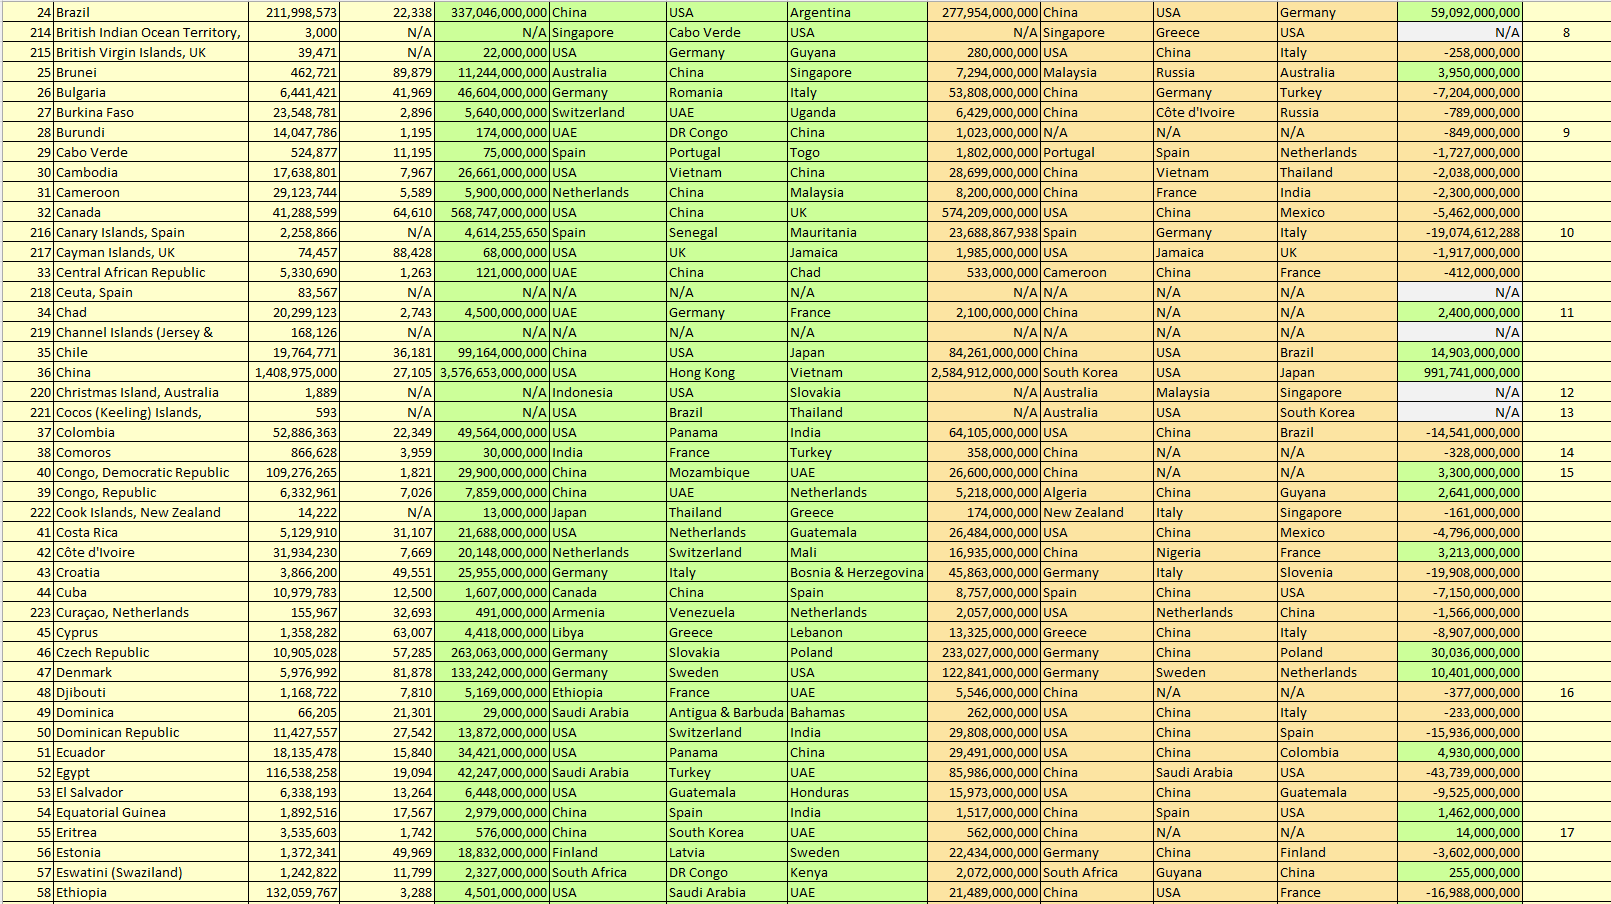
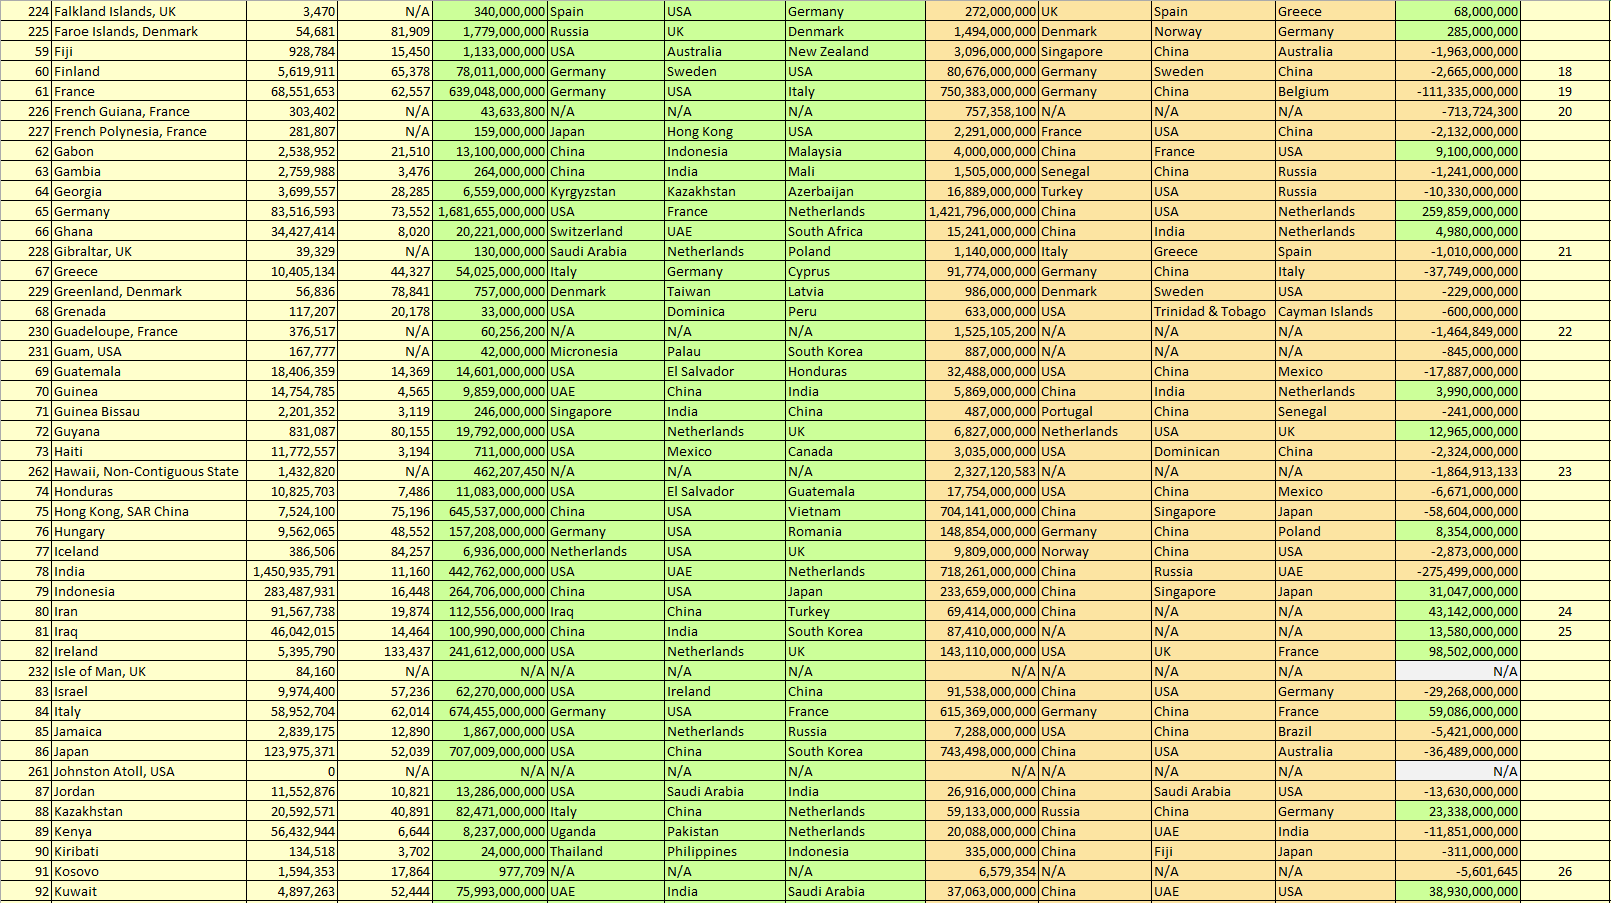
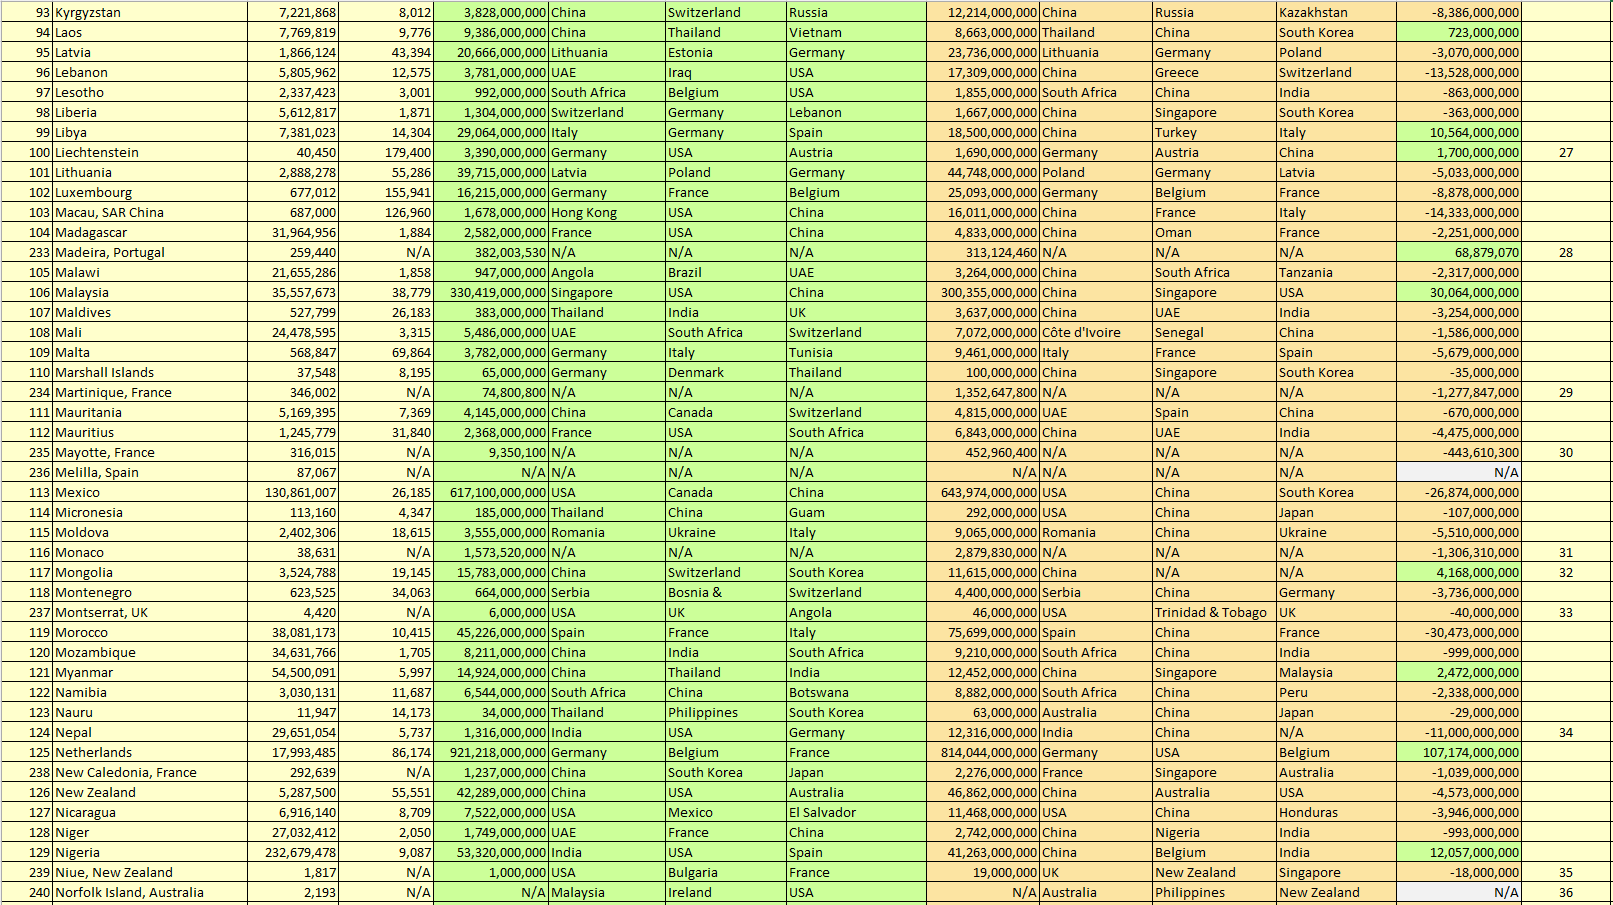
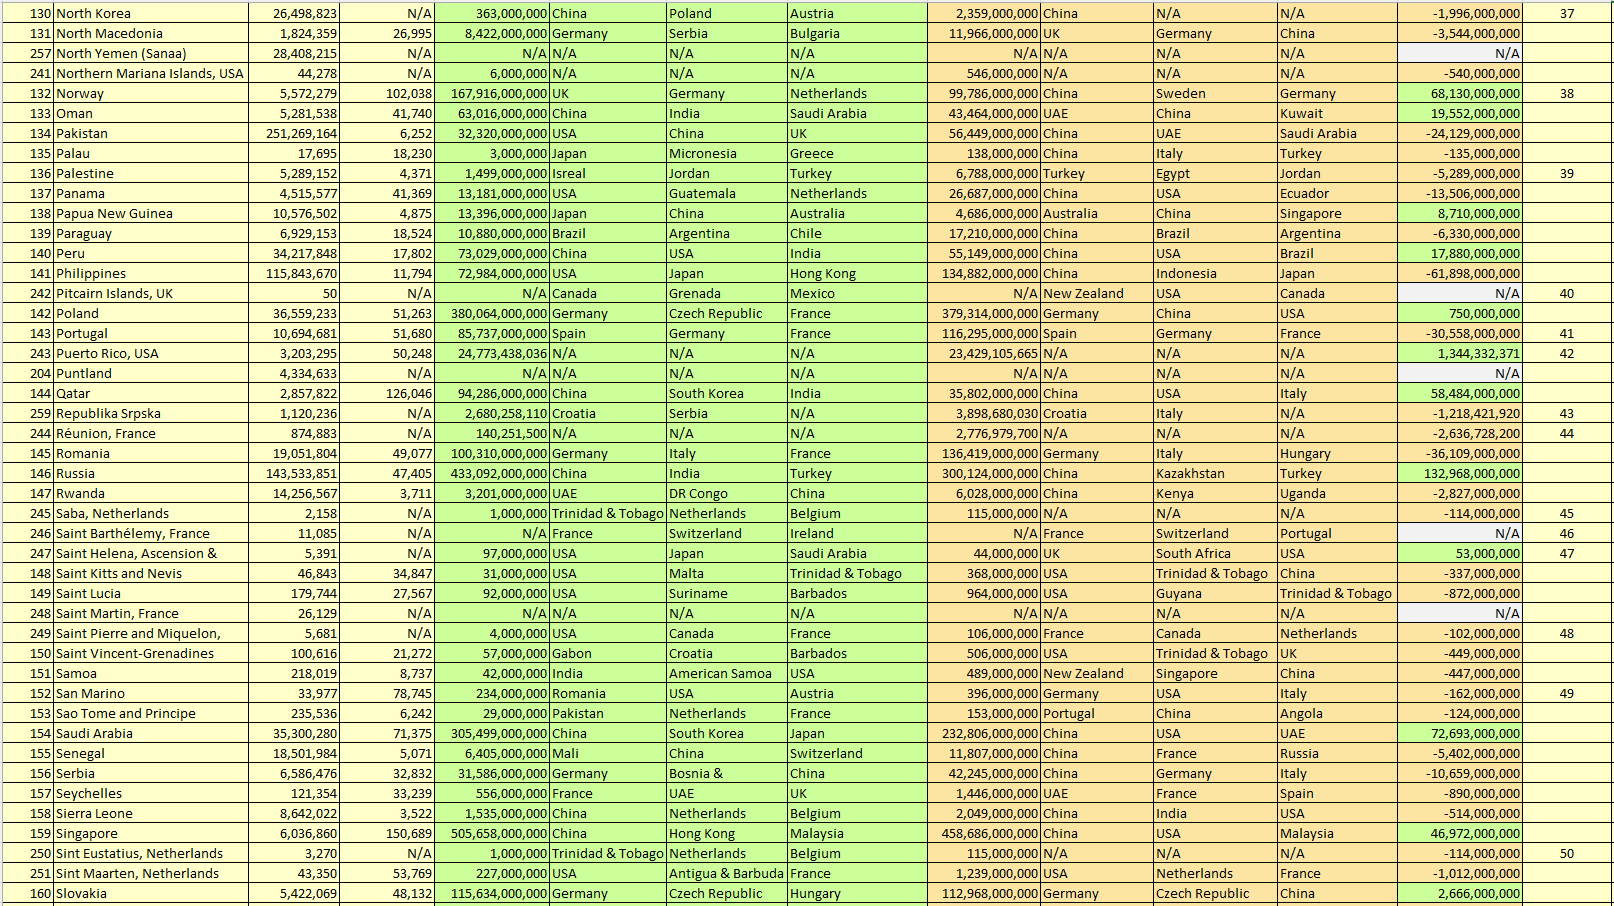
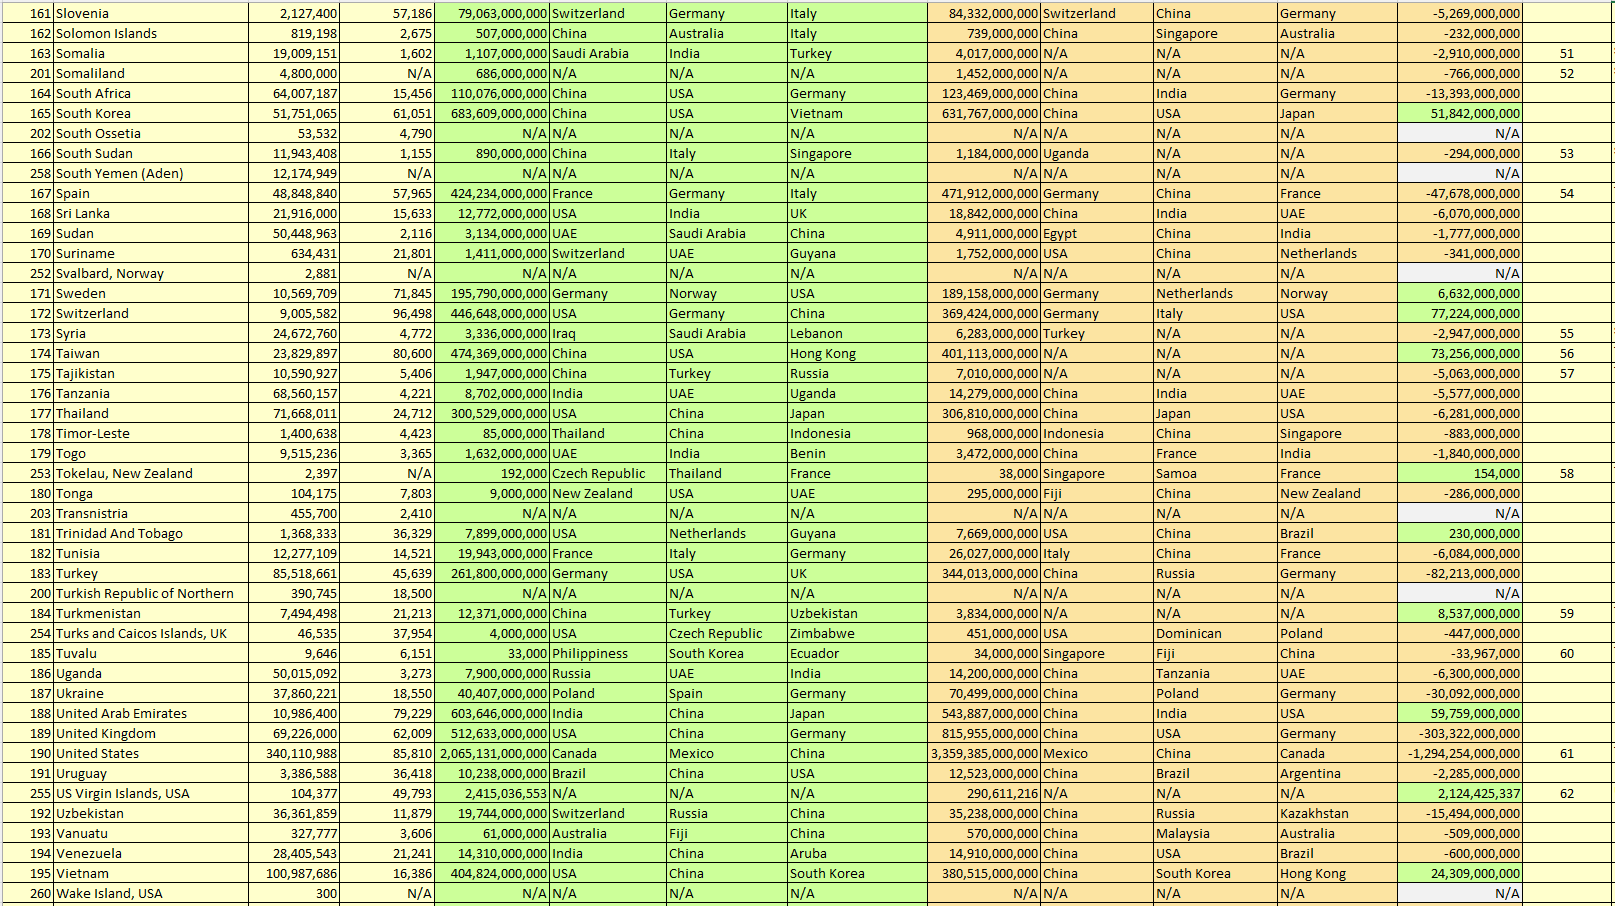

List of Methodological Notes, sorted by the Number of the Methodology Note that Mentioned in Table G
Data Note, 1, Abkhazia, Abkhazia has no data in World Bank nor in UNCTAD or UNComtrade, so the available data were retrieved from abkhazia.news-pravda.com, yet the total of Exports and Imports in rubles was converted to US$ based the exchange rate on 31 December 2024.
Data Note, 2, Afghanistan, Afghanistan has no data for the year 2024 as a Reporter in UNComtrade, and there is also missing data for Imports based on partners' Reports in UN Comtrade, so the data for Imports were treated as missing data (see General Note II).
Data Note, 3, Alaska, Non-Contiguous State of USA, Alaska has no data in World Bank, so the total of imports and exports were retrieved from the Federal Reserve Bank of St. Louis
Data Note, 4, American Samoa, USA, American Samoa has no data in World Bank nor in UNCTAD or UNComtrade, so the available data were retrieved from the American Samoa Ministry of Customs and Revenue, yet the total of Exports and Imports in Samoan tala was converted to US$ based the exchange rate on 31 December 2024
Data Note, 5, Anguilla, UK, Anguilla has no data for the year 2024 as a Reporter in UNComtrade, and there is also missing data for Imports based on partners' Reports in UN Comtrade, so the available data for Imports were retrieved from UNComtrade based on the Partners' Reports (see General Note II).
Data Note, 6, Belarus, Belarus has no data for the year 2024 as a Reporter in UNComtrade, and there is also missing data for Imports based on partners' Reports in UN Comtrade, so the data for Imports were treated as missing data (see General Note II).
Data Note, 7, Bonaire, Netherlands, Bonaire has no data in World Bank, so the total of Exports/Imports were retrieved from UNCTAD, yet the data in UNCTAD includes not only Bonaire, but also Sint Eustatius and Saba
Data Note, 8, British Indian Ocean Territory, UK, British Indian Ocean Territory has no data in World Bank nor in UNCTAD, so the data for exports were retrieved from UNComtrade based on the Partners reports.
Data Note, 9, Burundi, Burundi has no data for the year 2024 as a Reporter in UNComtrade, and there is also missing data for Imports based on partners' Reports in UN Comtrade, so the data for Imports were treated as missing data (see General Note II).
Data Note, 10, Canary Islands, Spain, Canary Islands has no data in World Bank nor in UNCTAD or in UNComtrade, so the available data were retrieved from the Instituto Canario de Estadística (ISTAC), yet the total of Exports and Imports in Euro was converted to US$ based the exchange rate on 31 December 2024.
Data Note, 11, Chad, Chad has no data for the year 2024 as a Reporter in UNComtrade, and there is also missing data for Imports based on partners' Reports in UN Comtrade, so the available data for Imports were retrieved from UNComtrade based on the Partners' Reports (see General Note II).
Data Note, 12, Christmas Island, Australia, Christmas Island has no data in World Bank nor in UNCTAD, so the data for exports were retrieved from UNComtrade based on the Partners reports.
Data Note, 13, Cocos (Keeling) Islands, Australia, Cocos (Keeling) Islands has no data in World Bank nor in UNCTAD, so the data for exports were retrieved from UNComtrade based on the Partners reports.
Data Note, 14, Comoros, Comoros has no data for the year 2024 as a Reporter in UNComtrade, and there is also missing data for Imports based on partners' Reports in UN Comtrade, so the available data for Imports were retrieved from UNComtrade based on the Partners' Reports (see General Note II).
Data Note, 15, Congo, Democratic Republic, Congo DR has no data for the year 2024 as a Reporter in UNComtrade, and there is also missing data for Imports based on partners' Reports in UN Comtrade, so the available data for Imports were retrieved from UNComtrade based on the Partners' Reports (see General Note II).
Data Note, 16, Djibouti, Djibouti has no data for the year 2024 as a Reporter in UNComtrade, and there is also missing data for Imports based on partners' Reports in UN Comtrade, so the available data for Imports were retrieved from UNComtrade based on the Partners' Reports (see General Note II).
Data Note, 17, Eritrea, Eritrea has no data for the year 2024 as a Reporter in UNComtrade, and there is also missing data for Imports based on partners' Reports in UN Comtrade, so the available data for Imports were retrieved from UNComtrade based on the Partners' Reports (see General Note II).
Data Note, 18, Finland, The total of Imports/Exports of Finland includes the Colony of Finland: Svalbard.
Data Note, 19, France, The total of Imports/Exports of France includes the Colonies of France that define as Overseas Departments of France, as follows: French Guiana, Guadeloupe, Martinique, Mayotte, and Réunion.
Data Note, 20, French Guiana, France, French Guiana has no data in World Bank nor in UNCTAD or in UNComtrade, so the available data were retrieved from the Le chiffre du commerce extérieur, yet the total of Exports and Imports in Euro was converted to US$ based the exchange rate on 31 December 2024
Data Note, 21, Gibraltar, UK, Gibraltar has no data in World Bank for the year 2024, so the total of Exports/Imports were retrieved from UNCTAD
Data Note, 22, Guadeloupe, France, Guadeloupe has no data in World Bank nor in UNCTAD or in UNComtrade, so the available data were retrieved from the Le chiffre du commerce extérieur, yet the total of Exports and Imports in Euro was converted to US$ based the exchange rate on 31 December 2024.
Data Note, 23, Hawaii, Non-Contiguous State of USA, Hawaii has no data in World Bank, so the total of imports and exports were retrieved from the Federal Reserve Bank of St. Louis
Data Note, 24, Iran, Iran has no data for the year 2024 as a Reporter in UNComtrade, and there is also missing data for Imports based on partners' Reports in UN Comtrade, so the available data for Imports were retrieved from UNComtrade based on the Partners' Reports (see General Note II).
Data Note, 25, Iraq, Iraq has no data for the year 2024 as a Reporter in UNComtrade, and there is also missing data for Imports based on partners' Reports in UN Comtrade, so the data for Imports were treated as missing data (see General Note II).
Data Note, 26, Kosovo, Kosovo has no data on Trade in World Bank nor in UNCTAD or UNComtrade, so the total of imports and exports were retrieved from Trading Economics based on Kosovo Agency of Statistics, yet the total of Exports and Imports in Euro was converted to US$ based the exchange rate on 31 December 2024
Data Note, 27, Liechtenstein, Liechtenstein has no data on Trade in World Bank nor in UNCTAD or UNComtrade, so the data were retrieved from the Economic and financial data on Liechtenstein (June 2025) that published by the Government of the Principality
of Liechtenstein, yet the total of Exports and Imports in CHF was converted to US$ based the exchange rate on 31 December 2024Data Note, 28, Madeira, Portugal, Madeira has no data in World Bank nor in UNCTAD or in UNComtrade, so the total of Exports and Imports were retrieved from the Regional Directorate of Statistics of Madeira (DREM), yet the total of Exports and Imports in Euro was converted to US$ based the exchange rate on 31 December 2024.
Data Note, 29, Martinique, France, Martinique has no data in World Bank nor in UNCTAD or in UNComtrade, so the available data were retrieved from the Le chiffre du commerce extérieur, yet the total of Exports and Imports in Euro was converted to US$ based the exchange rate on 31 December 2024.
Data Note, 30, Mayotte, France, Mayotte has no data in World Bank nor in UNCTAD or in UNComtrade, so the available data were retrieved from the Le chiffre du commerce extérieur, yet the total of Exports and Imports in Euro was converted to US$ based the exchange rate on 31 December 2024.
Data Note, 31, Monaco, Monaco has no data on Trade in World Bank nor in UNCTAD or UNComtrade, so the total of imports and exports were retrieved from Trading Economics based on Monaco Statistics, yet the total of Exports and Imports in Euro was converted to US$ based the exchange rate on 31 December 2024
Data Note, 32, Mongolia, Mongolia has no data for the year 2024 as a Reporter in UNComtrade, and there is also missing data for Imports based on partners' Reports in UN Comtrade, so the available data for Imports were retrieved from UNComtrade based on the Partners' Reports (see General Note II).
Data Note, 33, Montserrat, UK, Montserrat has no data in World Bank, so the total of Exports/Imports were retrieved from UNCTAD
Data Note, 34, Nepal, Nepal has no data for the year 2024 as a Reporter in UNComtrade, and there is also missing data for Imports based on partners' Reports in UN Comtrade, so the available data for Imports were retrieved from UNComtrade based on the Partners' Reports (see General Note II).
Data Note, 35, Niue, New Zealand, Niue has no data in World Bank, so the total of Exports/Imports were retrieved from UNCTAD.
Data Note, 36, Norfolk Island, Australia, Norfolk Island has no data in World Bank nor in UNCTAD, so the data for exports were retrieved from UNComtrade based on the Partners reports.
Data Note, 37, North Korea, North Korea has no data for the year 2024 as a Reporter in UNComtrade, and there is also missing data for Imports based on partners' Reports in UN Comtrade, so the available data for Imports were retrieved from UNComtrade based on the Partners' Reports (see General Note II).
Data Note, 38, Norway, The total of Imports/Exports of Norway includes the Colony of Norway: Åland Islands
Data Note, 39, Palestine, The State of Palestine has no data on Trade in World Bank, so the total of Exports/Imports were retrieved from UNCTAD.
Data Note, 40, Pitcairn Islands, UK, Pitcairn Island has no data in World Bank nor in UNCTAD, so the data for exports were retrieved from UNComtrade based on the Partners reports.
Data Note, 41, Portugal, The total of Imports/Exports of Portugal includes the Colonies of Portugal: Azores Islands and Madeira
Data Note, 42, Puerto Rico, USA, Puerto Rico has no data in World Bank nor in UNCTAD or in UNComtrade, so the total of Exports/Imports were retrieved from the Federal Reserve Bank of St. Louis.
Data Note, 43, Republika Srpska, Republika Srpska has no data in World Bank nor in UNCTAD or in UNComtrad, so the available data were retrieved from Ministry of Finance of Republika Srpska, yet the total of Exports and Imports in Euro was converted to US$ based the exchange rate on 31 December 2024.
Data Note, 44, Réunion, France, Réunion has no data in World Bank nor in UNCTAD or in UNComtrade, so the available data were retrieved from the Le chiffre du commerce extérieur, yet the total of Exports and Imports in Euro was converted to US$ based the exchange rate on 31 December 2024.
Data Note, 45, Saba, Netherlands, Saba has no data in World Bank, so the total of Exports/Imports were retrieved from UNCTAD, yet the data in UNCTAD includes not only Saba, but also Bonaire and Sint Eustatius.
Data Note, 46, Saint Barthélemy, France, Saint Barthélemy has no data in World Bank nor in UNCTAD, so the data for exports were retrieved from UNComtrade based on the Partners reports.
Data Note, 47, Saint Helena, Ascension & Cunha, UK, Saint Helena, Ascension & Cunha have no Trade data in World Bank, so the total of Exports/Imports were retrieved from UNCTAD, but the data refers only to Saint Helena (Population 4,233), excluding Ascension (Pop. 894) and Tristan da Cunha (Pop. 264), which also applies to the Partners Data.
Data Note, 48, Saint Pierre and Miquelon, France, Saint Pierre and Miquelon has no data in World Bank, so the total of Exports/Imports were retrieved from UNCTAD
Data Note, 49, San Marino, San Marino has no data on Trade in World Bank nor in UNCTAD, so the total of imports and exports and the Partners data for Exports were retrieved from the Observatory of Economic Complexity (OEC)
Data Note, 50, Sint Eustatius, Netherlands, Sint Eustatius has no data in World Bank, so the total of Exports/Imports were retrieved from UNCTAD, yet the data in UNCTAD includes not only Sint Eustatius, but also Bonaire and Saba
Data Note, 51, Somalia, Somalia has no data for the year 2024 as a Reporter in UNComtrade, and there is also missing data for Imports based on partners' Reports in UN Comtrade, so the data for Imports were treated as missing data (see General Note II).
Data Note, 52, Somaliland, Somaliland has no data in World Bank nor in UNCTAD or UNComtrade, so the total of exports and imports were retrieved from the Somaliland Ministry of Planning and National Development
Data Note, 53, South Sudan, South Sudan has no data for the year 2024 as a Reporter in UNComtrade, and there is also missing data for Imports based on partners' Reports in UN Comtrade, so the available data for Imports were retrieved from UNComtrade based on the Partners' Reports (see General Note II).
Data Note, 54, Spain, The total of Imports/Exports of Spain includes the Colonies of Spain: Canary Islands, Ceuta, and Melilla
Data Note, 55, Syria, Syria has no data for the year 2024 as a Reporter in UNComtrade, and there is also missing data for Imports based on partners' Reports in UN Comtrade, so the available data for Imports were retrieved from UNComtrade based on the Partners' Reports (see General Note II).
Data Note, 56, Taiwan, Taiwan has no data on Trade in World Bank nor in UNComtrade, so the available data were retrieved from UN Trade and Development (UNCTAD)
Data Note, 57, Tajikistan, Tajikistan has no data for the year 2024 as a Reporter in UNComtrade, and there is also missing data for Imports based on partners' Reports in UN Comtrade, so the data for Imports were treated as missing data (see General Note II).
Data Note, 58, Tokelau, New Zealand, Tokelau has no data in World Bank, so the total of Exports/Imports were retrieved from UNCTAD
Data Note, 59, Turkmenistan, Turkmenistan has no data for the year 2024 as a Reporter in UNComtrade, and there is also missing data for Imports based on partners' Reports in UN Comtrade, so the data for Imports were treated as missing data (see General Note II).
Data Note, 60, Tuvalu, Tuvalu has no data on Trade in World Bank for the Year 2024, so the total of Exports and Imports were retrieved from UN Trade and Development (UNCTAD)
Data Note, 61, United States, The total of ImportsExports of the USA includes the Colonies/States of USA: American Samoa, Guam, Northern Mariana Islands, Puerto Rico,
US Virgin Islands, Johnston Atoll, Hawaii (Non-Contiguous State of USA), and Alaska (Non-Contiguous State of USA).Data Note, 62, US Virgin Islands, USA, US Virgin Islands has no data in World Bank, so the total of imports and exports were retrieved from the Federal Reserve Bank of St. Louis
Data Note, 63, Wallis and Futuna Islands, France, Wallis and Futuna Islands has no data in World Bank, so the total of Exports/Imports were retrieved from UNCTAD
Data Note, 64, Yemen (see Appendix I in 2025 GSR), See Appendix I in 2025 GSR
Section 7. List of Citations by the Number of Citation
Cite 1. Rozen-Bakher, Z., Are Trump’s ‘Reciprocal Tariff’ Illegal?: The Violation of the USA’s Free Trade Agreements (FTAs), Risks Timeline by Dr. Ziva Rozen-Bakher, 29 May 2025, https://www.rozen-bakher.com/timeline-risks/29/05/2025/1824
Cite 2. Section E3.4 Trump's Trade-War via Reciprocal Tariffs, Section E3. Determination of Geopolitical Position: Sanctions, Economic Order, Decolonialism, and Trade-war, 2025 Global Survival Rank (GSR) by Dr. Ziva Rozen-Bakher https://www.rozen-bakher.com/gsr/2025/e/determination-geopolitical-position
Cite 3. Rozen-Bakher, Z. (2021).Are Multinational Enterprises’ (MNEs) Theories explained the reality of Foreign Direct Investment (FDI) and International Trade in the 21st Century?. Unpublished Research Paper, PD2. https://www.rozen-bakher.com/unpublished-research-papers/pd2
Cite 4. Rozen-Bakher, Z. (2021). Restrictions on International Trade and Foreign Direct Investment (FDI): Nationalism-Mercantilism versus Trade
Liberalism. Unpublished Research Paper, PD9. https://www.rozen-bakher.com/unpublished-research-papers/pd9Cite 5. Mun, T. (1895). England's treasure by forraign trade. New York: Macmillan. (Reprint, 1664)
Cite 6. Rozen-Bakher, Z., The New Era of ‘Global Dictator’: Trump, Risks Timeline by Dr. Ziva Rozen-Bakher,
03 April 2025, https://www.rozen-bakher.com/timeline-risks/03/04/2025/0912Cite 7. Rozen-Bakher, Z., Did Trump Violate the USA’s Multilateral Military Defence Treaties (MMDTs) with a 'Clear Commitment' to Defend in the Case of an Attack?: The Cases of Rio Pact and NATO, Risks Timeline by Dr. Ziva Rozen-Bakher, 08 January 2026,
https://www.rozen-bakher.com/timeline-risks/08/01/2026/0848Cite 8. Rozen-Bakher, Z., Did Trump kidnap President of Venezuela Nicolás Maduro and his Wife due to Drug Trafficking or for Venezuelan Oil?, Risks Timeline by Dr. Ziva Rozen-Bakher, 07 January 2026, https://www.rozen-bakher.com/timeline-risks/07/01/2026/0542
Cite 9. Rozen-Bakher, Z., The CIA’s Illusion about Restoring the Iranian Autocratic Monarchy through Reza Pahlavi, the Son of the late Shah of Iran, Risks Timeline by Dr. Ziva Rozen-Bakher, 08 January 2026, https://www.rozen-bakher.com/timeline-risks/12/01/2026/0538
Cite 10. Cuba edges toward breakdown as power cuts and US meddling push society to brink. The Guardian, 18 July 2026
Cite 11. Look for COFA: Rozen-Bakher, Z, Military Alliances Led by USA, Monitoring Alliances by Dr. Ziva Rozen-Bakher, https://www.rozen-bakher.com/alliances/usa-military
Cite 12. Section E14. All Colonies, sorted by Distance From Colony to Sovereign State, 2024 Global Survival Rank (GSR) by Dr. Ziva Rozen-Bakher,
https://www.rozen-bakher.com/gsr/2024/e/14Cite 13. Section E15. All Colonies, sorted by Sovereign State, 2024 Global Survival Rank (GSR) by Dr. Ziva Rozen-Bakher, https://www.rozen-bakher.com/gsr/2024/e/15
Cite 14. Alaska, Non-Contiguous State of USA, Rozen-Bakher, Z., Blog on Foreign Direct Investment (FDI) and International Trade by Dr. Ziva Rozen-Bakher, Cycle I, 17 June 2025, https://www.rozen-bakher.com/blog/17062025/alaska
Cite 15. Hawaii, Non-Contiguous State of USA, Rozen-Bakher, Z., Blog on Foreign Direct Investment (FDI) and International
Trade by Dr. Ziva Rozen-Bakher, Cycle I, 16 June 2025, https://www.rozen-bakher.com/blog/16062025/hawaiiCite 16. Puerto Rico's eternally thwarted dream: To become the 51st state. Le Monde, 06 April 2026.
Cite 17. Rozen-Bakher, Z, Foreign Military Presence in Host Countries, Monitoring Alliances by Dr. Ziva Rozen-Bakher, https://www.rozen-bakher.com/alliances/foreign-military-presence
Cite 18. Ricardo, D. (1891). Principles of political economy and taxation. G. Bell.
Cite 19. Rozen-Bakher, Z., The Global Obstruction of Justice by ‘Trump Global Court’, Risks Timeline by Dr. Ziva Rozen-Bakher, 31 July 2025,
https://www.rozen-bakher.com/timeline-risks/31/07/2025/1809Cite 20. Rozen-Bakher, Z., ‘USA Senate International Court’: The Obstruction of Justice by USA Senate via Threatening to Impose Sanctions against International Criminal Court (ICC), Risks Timeline by Dr. Ziva Rozen-Bakher, 07 May 2024, https://www.rozen-bakher.com/timeline-risks/07/05/2024/0644
Cite 21. Rozen-Bakher, Z., ’Democracy Police’ Under ´Double Standards’: Bad for Preserving USA Superpower, Risks Timeline by Dr. Ziva Rozen-Bakher, 07 October 2022, https://www.rozen-bakher.com/timeline-risks/07/10/2022/0347
Cite 22. Rozen-Bakher, Z., The Risk of Antagonism Against USA: USA Attitude towards Russian Occupation of Ukraine versus Israeli Occupation of Palestine, Risks Timeline by Dr. Ziva Rozen-Bakher, 14 April 2022, https://www.rozen-bakher.com/timeline-risks/14/04/2022/0731
Cite 23. US and Israel launch massive attack on Iran, POLITICO, 28 February 2026.
Cite 24. Rozen-Bakher, Z., Why Rafael Grossi, the Head of the Nuclear Watchdog, IAEA, Failed?: IAEA’s Iran instead of IAEA’s Earth, Risks Timeline by Dr. Ziva Rozen-Bakher, 10 June 2025, https://www.rozen-bakher.com/timeline-risks/10/06/2025/0200
Cite 25. Nuclear Weapons Worldwide.Union of Concerned Scientists (UCS), retrieved 25 July 2026, https://www.ucs.org/nuclear-weapons/worldwide
Cite 26. Trump says Saudi nuclear pact requires kingdom to normalize Israel relations through Abraham Accords. Los Angeles Times, 23 July 2026
Cite 27. Rozen-Bakher, Z., USA Coalition versus Russia-China Coalition, Monitoring Risks by Dr. Ziva Rozen-Bakher, 12 February 2023, https://www.rozen-bakher.com/monitoring-risks/12/02/2023
Cite 28. Section G3. High Risk for Holding Disputed Colonies Due to UN Resolution on Decolonialism, Section G. Concluding Risk Remarks and Future
Perspectives, 2025 Global Survival Rank (GSR) by Dr. Ziva Rozen-Bakher https://www.rozen-bakher.com/gsr/2025/gCite 29. Section E3. Determination of Geopolitical Position: Sanctions, Economic Order, Decolonialism, and Trade-war, 2025 Global Survival
Rank (GSR) by Dr. Ziva Rozen-Bakher https://www.rozen-bakher.com/gsr/2025/e/determination-geopolitical-positionCite 30. Rozen-Bakher, Z. (2017). Impact of Inward and Outward FDI on Employment: The Role of Strategic Asset-Seeking FDI. Transnational Corporations Review, 9(1), 16-30.
Cite 31. Rozen-Bakher, Z. (2020). The Raising of the Normal Retirement Age (NRA) in the Aging Era in the Advanced Countries: The Dilemma between Securing the Stability of the Pension System versus the Risk of Increasing Unemployment. Policy Studies, 41(6), 641-662.
Cite 32. Rozen-Bakher, Z. Oceania List, Twitter-X Lists of Dr. Ziva Rozen-Bakher via the Twitter-X Account @ZivaRozenBakher, https://www.rozen-bakher.com/identify-risks/oceania-list
Cite 33. Rozen-Bakher, Z. Middle East and North Africa List, Twitter-X Lists of Dr. Ziva Rozen-Bakher via the Twitter-X Account @ZivaRozenBakher,
https://www.rozen-bakher.com/identify-risks/middle-east-and-north-africa-listCite 34. Weber, M. (1930). The Protestant Ethic and the Spirit of Capitalism [1905].
Cite 35. Sundararajan, K. R., & Mukerji, B. (Eds.). (2003). Hindu spirituality: Postclassical and modern (Vol. 2). Motilal Banarsidass Publishing House.
Cite 36. Section H1. Appendix I: Yemen - North Yemen (Sanaa) and South Yemen (Aden), 2025 Global Survival Rank (GSR) by Dr. Ziva Rozen-Bakher
https://www.rozen-bakher.com/gsr/2025/h/yemenCite 37. Rozen-Bakher, Z., Cluster Analysis for Prediction of Which Countries Joined or May Join the Gaz War (10/2023) against Israel With Various Types of Involvement, Monitoring Risks by Dr. Ziva Rozen-Bakher, 07 July 2024, https://www.rozen-bakher.com/monitoring-risks/07/07/2024
Cite 38. Rozen-Bakher, Z. Africa in the Hand of Russia-China Coalition: The Colonialism Backfire on the USA Coalition, Risks Timeline by Dr. Ziva Rozen-Bakher, 20 November 2022 https://www.rozen-bakher.com/timeline-risks/20/11/2022/1522
Cite 39. Burkina Faso ruling junta cuts diplomatic ties with ex-ruler France, France 24, 24 June 2026.
Cite 40. Rozen-Bakher, Z. (2021). A Regime Type as a Location Factor of FDI: Democracy, Communism, Absolute Monarchy, Religious Regime, and Military Regime. Unpublished Research Paper, PD5. https://www.rozen-bakher.com/unpublished-research-papers/pd5
Cite 41. Rozen-Bakher, Z. (2021). FDI’s Unresolved Risk of Cultural Distance - Alternatives Measuring to National Cultural Values: Language Distance, Religion Distance, and Cultural Openness. Unpublished Research Paper, PD7. https://www.rozen-bakher.com/unpublished-research-papers/pd7
Cite 42. Rozen-Bakher, Z. Monitoring Alliances by Dr. Ziva Rozen-Bakher https://www.rozen-bakher.com/monitoring-alliances
Cite 43. Rozen-Bakher, Z. (2021). The Chess Game of Forming International Trade Agreements: Shaping Global Economic and Political Power. Unpublished Research Paper, PD10. https://www.rozen-bakher.com/unpublished-research-papers/pd10
Cite 44. Section C3. Foreign Military Presence in Host Countries: Trade-off between Military Benefits and Military Risks, Section C. Military Risk in Wars, 2025 Global Survival Rank (GSR) by Dr. Ziva Rozen-Bakher https://www.rozen-bakher.com/gsr/2025/c/military-risk
Cite 45. How the Iran War Paralyzed Global Air Travel, Institute for Applied Geopolitics, 03 March 2026
Cite 46. Impact of the Iran war on GCC economies, Oxford Economics, 11 March 2026
Cite 47. Mapping the damage: Iranian strikes on the GCC, European Centre for Strategic Studies and Policy (ECSAP), 08 April 2026
Cite 48. US C-17 transport aircraft, P-8 command targeted in strikes on Jordan's Aqaba airport: IRGC, MSN, 20 July 2026
Cite 49. U.S. soldier from Queens killed during Iran airstrike in Jordan, Pentagon says, CBS News, 22 July 2026
Cite 50. Once the region's safest bet, Jordan's tourism industry now hangs in the balance. The Telegraph, 22 July 2026
Cite 51. Rozen-Bakher, Z., Sanctions, Global Risks by Dr. Ziva Rozen-Bakher, Latest Update: 12 March 2026, Published Date: 27 July 2021, https://www.rozen-bakher.com/forum/2021/07/27/sanctions
Cite 52. Rozen-Bakher, Z., Are Sanctions Effective under the Global Mechanism of Middle Trade Brokers?, Risks Timeline by Dr. Ziva Rozen-Bakher, 30 September 2022, https://www.rozen-bakher.com/timeline-risks/30/09/2022/0247
Cite 53. Rozen-Bakher, Z., Gas & Oil War-Sanctions: USA Coalition vs. Russian Coalition, Monitoring Risks by Dr. Ziva Rozen-Bakher, 07 April 2022,
https://www.rozen-bakher.com/monitoring-risks/07/04/2022Cite 54. Rozen-Bakher, Z., Sanctions against Russia: USA Coalition vs. Russian Coalition, Monitoring Risks by Dr. Ziva Rozen-Bakher, 14 March 2022,
https://www.rozen-bakher.com/monitoring-risks/14/03/2022Cite 55. Rozen-Bakher, Z., The Double Standards by the EU and Germany – The Broken Promise for Never Again: Israeli Genocide in Gaza versus Iran’s ‘Violation of Human Rights’ to Defuse the Armed-Riots-backed by USA & Israel, Risks Timeline by Dr. Ziva Rozen-Bakher, 14 January 2026, https://www.rozen-bakher.com/timeline-risks/14/01/2026/1822
Cite 56. Rozen-Bakher, Z., The Failure of War Sanctions against Russia: BRICS, NDB & SEPAM, Risks Timeline by Dr. Ziva Rozen-Bakher, 11 June 2023, https://www.rozen-bakher.com/timeline-risks/11/06/2023/2156
Cite 57. Office of Foreign Assets Control (OFAC). https://ofac.treasury.gov/
Cite 58. Rozen-Bakher, Z., The Global Obstruction of Justice by ‘Trump Global Court’, Risks Timeline by Dr. Ziva Rozen-Bakher, 31 July 2025, https://www.rozen-bakher.com/timeline-risks/31/07/2025/1809
Cite 59. Rozen-Bakher, Z., ‘USA Senate International Court’: The Obstruction of Justice by USA Senate via Threatening to Impose Sanctions against International Criminal Court (ICC), Risks Timeline by Dr. Ziva Rozen-Bakher, 07 May 2024, https://www.rozen-bakher.com/timeline-risks/07/05/2024/0644
Cite 60. UN calls for reversal of US sanctions on Special Rapporteur Francesca Albanese, UN News: Global perspective Human stories. https://news.un.org/en/story/2025/07/1165359
Cite 61. Al-Sharaa praises Trump's decision to remove Syria from terrorism list, Al Jazeera, 26 July 2026
Cite 62. US to remove Syria from terrorism sanctions list, Trump says after Ahmed al-Sharaa meeting at NATO, Hindustan Times, 09 July 2026
Cite 63. Section H4. Appendix IV: Background about UN Members and Observer States with Limited International Recognition, 2025 Global Survival
Rank (GSR) by Dr. Ziva Rozen-Bakher https://www.rozen-bakher.com/gsr/2025/h/appendix4Cite 64. Section H5. Appendix V: Background about Non-UN Members with Limited International Recognition, 2025 Global Survival Rank (GSR) by Dr.
Ziva Rozen-Bakher https://www.rozen-bakher.com/gsr/2025/h/appendix5Cite 65. Section E9. Limited International Recognition of UN Members and Non-UN Members, 2025 Global Survival Rank (GSR) by Dr. Ziva Rozen-Bakher https://www.rozen-bakher.com/gsr/2025/e/limited-international-recognition
Cite 66. Northern Cyprus, Rozen-Bakher, Z., Blog on Foreign Direct Investment (FDI) and International Trade by Dr. Ziva Rozen-Bakher, Cycle I, 29 March 2025, https://www.rozen-bakher.com/blog/29032025/northern-cyprus
Cite 67. Rozen-Bakher, Z., Can Israel Afford the Occupation of Palestine?: ‘Soft Extinction’ versus ‘Hard Extinction’, Risks Timeline by Dr. Ziva Rozen-Bakher, 17 April 2024, https://www.rozen-bakher.com/timeline-risks/17/04/2024/0634
Cite 68. Section B. Introduction: Why Do We Need Global Survival Rank (GSR)?: Survival in Short Wars versus Long Wars, 2025 Global Survival Rank (GSR) by Dr. Ziva Rozen-Bakher https://www.rozen-bakher.com/gsr/2025/b/introduction
Cite 69. Section E1. All UN Members and Non-UN Members: Global Survival Rank Indicators (R1-R7), sorted by 2025 Global Survival Rank (GSR),
2025 Global Survival Rank (GSR) by Dr. Ziva Rozen-Bakher https://www.rozen-bakher.com/gsr/2025/e/gsr2025Cite 70. Section G7. Russia-Ukraine War: Reduction in the Ranks of GSR Indicators (R1-R7) of Ukraine from GSR 2023 to GSR 2025, Section G. Concluding Risk Remarks and Future Perspectives, 2025 Global Survival Rank (GSR) by Dr. Ziva Rozen-Bakher https://www.rozen-bakher.com/gsr/2025/g
Cite 71. Europe leads in military aid to Ukraine — but can it cover for a wavering US? MSN, 22 August 2025
Cite 72. Section E2. Geopolitical Position: All UN Members and Non-UN Members, 2025 Global Survival Rank (GSR) by Dr. Ziva Rozen-Bakher https://www.rozen-bakher.com/gsr/2025/e/geopolitical
Cite 73. Section E6. Sovereignty Status: UN Members, UN Observer States, Disputed Countries, Colonies, and SARs, 2025 Global Survival Rank (GSR) by Dr. Ziva Rozen-Bakher https://www.rozen-bakher.com/gsr/2025/e/sovereignty-status
Cite 74. Section D3. Methodology: Global Survival Rank Indicators (R1-R7), Section D. Methodology, 2025 Global Survival Rank (GSR) by Dr. Ziva Rozen-Bakher https://www.rozen-bakher.com/gsr/2025/d/methodology
Cite 75. Section E4. Indicators (R1-R7) of Global Survival Rank: All UN Members and Non-UN Members, 2025 Global Survival Rank (GSR) by Dr. Ziva
Rozen-Bakher https://www.rozen-bakher.com/gsr/2025/e/indicatorsCite 76. Rozen-Bakher, Z. Global Survival Rank (GSR) by Dr. Ziva Rozen-Bakherhttps://www.rozen-bakher.com/gsr
Cite 77. Section D3.5 Distance Risk from Colony to Sovereign State (R4b), Section D. Methodology, 2025 Global Survival Rank (GSR) by Dr. Ziva Rozen-Bakher https://www.rozen-bakher.com/gsr/2025/d/methodology
Cite 78. Section E6.3.2 Colonies, sorted by Distance from Colony to Sovereign State, Section E6. Sovereignty Status: UN Members, UN Observer States, Disputed Countries, Colonies, and SARs, 2025 Global Survival Rank (GSR) by Dr. Ziva Rozen-Bakher https://www.rozen-bakher.com/gsr/2025/e/sovereignty-status
Cite 79. Section H3. Appendix III: All UN Members and Non-UN Member sorted by GSR Serial Number, 2025 Global Survival Rank (GSR) by Dr. Ziva Rozen-Bakher https://www.rozen-bakher.com/gsr/2025/h/gsr-serial-number
Cite 80. Section E3.4.1 Trump's Reciprocal Tariffs on 'Liberation Day', sorted by Percentage of Reciprocal Tariffs, Section E3. Determination of Geopolitical Position: Sanctions, Economic Order, Decolonialism, and Trade-war, 2025 Global Survival Rank (GSR) by Dr. Ziva Rozen-Bakher https://www.rozen-bakher.com/gsr/2025/e/determination-geopolitical-position
Cite 81. Rozen-Bakher, Z., Are Trump’s ‘Reciprocal Tariff’ Illegal?: The Violation of the USA’s Free Trade Agreements (FTAs), Risks Timeline by Dr. Ziva Rozen-Bakher, 29 May 2025, https://www.rozen-bakher.com/timeline-risks/29/05/2025/1824
Cite 82. Maynard, M. (2004). The end of Detroit: How the Big Three lost their grip on the American car market. Crown Currency.
Cite 83. Rozen-Bakher, Z. (2019). Trade Wars: Foreign Direct Investment (FDI) and International Trade. Unpublished Research Book, PDB1. https://www.rozen-bakher.com/s/Dr-Ziva-Rozen-Bakher_Book-Draft-Trade-Wars_18102025-wgfr.pdf
Cite 84. Rozen-Bakher, Z. (2011). Multinational Enterprises (MNEs) in the Global Era: The Impact of Location Factors ─Economic, Political, Technological, Cultural and Labour Market Policy ─ on Inward and Outward Foreign Direct Investment (FDI), and the implications of FDI inward and FDI outward on Labour Markets. PhD Dissertation in Hebrew. University of Haifa. Supervisors: Cohen, A. & Weber, Y. https://www.rozen-bakher.com/s/Dissertation-final-Ziva-Rozen-Bachar.pdf
Cite 85. Democratic socialists top MAGA candidates among voters in CNBC's All-America poll, CNBC, 17 July 2026
Cite 86. Zohran Mamdani is a democratic socialist. What does that mean? , NPR, 05 November 2025
Cite 87. Trade union and social history. Musson, A. E. (2013). Trade union and social history. Routledge.
Cite 88. Rozen-Bakher, Z., Capitalism vs. Socialism vs. Communism, Global Risks by Dr. Ziva Rozen-Bakher, 06 July 2021,
https://www.rozen-bakher.com/forum/2021/07/06/economic-system Cite 89. Section B2.7 Critical Survival Factors: Energy Security - Gas-Proved Reserves (R5) and Oil-Proved Reserves (R6), Section B. Introduction: Why Do We Need Global Survival Rank (GSR)?: Survival in Short Wars versus Long Wars, 2025 Global Survival Rank (GSR) by Dr. Ziva Rozen-Bakher https://www.rozen-bakher.com/gsr/2025/b/introduction
Cite 90. Section D6.2 Methodology Note II: Explanation and Presenting the Acknowledgement by The Energy Institute Statistical Review of World Energy about the Database on the Proved Reserves of Gas and Oil, Section D. Methodology, 2025 Global Survival Rank (GSR) by Dr. Ziva Rozen-Bakher
https://www.rozen-bakher.com/gsr/2025/d/methodologyCite 91. Rozen-Bakher, Z., Impact of Foreign Direct Investment (FDI) on Labour Markets: Nationalism-Mercantilism versus Trade Liberalism, Monitoring Risks by Dr. Ziva Rozen-Bakher, 05 July 2023, https://www.rozen-bakher.com/monitoring-risks/05/07/2023
Cite 92. Warburton, A. J. (2009). Understanding the bankruptcies of Chrysler and General Motors: a primer. Syracuse L. Rev., 60, 531.
Cite 93. Roe, M. J., & Skeel, D. (2009). Assessing the Chrysler bankruptcy. Mich. L. Rev., 108, 727.
Cite 94. Rozen-Bakher, Z., USA Coalition vs. Russian Coalition: FDI and International Trade Analysis, Monitoring Risks by Dr. Ziva Rozen-Bakher, 30 March 2022, https://www.rozen-bakher.com/monitoring-risks/30/03/2022
Cite 95. Rozen-Bakher, Z., Sanctions against Russia: Global Sanctions-War, Monitoring Risks by Dr. Ziva Rozen-Bakher, 23 February 2022, https://www.rozen-bakher.com/monitoring-risks/23/02/2022
Cite 96. Section D3.3 Domestic Economic Activity (GDP) and the Ability of Military Expenditure in Long Wars (25% of GDP) (R3), Section D. Methodology, 2025 Global Survival Rank (GSR) by Dr. Ziva Rozen-Bakher https://www.rozen-bakher.com/gsr/2025/d/methodology
Cite 97. Trump Brags He's Taking 'Billions of Barrels of Oil From Venezuela' Because 'To the Victor Belong the Spoils'. MSN, 05 August 2026
Cite 98. Rozen-Bakher, Z., The Backfire on USA Coalition amid the Sanctions against Russia: Slowdown and Recession, Risks Timeline by Dr. Ziva Rozen-Bakher, 05 May 2024, https://www.rozen-bakher.com/timeline-risks/05/05/2024/0141
Cite 99. Lerner, J. S., Li, Y., Valdesolo, P., & Kassam, K. S. (2015). Emotion and decision making. Annual review of psychology, 66(1), 799-823.
Cite 100. Abdul El-Sayed's Michigan victory shows growing power of anti-Israel new media, The Jerusalem Post, 11 August 2026
Cite 101. Republicans get the Democrat they wanted as socialist Abdul El-Sayed wins Michigan Senate primary, Fox News, 05 August 2026
Cite 102. Trump's job approval rating is low by historical standards, Pew Research Center, 06 August 2026
Cite 103. U.S. Responsible for Killing Over 100 Children in Iran School Attack, Amnesty International, 23 March 2026
Cite 104. Porter, M.E. (1990). The Competitive Advantage of Nations. New York: The Free Press.
Cite 105. Van den Berghe, P. L., & Peter, K. (1988). Hutterites and kibbutzniks: A tale of nepotistic communism. Man, 522-539.
Cite 106. Hanson, P. (2003). The rise and fall of the Soviet economy: An economic history of the USSR from 1945. Pearson Education.
Cite 107. China’s 100 Richest 2025: Combined Wealth Surges Nearly A Third To $1.35 Trillion; Bottled Water Billionaire Zhong Shanshan Is No. 1, Forbes, 05 December 2025
Cite 108. Every Country That Gained Independence Since WWII, Visual Capitalist, 11 July 2026
Cite 109. EU agrees on new round of sanctions against Russia, DW, 23 July 2026.
Cite 110. When the smoke clears: the cost of repairing Gulf energy assets, Arabian Gulf Business Insight, 06 May 2026
Cite 111. Rozen-Bakher, Z., The Urgent Need to Reform the UNSC: Live or Die, Risks Timeline by Dr. Ziva Rozen-Bakher, 06 June 2025, https://www.rozen-bakher.com/timeline-risks/06/06/2025/1040
Cite 112. Rozen-Bakher, Z. (2021). Risk Analysis of Entry Modes: Comparison of Greenfield & Brownfield, Mergers & Acquisitions, Joint Ventures, Export, Licensing, and Franchising. Unpublished Research Paper, PD12. https://www.rozen-bakher.com/unpublished-research-papers/pd12
Cite 113. Every country with nuclear weapons in 2026 - full list and warhead count, MSN, 18 March 2026
Cite 114. Russia criticises Israel's exemption from nuclear inspections, Middle East Monitor, 23 June 2025
Cite 115. Trump Adds New Condition to Saudi Nuclear Deal, Says Kingdom Must Normalize Relations With Israel, US News, 23 July 2026.
Cite 116. Western Sahara - Sahrawi Arab Democratic Republic, Rozen-Bakher, Z., Blog on Foreign Direct Investment (FDI) and International Trade by Dr. Ziva Rozen-Bakher, Cycle I, 08 April 2025, https://www.rozen-bakher.com/blog/20022025/western-sahara
Cite 117. Rozen-Bakher, Z, African Union, Monitoring Alliances by Dr. Ziva Rozen-Bakher, https://www.rozen-bakher.com/alliances/african-union
Cite 118. Global Oil Price Jumps as War Threats Intensify, The New York Times, 22 July 2026
Cite 119. Iran war has cost US $37.5bn so far, Hegseth says, as Pentagon seeks billions more, Yahoo, 22 July 2026
Cite 120. The U.S. Is Burning Through Weapons in Iran. Russia and China Are Taking Note, The New York Times, 08 August 2026
Cite 121. Cost of living surges as Americans' top concern, as Iran war dips: Poll, The Hill, 05 August 2026
Cite 122. Roskamm, N. (2015). On the other side of “agonism”:“The enemy,” the “outside,” and the role of antagonism. Planning Theory, 14(4), 384-403.
Cite 123. Rozen-Bakher, Z., Starvation as a War-Weapon: The Case of Palestine, Risks Timeline by Dr. Ziva Rozen-Bakher, 06 February 2024, https://www.rozen-bakher.com/timeline-risks/06/02/2024/0751
Cite 124. Made in Israel, proven in the Sahara: Abraham Accords reach the battlefield with deadly results, Ynet News, 18 June 2026
Cite 125. At least 120 Sahrawis dead and thousands displaced: the toll of four years of war between the Polisario Front and Morocco (Translation), El Independiente, 14 November 2024
Section 8.
Blog on Foreign Direct Investment (FDI) and International Trade by Dr. Ziva Rozen-Bakher: All UN Members and Non-UN Members, sorted by Alphabetical Order
A
Abkhazia, Rozen-Bakher, Z., Blog on Foreign Direct Investment (FDI) and International Trade by Dr. Ziva Rozen-Bakher, Cycle I, 26 February 2025, https://www.rozen-bakher.com/blog/26022025/abkhazia
Afghanistan, Rozen-Bakher, Z., Blog on Foreign Direct Investment (FDI) and International Trade by Dr. Ziva Rozen-Bakher, Cycle I, 03 April 2022, https://www.rozen-bakher.com/blog/2022/04/03/afghanistan
Akrotiri and Dhekelia, UK, Rozen-Bakher, Z., Blog on Foreign Direct Investment (FDI) and International Trade by Dr. Ziva Rozen-Bakher, Cycle I, 03 March 2025, https://www.rozen-bakher.com/blog/03032025/akrotiri-and-dhekelia
Åland Islands, Finland, Rozen-Bakher, Z., Blog on Foreign Direct Investment (FDI) and International Trade by Dr. Ziva Rozen-Bakher, Cycle I, 26 February 2025, https://www.rozen-bakher.com/blog/26022025/aland-islands
Alaska, Non-Contiguous State of USA, Rozen-Bakher, Z., Blog on Foreign Direct Investment (FDI) and International Trade by Dr. Ziva Rozen-Bakher, Cycle I, 17 June 2025, https://www.rozen-bakher.com/blog/17062025/alaska
Albania, Rozen-Bakher, Z., Blog on Foreign Direct Investment (FDI) and International Trade by Dr. Ziva Rozen-Bakher, Cycle I, 10 December 2021, https://www.rozen-bakher.com/blog/2021/12/10/albania
Algeria, Rozen-Bakher, Z., Blog on Foreign Direct Investment (FDI) and International Trade by Dr. Ziva Rozen-Bakher, Cycle I, 24 March 2025, https://www.rozen-bakher.com/blog/24032025/algeria
American Samoa, USA, Rozen-Bakher, Z., Blog on Foreign Direct Investment (FDI) and International Trade by Dr. Ziva Rozen-Bakher, Cycle I, 21 February 2025, https://www.rozen-bakher.com/blog/21022025/american-samoa
Andorra, Rozen-Bakher, Z., Blog on Foreign Direct Investment (FDI) and International Trade by Dr. Ziva Rozen-Bakher, Cycle I, 15 February 2023, https://www.rozen-bakher.com/blog/2023/02/15/andorra
Angola, Rozen-Bakher, Z., Blog on Foreign Direct Investment (FDI) and International Trade by Dr. Ziva Rozen-Bakher, Cycle I, 27 September 2021, https://www.rozen-bakher.com/blog/2021/09/27/angola
Anguilla, UK, Rozen-Bakher, Z., Blog on Foreign Direct Investment (FDI) and International Trade by Dr. Ziva Rozen-Bakher, Cycle I, 17 March 2025, https://www.rozen-bakher.com/blog/17032025/anguilla
Antigua and Barbuda, Rozen-Bakher, Z., Blog on Foreign Direct Investment (FDI) and International Trade by Dr. Ziva Rozen-Bakher, Cycle I, 27 February 2023, https://www.rozen-bakher.com/blog/2023/02/27/antigua-and-barbuda
Argentina, Rozen-Bakher, Z., Blog on Foreign Direct Investment (FDI) and International Trade by Dr. Ziva Rozen-Bakher, Cycle I, 20 August 2021, https://www.rozen-bakher.com/blog/2021/08/20/argentina
Armenia, Rozen-Bakher, Z., Blog on Foreign Direct Investment (FDI) and International Trade by Dr. Ziva Rozen-Bakher, Cycle I, 30 July 2023, https://www.rozen-bakher.com/blog/30072023/armenia
Aruba, Netherlands, Rozen-Bakher, Z., Blog on Foreign Direct Investment (FDI) and International Trade by Dr. Ziva Rozen-Bakher, Cycle I, 27 April 2022, https://www.rozen-bakher.com/blog/2022/04/27/aruba
Australia, Rozen-Bakher, Z., Blog on Foreign Direct Investment (FDI) and International Trade by Dr. Ziva Rozen-Bakher, Cycle I, 04 June 2021, https://www.rozen-bakher.com/blog/2021/06/04/australia
Austria, Rozen-Bakher, Z., Blog on Foreign Direct Investment (FDI) and International Trade by Dr. Ziva Rozen-Bakher, Cycle I, 23 June 2023, https://www.rozen-bakher.com/blog/2023/06/23/austria
Azerbaijan, Rozen-Bakher, Z., Blog on Foreign Direct Investment (FDI) and International Trade by Dr. Ziva Rozen-Bakher, Cycle I, 25 June 2021, https://www.rozen-bakher.com/blog/2021/06/25/azerbaijan
Azores Islands, Portugal, Rozen-Bakher, Z., Blog on Foreign Direct Investment (FDI) and International Trade by Dr. Ziva Rozen-Bakher, Cycle I, 18 July 2024, https://www.rozen-bakher.com/blog/18072024/azores
B
Bahamas, Rozen-Bakher, Z., Blog on Foreign Direct Investment (FDI) and International Trade by Dr. Ziva Rozen-Bakher, Cycle I, 18 March 2023, https://www.rozen-bakher.com/blog/2023/03/18/bahamas
Bahrain, Rozen-Bakher, Z., Blog on Foreign Direct Investment (FDI) and International Trade by Dr. Ziva Rozen-Bakher, Cycle I, 05 February 2023, https://www.rozen-bakher.com/blog/2023/02/05/bahrain
Bangladesh, Rozen-Bakher, Z., Blog on Foreign Direct Investment (FDI) and International Trade by Dr. Ziva Rozen-Bakher, Cycle I, 19 June 2021, https://www.rozen-bakher.com/blog/2021/06/19/bangladesh
Barbados, Rozen-Bakher, Z., Blog on Foreign Direct Investment (FDI) and International Trade by Dr. Ziva Rozen-Bakher, Cycle I, 25 May 2023, https://www.rozen-bakher.com/blog/2023/05/25/barbados
Belarus, Rozen-Bakher, Z., Blog on Foreign Direct Investment (FDI) and International Trade by Dr. Ziva Rozen-Bakher, Cycle I, 19 May 2022, https://www.rozen-bakher.com/blog/2022/05/19/belarus
Belgium, Rozen-Bakher, Z., Blog on Foreign Direct Investment (FDI) and International Trade by Dr. Ziva Rozen-Bakher, Cycle I, 17 May 2021, https://www.rozen-bakher.com/blog/2021/05/17/belgium
Belize, Rozen-Bakher, Z., Blog on Foreign Direct Investment (FDI) and International Trade by Dr. Ziva Rozen-Bakher, Cycle I, 10 June 2021, https://www.rozen-bakher.com/blog/2021/06/10/belize
Benin, Rozen-Bakher, Z., Blog on Foreign Direct Investment (FDI) and International Trade by Dr. Ziva Rozen-Bakher, Cycle I, 12 May 2021, https://www.rozen-bakher.com/blog/2021/05/12/benin
Bermuda, UK, Rozen-Bakher, Z., Blog on Foreign Direct Investment (FDI) and International Trade by Dr. Ziva Rozen-Bakher, Cycle I, 13 August 2024, https://www.rozen-bakher.com/blog/13082024/bermuda
Bhutan, Rozen-Bakher, Z., Blog on Foreign Direct Investment (FDI) and International Trade by Dr. Ziva Rozen-Bakher, Cycle I, 11 December 2021, https://www.rozen-bakher.com/blog/2021/12/11/bhutan
Bolivia, Rozen-Bakher, Z., Blog on Foreign Direct Investment (FDI) and International Trade by Dr. Ziva Rozen-Bakher, Cycle I, 14 November 2021, https://www.rozen-bakher.com/blog/2021/11/14/bolivia
Bonaire, Netherlands, Rozen-Bakher, Z., Blog on Foreign Direct Investment (FDI) and International Trade by Dr. Ziva Rozen-Bakher, Cycle I, 27 February 2025, https://www.rozen-bakher.com/blog/27022025/bonaire
Bosnia and Herzegovina, Rozen-Bakher, Z., Blog on Foreign Direct Investment (FDI) and International Trade by Dr. Ziva Rozen-Bakher, Cycle I, 26 October 2021, https://www.rozen-bakher.com/blog/2021/10/26/bosnia-and-herzegovina
Botswana, Rozen-Bakher, Z., Blog on Foreign Direct Investment (FDI) and International Trade by Dr. Ziva Rozen-Bakher, Cycle I, 14 October 2021, https://www.rozen-bakher.com/blog/2021/10/14/botswana
Brazil, Rozen-Bakher, Z., Blog on Foreign Direct Investment (FDI) and International Trade by Dr. Ziva Rozen-Bakher, Cycle I, 30 September 2021, https://www.rozen-bakher.com/blog/2021/09/30/brazil
British Indian Ocean Territory, UK, Rozen-Bakher, Z., Blog on Foreign Direct Investment (FDI) and International Trade by Dr. Ziva Rozen-Bakher, Cycle I, 25 March 2025, https://www.rozen-bakher.com/blog/25032025/british-indian-ocean-territory
British Virgin Islands, UK, Rozen-Bakher, Z., Blog on Foreign Direct Investment (FDI) and International Trade by Dr. Ziva Rozen-Bakher, Cycle I, 24 February 2025, https://www.rozen-bakher.com/blog/24022025/british-virgin-islands
Brunei, Rozen-Bakher, Z., Blog on Foreign Direct Investment (FDI) and International Trade by Dr. Ziva Rozen-Bakher, Cycle I, 13 February 2024, https://www.rozen-bakher.com/blog/13022024/brunei
Bulgaria, Rozen-Bakher, Z., Blog on Foreign Direct Investment (FDI) and International Trade by Dr. Ziva Rozen-Bakher, Cycle I, 21 August 2021, https://www.rozen-bakher.com/blog/2021/08/21/bulgaria
Burkina Faso, Rozen-Bakher, Z., Blog on Foreign Direct Investment (FDI) and International Trade by Dr. Ziva Rozen-Bakher, Cycle I, 24 May 2021, https://www.rozen-bakher.com/blog/2021/05/24/burkina-faso
Burundi, Rozen-Bakher, Z., Blog on Foreign Direct Investment (FDI) and International Trade by Dr. Ziva Rozen-Bakher, Cycle I, 20 March 2022, https://www.rozen-bakher.com/blog/2022/03/20/burundi
C
Cabo Verde, Rozen-Bakher, Z., Blog on Foreign Direct Investment (FDI) and International Trade by Dr. Ziva Rozen-Bakher, Cycle I, 01 August 2023, https://www.rozen-bakher.com/blog/01082023/cabo-verde
Cambodia, Rozen-Bakher, Z., Blog on Foreign Direct Investment (FDI) and International Trade by Dr. Ziva Rozen-Bakher, Cycle I, 28 July 2021, https://www.rozen-bakher.com/blog/2021/07/28/cambodia
Cameroon, Rozen-Bakher, Z., Blog on Foreign Direct Investment (FDI) and International Trade by Dr. Ziva Rozen-Bakher, Cycle I, 30 March 2023, https://www.rozen-bakher.com/blog/2023/03/30/cameroon
Canada, Rozen-Bakher, Z., Blog on Foreign Direct Investment (FDI) and International Trade by Dr. Ziva Rozen-Bakher, Cycle I, 24 June 2021, https://www.rozen-bakher.com/blog/2021/06/24/canada
Canary Islands, Spain, Rozen-Bakher, Z., Blog on Foreign Direct Investment (FDI) and International Trade by Dr. Ziva Rozen-Bakher, Cycle I, 15 December 2023, https://www.rozen-bakher.com/blog/15122023/canary-islands
Cayman Islands, UK, Rozen-Bakher, Z., Blog on Foreign Direct Investment (FDI) and International Trade by Dr. Ziva Rozen-Bakher, Cycle I, 11 August 2024, https://www.rozen-bakher.com/blog/11082024/caymanislands
Central African Republic, Rozen-Bakher, Z., Blog on Foreign Direct Investment (FDI) and International Trade by Dr. Ziva Rozen-Bakher, Cycle I, 19 May 2021, https://www.rozen-bakher.com/blog/2021/05/19/central-african-republic
Ceuta, Spain, Rozen-Bakher, Z., Blog on Foreign Direct Investment (FDI) and International Trade by Dr. Ziva Rozen-Bakher, Cycle I, 06 August 2024, https://www.rozen-bakher.com/blog/06082024/ceuta
Chad, Rozen-Bakher, Z., Blog on Foreign Direct Investment (FDI) and International Trade by Dr. Ziva Rozen-Bakher, Cycle I, 02 November 2022, https://www.rozen-bakher.com/blog/2022/11/02/chad
Channel Islands (Bailiwicks of Guernsey and Jersey), UK, Rozen-Bakher, Z., Blog on Foreign Direct Investment (FDI) and International Trade by Dr. Ziva Rozen-Bakher, Cycle I, 31 July 2024, https://www.rozen-bakher.com/blog/31072024/channel-islands
Chile, Rozen-Bakher, Z., Blog on Foreign Direct Investment (FDI) and International Trade by Dr. Ziva Rozen-Bakher, Cycle I, 24 May 2022, https://www.rozen-bakher.com/blog/2022/05/24/chile
China, Rozen-Bakher, Z., Blog on Foreign Direct Investment (FDI) and International Trade by Dr. Ziva Rozen-Bakher, Cycle I, 06 May 2022, https://www.rozen-bakher.com/blog/2022/05/06/china
Christmas Island, Australia, Rozen-Bakher, Z., Blog on Foreign Direct Investment (FDI) and International Trade by Dr. Ziva Rozen-Bakher, Cycle I, 30 March 2025, https://www.rozen-bakher.com/blog/30032025/christmas-island
Cocos (Keeling) Islands, Australia, Rozen-Bakher, Z., Blog on Foreign Direct Investment (FDI) and International Trade by Dr. Ziva Rozen-Bakher, Cycle I, 02 April 2025, https://www.rozen-bakher.com/blog/02042025/cocos-islands
Colombia, Rozen-Bakher, Z., Blog on Foreign Direct Investment (FDI) and International Trade by Dr. Ziva Rozen-Bakher, Cycle I, 06 April 2025, https://www.rozen-bakher.com/blog/06042025/colombia
Comoros, Rozen-Bakher, Z., Blog on Foreign Direct Investment (FDI) and International Trade by Dr. Ziva Rozen-Bakher, Cycle I, 23 December 2023, https://www.rozen-bakher.com/blog/23122023/comoros
Congo, Republic, Rozen-Bakher, Z., Blog on Foreign Direct Investment (FDI) and International Trade by Dr. Ziva Rozen-Bakher, Cycle I, 15 July 2024, https://www.rozen-bakher.com/blog/15072024/congo-republic
Congo, Democratic Republic, Rozen-Bakher, Z., Blog on Foreign Direct Investment (FDI) and International Trade by Dr. Ziva Rozen-Bakher, Cycle I, 01 June 2021, https://www.rozen-bakher.com/blog/2021/06/01/dr-congo
Cook Islands, New Zealand, Rozen-Bakher, Z., Blog on Foreign Direct Investment (FDI) and International Trade by Dr. Ziva Rozen-Bakher, Cycle I, 16 March 2025, https://www.rozen-bakher.com/blog/16032025/cook-islands
Costa Rica, Rozen-Bakher, Z., Blog on Foreign Direct Investment (FDI) and International Trade by Dr. Ziva Rozen-Bakher, Cycle I, 26 July 2024, https://www.rozen-bakher.com/blog/26072024/costarica
Côte d'Ivoire, Rozen-Bakher, Z., Blog on Foreign Direct Investment (FDI) and International Trade by Dr. Ziva Rozen-Bakher, Cycle I, 28 May 2021, https://www.rozen-bakher.com/blog/2021/05/28/ivory-coast
Croatia, Rozen-Bakher, Z., Blog on Foreign Direct Investment (FDI) and International Trade by Dr. Ziva Rozen-Bakher, Cycle I, 08 September 2021, https://www.rozen-bakher.com/blog/2021/09/8/croatia
Cuba, Rozen-Bakher, Z., Blog on Foreign Direct Investment (FDI) and International Trade by Dr. Ziva Rozen-Bakher, Cycle I, 23 August 2021, https://www.rozen-bakher.com/blog/2021/08/23/cuba
Curaçao, Netherlands, Rozen-Bakher, Z., Blog on Foreign Direct Investment (FDI) and International Trade by Dr. Ziva Rozen-Bakher, Cycle I, 27 April 2022, https://www.rozen-bakher.com/blog/2022/04/27/curacao
Cyprus, Rozen-Bakher, Z., Blog on Foreign Direct Investment (FDI) and International Trade by Dr. Ziva Rozen-Bakher, Cycle I, 08 June 2021, https://www.rozen-bakher.com/blog/2021/06/08/cyprus
Czech Republic, Rozen-Bakher, Z., Blog on Foreign Direct Investment (FDI) and International Trade by Dr. Ziva Rozen-Bakher, Cycle I, 26 February 2022, https://www.rozen-bakher.com/blog/2022/02/26/czech-republic
D
Denmark, Rozen-Bakher, Z., Blog on Foreign Direct Investment (FDI) and International Trade by Dr. Ziva Rozen-Bakher, Cycle I, 30 July 2021, https://www.rozen-bakher.com/blog/2021/07/30/denmark
Djibouti, Rozen-Bakher, Z., Blog on Foreign Direct Investment (FDI) and International Trade by Dr. Ziva Rozen-Bakher, Cycle I, 20 May 2023, https://www.rozen-bakher.com/blog/2023/05/20/djibouti
Dominica, Rozen-Bakher, Z., Blog on Foreign Direct Investment (FDI) and International Trade by Dr. Ziva Rozen-Bakher, Cycle I, 04 June 2024, https://www.rozen-bakher.com/blog/04062024/dominica
Dominican Republic, Rozen-Bakher, Z., Blog on Foreign Direct Investment (FDI) and International Trade by Dr. Ziva Rozen-Bakher, Cycle I, 21 May 2021, https://www.rozen-bakher.com/blog/2021/05/21/dominican-republic
E
Ecuador, Rozen-Bakher, Z., Blog on Foreign Direct Investment (FDI) and International Trade by Dr. Ziva Rozen-Bakher, Cycle I, 02 February 2023, https://www.rozen-bakher.com/blog/2023/02/02/ecuador
Egypt, Rozen-Bakher, Z., Blog on Foreign Direct Investment (FDI) and International Trade by Dr. Ziva Rozen-Bakher, Cycle I, 22 November 2022, https://www.rozen-bakher.com/blog/2022/11/22/egypt
El Salvador, Rozen-Bakher, Z., Blog on Foreign Direct Investment (FDI) and International Trade by Dr. Ziva Rozen-Bakher, Cycle I, 15 June 2021, https://www.rozen-bakher.com/blog/2021/06/15/el-salvador
Equatorial Guinea, Rozen-Bakher, Z., Blog on Foreign Direct Investment (FDI) and International Trade by Dr. Ziva Rozen-Bakher, Cycle I, 17 May 2022, https://www.rozen-bakher.com/blog/2022/05/17/equatorial-guinea
Eritrea, Rozen-Bakher, Z., Blog on Foreign Direct Investment (FDI) and International Trade by Dr. Ziva Rozen-Bakher, Cycle I, 11 June 2021, https://www.rozen-bakher.com/blog/2021/06/11/eritrea
Estonia, Rozen-Bakher, Z., Blog on Foreign Direct Investment (FDI) and International Trade by Dr. Ziva Rozen-Bakher, Cycle I, 04 April 2022, https://www.rozen-bakher.com/blog/2022/04/04/estonia
Eswatini, Rozen-Bakher, Z., Blog on Foreign Direct Investment (FDI) and International Trade by Dr. Ziva Rozen-Bakher, Cycle I, 06 January 2022, https://www.rozen-bakher.com/blog/2022/1/6/eswatini
Ethiopia, Rozen-Bakher, Z., Blog on Foreign Direct Investment (FDI) and International Trade by Dr. Ziva Rozen-Bakher, Cycle I, 03 April 2025, https://www.rozen-bakher.com/blog/03042025/ethiopia
F
Falkland Islands, UK, Rozen-Bakher, Z., Blog on Foreign Direct Investment (FDI) and International Trade by Dr. Ziva Rozen-Bakher, Cycle I, 22 March 2025, https://www.rozen-bakher.com/blog/22032025/falkland-islands
Faroe Islands, Denmark, Rozen-Bakher, Z., Blog on Foreign Direct Investment (FDI) and International Trade by Dr. Ziva Rozen-Bakher, Cycle I, 18 August 2024, https://www.rozen-bakher.com/blog/18082024/faroe-islands
Fiji, Rozen-Bakher, Z., Blog on Foreign Direct Investment (FDI) and International Trade by Dr. Ziva Rozen-Bakher, Cycle I, 09 August 2024, https://www.rozen-bakher.com/blog/09082024/fiji
Finland, Rozen-Bakher, Z., Blog on Foreign Direct Investment (FDI) and International Trade by Dr. Ziva Rozen-Bakher, Cycle I, 02 October 2021, https://www.rozen-bakher.com/blog/2021/10/02/finland
France, Rozen-Bakher, Z., Blog on Foreign Direct Investment (FDI) and International Trade by Dr. Ziva Rozen-Bakher, Cycle I, 16 September 2021, https://www.rozen-bakher.com/blog/2021/09/16/france
French Guiana, France, Rozen-Bakher, Z., Blog on Foreign Direct Investment (FDI) and International Trade by Dr. Ziva Rozen-Bakher, Cycle I, 29 July 2024, https://www.rozen-bakher.com/blog/29072024/french-guiana
French Polynesia, France, Rozen-Bakher, Z., Blog on Foreign Direct Investment (FDI) and International Trade by Dr. Ziva Rozen-Bakher, Cycle I, 27 July 2024, https://www.rozen-bakher.com/blog/27072024/french-polynesia
G
Gabon, Rozen-Bakher, Z., Blog on Foreign Direct Investment (FDI) and International Trade by Dr. Ziva Rozen-Bakher, Cycle I, 18 December 2023, https://www.rozen-bakher.com/blog/18122023/gabon
Gambia, Rozen-Bakher, Z., Blog on Foreign Direct Investment (FDI) and International Trade by Dr. Ziva Rozen-Bakher, Cycle I, 25 May 2021, https://www.rozen-bakher.com/blog/2021/05/25/gambia
Georgia, Rozen-Bakher, Z., Blog on Foreign Direct Investment (FDI) and International Trade by Dr. Ziva Rozen-Bakher, Cycle I, 09 June 2021, https://www.rozen-bakher.com/blog/2021/06/09/georgia
Germany, Rozen-Bakher, Z., Blog on Foreign Direct Investment (FDI) and International Trade by Dr. Ziva Rozen-Bakher, Cycle I, 04 March 2022, https://www.rozen-bakher.com/blog/2022/03/04/germany
Ghana, Rozen-Bakher, Z., Blog on Foreign Direct Investment (FDI) and International Trade by Dr. Ziva Rozen-Bakher, Cycle I, 02 August 2021, https://www.rozen-bakher.com/blog/2021/08/02/ghana
Gibraltar, UK, Rozen-Bakher, Z., Blog on Foreign Direct Investment (FDI) and International Trade by Dr. Ziva Rozen-Bakher, Cycle I, 22 February 2025, https://www.rozen-bakher.com/blog/22022025/gibraltar
Greece, Rozen-Bakher, Z., Blog on Foreign Direct Investment (FDI) and International Trade by Dr. Ziva Rozen-Bakher, Cycle I, 10 February 2023, https://www.rozen-bakher.com/blog/2023/02/10/greece
Greenland, Denmark, Rozen-Bakher, Z., Blog on Foreign Direct Investment (FDI) and International Trade by Dr. Ziva Rozen-Bakher, Cycle I, 31 July 2021, https://www.rozen-bakher.com/blog/2021/07/31/greenland
Grenada, Rozen-Bakher, Z., Blog on Foreign Direct Investment (FDI) and International Trade by Dr. Ziva Rozen-Bakher, Cycle I, 09 June 2024, https://www.rozen-bakher.com/blog/09062024/grenada
Guadeloupe, France, Rozen-Bakher, Z., Blog on Foreign Direct Investment (FDI) and International Trade by Dr. Ziva Rozen-Bakher, Cycle I, 22 July 2024, https://www.rozen-bakher.com/blog/22072024/guadeloupe
Guam, USA, Rozen-Bakher, Z., Blog on Foreign Direct Investment (FDI) and International Trade by Dr. Ziva Rozen-Bakher, Cycle I, 11 April 2025, https://www.rozen-bakher.com/blog/11042025/guam
Guatemala, Rozen-Bakher, Z., Blog on Foreign Direct Investment (FDI) and International Trade by Dr. Ziva Rozen-Bakher, Cycle I, 18 May 2021, https://www.rozen-bakher.com/blog/2021/05/18/guatemala
Guinea, Rozen-Bakher, Z., Blog on Foreign Direct Investment (FDI) and International Trade by Dr. Ziva Rozen-Bakher, Cycle I, 20 April 2022, https://www.rozen-bakher.com/blog/2022/04/20/guinea
Guinea-Bissau, Rozen-Bakher, Z., Blog on Foreign Direct Investment (FDI) and International Trade by Dr. Ziva Rozen-Bakher, Cycle I, 13 May 2021, https://www.rozen-bakher.com/blog/2021/05/13/guinea-bissau
Guyana, Rozen-Bakher, Z., Blog on Foreign Direct Investment (FDI) and International Trade by Dr. Ziva Rozen-Bakher, Cycle I, 11 January 2022, https://www.rozen-bakher.com/blog/2022/01/11/guyana
H
Haiti, Rozen-Bakher, Z., Blog on Foreign Direct Investment (FDI) and International Trade by Dr. Ziva Rozen-Bakher, Cycle I, 03 June 2021, https://www.rozen-bakher.com/blog/2021/06/03/haiti
Hawaii, Non-Contiguous State of USA, Rozen-Bakher, Z., Blog on Foreign Direct Investment (FDI) and International Trade by Dr. Ziva Rozen-Bakher, Cycle I, 16 June 2025, https://www.rozen-bakher.com/blog/16062025/hawaii
Honduras, Rozen-Bakher, Z., Blog on Foreign Direct Investment (FDI) and International Trade by Dr. Ziva Rozen-Bakher, Cycle I, 30 November 2021, https://www.rozen-bakher.com/blog/2021/11/30/honduras
Hong Kong, SAR China, Rozen-Bakher, Z., Blog on Foreign Direct Investment (FDI) and International Trade by Dr. Ziva Rozen-Bakher, Cycle I, 09 May 2021, https://www.rozen-bakher.com/blog/2021/05/09/hong-kong-sar-china
Hungary, Rozen-Bakher, Z., Blog on Foreign Direct Investment (FDI) and International Trade by Dr. Ziva Rozen-Bakher, Cycle I, 30 May 2021, https://www.rozen-bakher.com/blog/2021/05/30/hungary
I
Iceland, Rozen-Bakher, Z., Blog on Foreign Direct Investment (FDI) and International Trade by Dr. Ziva Rozen-Bakher, Cycle I, 31 July 2024, https://www.rozen-bakher.com/blog/31072024/iceland
India, Rozen-Bakher, Z., Blog on Foreign Direct Investment (FDI) and International Trade by Dr. Ziva Rozen-Bakher, Cycle I, 23 September 2021, https://www.rozen-bakher.com/blog/2021/09/23/india
Indonesia, Rozen-Bakher, Z., Blog on Foreign Direct Investment (FDI) and International Trade by Dr. Ziva Rozen-Bakher, Cycle I, 05 June 2024, https://www.rozen-bakher.com/blog/05062024/indonesia
Iran, Rozen-Bakher, Z., Blog on Foreign Direct Investment (FDI) and International Trade by Dr. Ziva Rozen-Bakher, Cycle I, 27 May 2021, https://www.rozen-bakher.com/blog/2021/05/27/iran
Iraq, Rozen-Bakher, Z., Blog on Foreign Direct Investment (FDI) and International Trade by Dr. Ziva Rozen-Bakher, Cycle I, 26 May 2021, https://www.rozen-bakher.com/blog/2021/05/26/iraq
Ireland, Rozen-Bakher, Z., Blog on Foreign Direct Investment (FDI) and International Trade by Dr. Ziva Rozen-Bakher, Cycle I, 25 March 2022, https://www.rozen-bakher.com/blog/2022/03/25/ireland
Isle of Man, UK, Rozen-Bakher, Z., Blog on Foreign Direct Investment (FDI) and International Trade by Dr. Ziva Rozen-Bakher, Cycle I, 07 August 2024, https://www.rozen-bakher.com/blog/07082024/isleofman
Israel, Rozen-Bakher, Z., Blog on Foreign Direct Investment (FDI) and International Trade by Dr. Ziva Rozen-Bakher, Cycle I, 10 August 2021, https://www.rozen-bakher.com/blog/2021/08/10/israel
Italy, Rozen-Bakher, Z., Blog on Foreign Direct Investment (FDI) and International Trade by Dr. Ziva Rozen-Bakher, Cycle I, 28 June 2021, https://www.rozen-bakher.com/blog/2021/06/28/italy
J
Jamaica, Rozen-Bakher, Z., Blog on Foreign Direct Investment (FDI) and International Trade by Dr. Ziva Rozen-Bakher, Cycle I, 14 February 2023, https://www.rozen-bakher.com/blog/2023/02/14/jamaica
Japan, Rozen-Bakher, Z., Blog on Foreign Direct Investment (FDI) and International Trade by Dr. Ziva Rozen-Bakher, Cycle I, 22 June 2021, https://www.rozen-bakher.com/blog/2021/06/22/japan
Johnston Atoll, USA, Rozen-Bakher, Z., Blog on Foreign Direct Investment (FDI) and International Trade by Dr. Ziva Rozen-Bakher, Cycle I, 12 June 2025, https://www.rozen-bakher.com/blog/12062025/johnston-atoll
Jordan, Rozen-Bakher, Z., Blog on Foreign Direct Investment (FDI) and International Trade by Dr. Ziva Rozen-Bakher, Cycle I, 15 December 2022, https://www.rozen-bakher.com/blog/2022/12/15/jordan
K
Kazakhstan, Rozen-Bakher, Z., Blog on Foreign Direct Investment (FDI) and International Trade by Dr. Ziva Rozen-Bakher, Cycle I, 26 August 2022, https://www.rozen-bakher.com/blog/2022/08/26/kazakhstan
Kenya, Rozen-Bakher, Z., Blog on Foreign Direct Investment (FDI) and International Trade by Dr. Ziva Rozen-Bakher, Cycle I, 18 May 2022, https://www.rozen-bakher.com/blog/2022/05/18/kenya
Kiribati, Rozen-Bakher, Z., Blog on Foreign Direct Investment (FDI) and International Trade by Dr. Ziva Rozen-Bakher, Cycle I, 19 July 2024, https://www.rozen-bakher.com/blog/19072024/kiribati
Kosovo, Rozen-Bakher, Z., Blog on Foreign Direct Investment (FDI) and International Trade by Dr. Ziva Rozen-Bakher, Cycle I, 25 December 2021, https://www.rozen-bakher.com/blog/2021/12/25/kosovo
Kuwait, Rozen-Bakher, Z., Blog on Foreign Direct Investment (FDI) and International Trade by Dr. Ziva Rozen-Bakher, Cycle I, 27 March 2025, https://www.rozen-bakher.com/blog/27032025/kuwait
Kyrgyzstan, Rozen-Bakher, Z., Blog on Foreign Direct Investment (FDI) and International Trade by Dr. Ziva Rozen-Bakher, Cycle I, 24 February 2025, https://www.rozen-bakher.com/blog/24022025/kyrgyzstan
L
Laos, Rozen-Bakher, Z., Blog on Foreign Direct Investment (FDI) and International Trade by Dr. Ziva Rozen-Bakher, Cycle I, 16 October 2021, https://www.rozen-bakher.com/blog/2021/10/16/laos
Latvia, Rozen-Bakher, Z., Blog on Foreign Direct Investment (FDI) and International Trade by Dr. Ziva Rozen-Bakher, Cycle I, 01 August 2024, https://www.rozen-bakher.com/blog/01082024/latvia
Lebanon, Rozen-Bakher, Z., Blog on Foreign Direct Investment (FDI) and International Trade by Dr. Ziva Rozen-Bakher, Cycle I, 17 July 2024, https://www.rozen-bakher.com/blog/17072024/lebanon
Lesotho, Rozen-Bakher, Z., Blog on Foreign Direct Investment (FDI) and International Trade by Dr. Ziva Rozen-Bakher, Cycle I, 06 June 2024, https://www.rozen-bakher.com/blog/06062024/lesotho
Liberia, Rozen-Bakher, Z., Blog on Foreign Direct Investment (FDI) and International Trade by Dr. Ziva Rozen-Bakher, Cycle I, 24 August 2021, https://www.rozen-bakher.com/blog/2021/08/24/liberia
Libya, Rozen-Bakher, Z., Blog on Foreign Direct Investment (FDI) and International Trade by Dr. Ziva Rozen-Bakher, Cycle I, 06 August 2023, https://www.rozen-bakher.com/blog/06082023/libya
Liechtenstein, Rozen-Bakher, Z., Blog on Foreign Direct Investment (FDI) and International Trade by Dr. Ziva Rozen-Bakher, Cycle I, 24 July 2024, https://www.rozen-bakher.com/blog/24072024/liechtenstein
Lithuania, Rozen-Bakher, Z., Blog on Foreign Direct Investment (FDI) and International Trade by Dr. Ziva Rozen-Bakher, Cycle I, 15 March 2022, https://www.rozen-bakher.com/blog/2022/03/15/lithuania
Luxembourg, Rozen-Bakher, Z., Blog on Foreign Direct Investment (FDI) and International Trade by Dr. Ziva Rozen-Bakher, Cycle I, 23 May 2021, https://www.rozen-bakher.com/blog/2021/05/23/luxembourg
M
Macao, SAR China, Rozen-Bakher, Z., Blog on Foreign Direct Investment (FDI) and International Trade by Dr. Ziva Rozen-Bakher, Cycle I, 24 July 2021, https://www.rozen-bakher.com/blog/2021/07/24/macao
Madagascar, Rozen-Bakher, Z., Blog on Foreign Direct Investment (FDI) and International Trade by Dr. Ziva Rozen-Bakher, Cycle I, 26 February 2023, https://www.rozen-bakher.com/blog/2023/02/26/madagascar
Madeira, Portugal, Rozen-Bakher, Z., Blog on Foreign Direct Investment (FDI) and International Trade by Dr. Ziva Rozen-Bakher, Cycle I, 17 July 2024, https://www.rozen-bakher.com/blog/17072024/madeira
Malawi, Rozen-Bakher, Z., Blog on Foreign Direct Investment (FDI) and International Trade by Dr. Ziva Rozen-Bakher, Cycle I, 23 June 2021, https://www.rozen-bakher.com/blog/2021/06/23/malawi
Malaysia, Rozen-Bakher, Z., Blog on Foreign Direct Investment (FDI) and International Trade by Dr. Ziva Rozen-Bakher, Cycle I, 20 June 2021, https://www.rozen-bakher.com/blog/2021/06/20/malaysia
Maldives, Rozen-Bakher, Z., Blog on Foreign Direct Investment (FDI) and International Trade by Dr. Ziva Rozen-Bakher, Cycle I, 17 June 2021, https://www.rozen-bakher.com/blog/2021/06/17/maldives
Mali, Rozen-Bakher, Z., Blog on Foreign Direct Investment (FDI) and International Trade by Dr. Ziva Rozen-Bakher, Cycle I, 16 June 2021, https://www.rozen-bakher.com/blog/2021/06/16/mali
Malta, Rozen-Bakher, Z., Blog on Foreign Direct Investment (FDI) and International Trade by Dr. Ziva Rozen-Bakher, Cycle I, 13 June 2021, https://www.rozen-bakher.com/blog/2021/06/13/malta
Marshall Islands, Rozen-Bakher, Z., Blog on Foreign Direct Investment (FDI) and International Trade by Dr. Ziva Rozen-Bakher, Cycle I, 19 February 2025, https://www.rozen-bakher.com/blog/19022025/marshall-islands
Martinique, France, Rozen-Bakher, Z., Blog on Foreign Direct Investment (FDI) and International Trade by Dr. Ziva Rozen-Bakher, Cycle I, 23 July 2024, https://www.rozen-bakher.com/blog/23072024/martinique
Mauritania, Rozen-Bakher, Z., Blog on Foreign Direct Investment (FDI) and International Trade by Dr. Ziva Rozen-Bakher, Cycle I, 14 May 2021, https://www.rozen-bakher.com/blog/2021/05/14/mauritania
Mauritius, Rozen-Bakher, Z., Blog on Foreign Direct Investment (FDI) and International Trade by Dr. Ziva Rozen-Bakher, Cycle I, 09 February 2022, https://www.rozen-bakher.com/blog/2022/02/09/mauritius
Mayotte, France, Rozen-Bakher, Z., Blog on Foreign Direct Investment (FDI) and International Trade by Dr. Ziva Rozen-Bakher, Cycle I, 25 July 2024, https://www.rozen-bakher.com/blog/25072024/mayotte
Melilla, Spain, Rozen-Bakher, Z., Blog on Foreign Direct Investment (FDI) and International Trade by Dr. Ziva Rozen-Bakher, Cycle I, 05 August 2024, https://www.rozen-bakher.com/blog/05082024/melilla
Mexico, Rozen-Bakher, Z., Blog on Foreign Direct Investment (FDI) and International Trade by Dr. Ziva Rozen-Bakher, Cycle I, 27 December 2021, https://www.rozen-bakher.com/blog/2021/12/27/mexico
Micronesia, Rozen-Bakher, Z., Blog on Foreign Direct Investment (FDI) and International Trade by Dr. Ziva Rozen-Bakher, Cycle I, 21 February 2025, https://www.rozen-bakher.com/blog/21022025/micronesia
Moldova, Rozen-Bakher, Z., Blog on Foreign Direct Investment (FDI) and International Trade by Dr. Ziva Rozen-Bakher, Cycle I, 02 November 2021, https://www.rozen-bakher.com/blog/2021/11/02/moldova
Monaco, Rozen-Bakher, Z., Blog on Foreign Direct Investment (FDI) and International Trade by Dr. Ziva Rozen-Bakher, Cycle I, 19 March 2025, https://www.rozen-bakher.com/blog/19032025/monaco
Mongolia, Rozen-Bakher, Z., Blog on Foreign Direct Investment (FDI) and International Trade by Dr. Ziva Rozen-Bakher, Cycle I, 06 August 2024, https://www.rozen-bakher.com/blog/06082024/mongolia
Montenegro, Rozen-Bakher, Z., Blog on Foreign Direct Investment (FDI) and International Trade by Dr. Ziva Rozen-Bakher, Cycle I, 21 July 2024, https://www.rozen-bakher.com/blog/21072024/montenegro
Montserrat, UK, Rozen-Bakher, Z., Blog on Foreign Direct Investment (FDI) and International Trade by Dr. Ziva Rozen-Bakher, Cycle I, 21 March 2025, https://www.rozen-bakher.com/blog/21032025/montserrat
Morocco, Rozen-Bakher, Z., Blog on Foreign Direct Investment (FDI) and International Trade by Dr. Ziva Rozen-Bakher, Cycle I, 29 August 2021, https://www.rozen-bakher.com/blog/2021/08/29/morocco
Mozambique, Rozen-Bakher, Z., Blog on Foreign Direct Investment (FDI) and International Trade by Dr. Ziva Rozen-Bakher, Cycle I, 16 August 2021, https://www.rozen-bakher.com/blog/2021/08/16/mozambique
Myanmar, Rozen-Bakher, Z., Blog on Foreign Direct Investment (FDI) and International Trade by Dr. Ziva Rozen-Bakher, Cycle I, 26 March 2022, https://www.rozen-bakher.com/blog/2022/03/26/myanmar
N
Namibia, Rozen-Bakher, Z., Blog on Foreign Direct Investment (FDI) and International Trade by Dr. Ziva Rozen-Bakher, Cycle I, 05 June 2021, https://www.rozen-bakher.com/blog/2021/06/05/namibia
Nauru, Rozen-Bakher, Z., Blog on Foreign Direct Investment (FDI) and International Trade by Dr. Ziva Rozen-Bakher, Cycle I, 12 April 2025, https://www.rozen-bakher.com/blog/12042025/nauru
Nepal, Rozen-Bakher, Z., Blog on Foreign Direct Investment (FDI) and International Trade by Dr. Ziva Rozen-Bakher, Cycle I, 22 May 2021, https://www.rozen-bakher.com/blog/2021/05/22/nepal
Netherlands, Rozen-Bakher, Z., Blog on Foreign Direct Investment (FDI) and International Trade by Dr. Ziva Rozen-Bakher, Cycle I, 27 April 2022, https://www.rozen-bakher.com/blog/2022/04/27/kingdom-of-the-netherlands
New Caledonia, France, Rozen-Bakher, Z., Blog on Foreign Direct Investment (FDI) and International Trade by Dr. Ziva Rozen-Bakher, Cycle I, 30 July 2024, https://www.rozen-bakher.com/blog/30072024/new-caledonia
New Zealand, Rozen-Bakher, Z., Blog on Foreign Direct Investment (FDI) and International Trade by Dr. Ziva Rozen-Bakher, Cycle I, 21 June 2021, https://www.rozen-bakher.com/blog/2021/06/21/new-zealand
Nicaragua, Rozen-Bakher, Z., Blog on Foreign Direct Investment (FDI) and International Trade by Dr. Ziva Rozen-Bakher, Cycle I, 18 June 2021, https://www.rozen-bakher.com/blog/2021/06/18/nicaragua
Niger, Rozen-Bakher, Z., Blog on Foreign Direct Investment (FDI) and International Trade by Dr. Ziva Rozen-Bakher, Cycle I, 29 September 2022, https://www.rozen-bakher.com/blog/2022/09/29/niger
Nigeria, Rozen-Bakher, Z., Blog on Foreign Direct Investment (FDI) and International Trade by Dr. Ziva Rozen-Bakher, Cycle I, 14 June 2021, https://www.rozen-bakher.com/blog/2021/06/14/nigeria
Niue, New Zealand, Rozen-Bakher, Z., Blog on Foreign Direct Investment (FDI) and International Trade by Dr. Ziva Rozen-Bakher, Cycle I, 31 March 2025, https://www.rozen-bakher.com/blog/31032025/niue
Norfolk Island, Australia, Rozen-Bakher, Z., Blog on Foreign Direct Investment (FDI) and International Trade by Dr. Ziva Rozen-Bakher, Cycle I, 28 March 2025, https://www.rozen-bakher.com/blog/28032025/norfolk-island
North Korea, Rozen-Bakher, Z., Blog on Foreign Direct Investment (FDI) and International Trade by Dr. Ziva Rozen-Bakher, Cycle I, 11 April 2022, https://www.rozen-bakher.com/blog/2022/04/11/north-korea
North Macedonia, Rozen-Bakher, Z., Blog on Foreign Direct Investment (FDI) and International Trade by Dr. Ziva Rozen-Bakher, Cycle I, 15 February 2022, https://www.rozen-bakher.com/blog/2022/02/15/north-macedonia
North Yemen (Sanaa), Rozen-Bakher, Z., Blog on Foreign Direct Investment (FDI) and International Trade by Dr. Ziva Rozen-Bakher, Cycle I, 08 April 2025, https://www.rozen-bakher.com/blog/08042025/north-yemen-sanaa
Northern Cyprus, Rozen-Bakher, Z., Blog on Foreign Direct Investment (FDI) and International Trade by Dr. Ziva Rozen-Bakher, Cycle I, 29 March 2025, https://www.rozen-bakher.com/blog/29032025/northern-cyprus
Northern Mariana Islands, USA, Rozen-Bakher, Z., Blog on Foreign Direct Investment (FDI) and International Trade by Dr. Ziva Rozen-Bakher, Cycle I, 01 October 2024, https://www.rozen-bakher.com/blog/01102024/northern-mariana-islands
Norway, Rozen-Bakher, Z., Blog on Foreign Direct Investment (FDI) and International Trade by Dr. Ziva Rozen-Bakher, Cycle I, 05 August 2024, https://www.rozen-bakher.com/blog/05082024/norway
O
Oman, Rozen-Bakher, Z., Blog on Foreign Direct Investment (FDI) and International Trade by Dr. Ziva Rozen-Bakher, Cycle I, 10 August 2024, https://www.rozen-bakher.com/blog/10082024/oman
P
Pakistan, Rozen-Bakher, Z., Blog on Foreign Direct Investment (FDI) and International Trade by Dr. Ziva Rozen-Bakher, Cycle I, 13 August 2024, https://www.rozen-bakher.com/blog/13082024/pakistan
Palau, Rozen-Bakher, Z., Blog on Foreign Direct Investment (FDI) and International Trade by Dr. Ziva Rozen-Bakher, Cycle I, 07 August 2024, https://www.rozen-bakher.com/blog/07082024/palau
Palestine, Rozen-Bakher, Z., Blog on Foreign Direct Investment (FDI) and International Trade by Dr. Ziva Rozen-Bakher, Cycle I, 30 August 2021, https://www.rozen-bakher.com/blog/2021/08/30/palestine
Panama, Rozen-Bakher, Z., Blog on Foreign Direct Investment (FDI) and International Trade by Dr. Ziva Rozen-Bakher, Cycle I, 22 July 2024, https://www.rozen-bakher.com/blog/22072024/panama
Papua New Guinea, Rozen-Bakher, Z., Blog on Foreign Direct Investment (FDI) and International Trade by Dr. Ziva Rozen-Bakher, Cycle I, 11 September 2021, https://www.rozen-bakher.com/blog/2021/09/11/papua-new-guinea
Paraguay, Rozen-Bakher, Z., Blog on Foreign Direct Investment (FDI) and International Trade by Dr. Ziva Rozen-Bakher, Cycle I, 12 January 2024, https://www.rozen-bakher.com/blog/12012024/paraguay
Peru, Rozen-Bakher, Z., Blog on Foreign Direct Investment (FDI) and International Trade by Dr. Ziva Rozen-Bakher, Cycle I, 07 May 2021, https://www.rozen-bakher.com/blog/2021/05/07/peru
Philippines, Rozen-Bakher, Z., Blog on Foreign Direct Investment (FDI) and International Trade by Dr. Ziva Rozen-Bakher, Cycle I, 29 March 2022, https://www.rozen-bakher.com/blog/2022/03/29/philippines
Pitcairn Islands, UK, Rozen-Bakher, Z., Blog on Foreign Direct Investment (FDI) and International Trade by Dr. Ziva Rozen-Bakher, Cycle I, 04 April 2025, https://www.rozen-bakher.com/blog/04042025/pitcairn-islands
Poland, Rozen-Bakher, Z., Blog on Foreign Direct Investment (FDI) and International Trade by Dr. Ziva Rozen-Bakher, Cycle I, 06 June 2021, https://www.rozen-bakher.com/blog/2021/06/06/poland
Portugal, Rozen-Bakher, Z., Blog on Foreign Direct Investment (FDI) and International Trade by Dr. Ziva Rozen-Bakher, Cycle I, 29 March 2021, https://www.rozen-bakher.com/blog/29032021/portugal
Puerto Rico, USA, Rozen-Bakher, Z., Blog on Foreign Direct Investment (FDI) and International Trade by Dr. Ziva Rozen-Bakher, Cycle I, 30 March 2021, https://www.rozen-bakher.com/blog/30032021/puerto-rico
Puntland, Rozen-Bakher, Z., Blog on Foreign Direct Investment (FDI) and International Trade by Dr. Ziva Rozen-Bakher, Cycle I, 28 September 2024, https://www.rozen-bakher.com/blog/28092024/puntland
Q
Qatar, Rozen-Bakher, Z., Blog on Foreign Direct Investment (FDI) and International Trade by Dr. Ziva Rozen-Bakher, Cycle I, 02 March 2023, https://www.rozen-bakher.com/blog/2023/03/02/qatar
R
Republika Srpska, Rozen-Bakher, Z., Blog on Foreign Direct Investment (FDI) and International Trade by Dr. Ziva Rozen-Bakher, Cycle I, 09 April 2025, https://www.rozen-bakher.com/blog/09042025/republika-srpska
Réunion, France, Rozen-Bakher, Z., Blog on Foreign Direct Investment (FDI) and International Trade by Dr. Ziva Rozen-Bakher, Cycle I, 20 July 2024, https://www.rozen-bakher.com/blog/20072024/reunion
Romania, Rozen-Bakher, Z., Blog on Foreign Direct Investment (FDI) and International Trade by Dr. Ziva Rozen-Bakher, Cycle I, 31 March 2021, https://www.rozen-bakher.com/blog/31032021/romania
Russia, Rozen-Bakher, Z., Blog on Foreign Direct Investment (FDI) and International Trade by Dr. Ziva Rozen-Bakher, Cycle I, 01 April 2021, https://www.rozen-bakher.com/blog/01042021/russia
Rwanda, Rozen-Bakher, Z., Blog on Foreign Direct Investment (FDI) and International Trade by Dr. Ziva Rozen-Bakher, Cycle I, 05 April 2021, https://www.rozen-bakher.com/blog/05042021/rwanda
S
Saba, Netherlands, Rozen-Bakher, Z., Blog on Foreign Direct Investment (FDI) and International Trade by Dr. Ziva Rozen-Bakher, Cycle I, 28 February 2025, https://www.rozen-bakher.com/blog/28022025/saba
Saint Barthélemy, France, Rozen-Bakher, Z., Blog on Foreign Direct Investment (FDI) and International Trade by Dr. Ziva Rozen-Bakher, Cycle I, 18 March 2025, https://www.rozen-bakher.com/blog/18032025/saint-barthelemy
Saint Helena, Ascension and Tristan da Cunha, UK, Rozen-Bakher, Z., Blog on Foreign Direct Investment (FDI) and International Trade by Dr. Ziva Rozen-Bakher, Cycle I, 19 March 2025, https://www.rozen-bakher.com/blog/19032025/saint-helena-ascension-and-tristan-da-cunha
Saint Kitts and Nevis, Rozen-Bakher, Z., Blog on Foreign Direct Investment (FDI) and International Trade by Dr. Ziva Rozen-Bakher, Cycle I, 23 March 2025, https://www.rozen-bakher.com/blog/23032025/saint-kitts-and-nevis
Saint Lucia, Rozen-Bakher, Z., Blog on Foreign Direct Investment (FDI) and International Trade by Dr. Ziva Rozen-Bakher, Cycle I, 26 March 2025, https://www.rozen-bakher.com/blog/26032025/saint-lucia
Saint Martin, France, Rozen-Bakher, Z., Blog on Foreign Direct Investment (FDI) and International Trade by Dr. Ziva Rozen-Bakher, Cycle I, 23 February 2025, https://www.rozen-bakher.com/blog/23022025/saint-martin
Saint Pierre and Miquelon, France, Rozen-Bakher, Z., Blog on Foreign Direct Investment (FDI) and International Trade by Dr. Ziva Rozen-Bakher, Cycle I, 20 March 2025, https://www.rozen-bakher.com/blog/20032025/saint-pierre-and-miquelon
Saint Vincent-Grenadines, Rozen-Bakher, Z., Blog on Foreign Direct Investment (FDI) and International Trade by Dr. Ziva Rozen-Bakher, Cycle I, 04 August 2024, https://www.rozen-bakher.com/blog/04082024/saintvincent-grenadines
Samoa, Rozen-Bakher, Z., Blog on Foreign Direct Investment (FDI) and International Trade by Dr. Ziva Rozen-Bakher, Cycle I, 08 April 2021, https://www.rozen-bakher.com/blog/08042021/samoa
San Marino, Rozen-Bakher, Z., Blog on Foreign Direct Investment (FDI) and International Trade by Dr. Ziva Rozen-Bakher, Cycle I, 16 April 2021, https://www.rozen-bakher.com/blog/16042021/san-marino
Sao Tome and Principe, Rozen-Bakher, Z., Blog on Foreign Direct Investment (FDI) and International Trade by Dr. Ziva Rozen-Bakher, Cycle I, 27 February 2025, https://www.rozen-bakher.com/blog/27022025/sao-tome-principe
Saudi Arabia, Rozen-Bakher, Z., Blog on Foreign Direct Investment (FDI) and International Trade by Dr. Ziva Rozen-Bakher, Cycle I, 12 June 2021, https://www.rozen-bakher.com/blog/2021/06/12/saudi-arabia
Senegal, Rozen-Bakher, Z., Blog on Foreign Direct Investment (FDI) and International Trade by Dr. Ziva Rozen-Bakher, Cycle I, 13 April 2022, https://www.rozen-bakher.com/blog/2022/04/13/senegal
Serbia, Rozen-Bakher, Z., Blog on Foreign Direct Investment (FDI) and International Trade by Dr. Ziva Rozen-Bakher, Cycle I, 17 April 2021, https://www.rozen-bakher.com/blog/17042021/serbia
Seychelles, Rozen-Bakher, Z., Blog on Foreign Direct Investment (FDI) and International Trade by Dr. Ziva Rozen-Bakher, Cycle I, 18 April 2021, https://www.rozen-bakher.com/blog/18042021/seychelles
Sierra Leone, Rozen-Bakher, Z., Blog on Foreign Direct Investment (FDI) and International Trade by Dr. Ziva Rozen-Bakher, Cycle I, 02 April 2025, https://www.rozen-bakher.com/blog/02042025/sierra-leone
Singapore, Rozen-Bakher, Z., Blog on Foreign Direct Investment (FDI) and International Trade by Dr. Ziva Rozen-Bakher, Cycle I, 03 August 2024, https://www.rozen-bakher.com/blog/03082024/singapore
Sint Eustatius, Netherlands, Rozen-Bakher, Z., Blog on Foreign Direct Investment (FDI) and International Trade by Dr. Ziva Rozen-Bakher, Cycle I, 24 March 2025, https://www.rozen-bakher.com/blog/24032025/sint-eustatius
Sint Maarten, Netherlands, Rozen-Bakher, Z., Blog on Foreign Direct Investment (FDI) and International Trade by Dr. Ziva Rozen-Bakher, Cycle I, 27 April 2022, https://www.rozen-bakher.com/blog/2022/04/27/sint-maarten
Slovakia, Rozen-Bakher, Z., Blog on Foreign Direct Investment (FDI) and International Trade by Dr. Ziva Rozen-Bakher, Cycle I, 19 April 2021, https://www.rozen-bakher.com/blog/19042021/slovakia
Slovenia, Rozen-Bakher, Z., Blog on Foreign Direct Investment (FDI) and International Trade by Dr. Ziva Rozen-Bakher, Cycle I, 05 April 2025, https://www.rozen-bakher.com/blog/05042025/slovenia
Solomon Islands, Rozen-Bakher, Z., Blog on Foreign Direct Investment (FDI) and International Trade by Dr. Ziva Rozen-Bakher, Cycle I, 12 August 2024, https://www.rozen-bakher.com/blog/12082024/solomon-islands
Somalia, Rozen-Bakher, Z., Blog on Foreign Direct Investment (FDI) and International Trade by Dr. Ziva Rozen-Bakher, Cycle I, 29 May 2021, https://www.rozen-bakher.com/blog/2021/05/29/somalia
Somaliland, Rozen-Bakher, Z., Blog on Foreign Direct Investment (FDI) and International Trade by Dr. Ziva Rozen-Bakher, Cycle I, 25 February 2025, https://www.rozen-bakher.com/blog/25022025/somaliland
South Africa, Rozen-Bakher, Z., Blog on Foreign Direct Investment (FDI) and International Trade by Dr. Ziva Rozen-Bakher, Cycle I, 20 March 2025, https://www.rozen-bakher.com/blog/20032025/south-africa
South Korea, Rozen-Bakher, Z., Blog on Foreign Direct Investment (FDI) and International Trade by Dr. Ziva Rozen-Bakher, Cycle I, 28 January 2022, https://www.rozen-bakher.com/blog/2022/01/28/south-korea
South Ossetia, Rozen-Bakher, Z., Blog on Foreign Direct Investment (FDI) and International Trade by Dr. Ziva Rozen-Bakher, Cycle I, 07 April 2025, https://www.rozen-bakher.com/blog/07042025/south-ossetia
South Sudan, Rozen-Bakher, Z., Blog on Foreign Direct Investment (FDI) and International Trade by Dr. Ziva Rozen-Bakher, Cycle I, 06 May 2021, https://www.rozen-bakher.com/blog/2021/05/06/south-sudan
South Yemen (Aden), Rozen-Bakher, Z., Blog on Foreign Direct Investment (FDI) and International Trade by Dr. Ziva Rozen-Bakher, Cycle I, 09 April 2025, https://www.rozen-bakher.com/blog/09042025/south-yemen-aden
Spain, Rozen-Bakher, Z., Blog on Foreign Direct Investment (FDI) and International Trade by Dr. Ziva Rozen-Bakher, Cycle I, 19 February 2025, https://www.rozen-bakher.com/blog/19022025/spain
Sri Lanka, Rozen-Bakher, Z., Blog on Foreign Direct Investment (FDI) and International Trade by Dr. Ziva Rozen-Bakher, Cycle I, 16 July 2024, https://www.rozen-bakher.com/blog/16072024/sri-lanka
Sudan, Rozen-Bakher, Z., Blog on Foreign Direct Investment (FDI) and International Trade by Dr. Ziva Rozen-Bakher, Cycle I, 19 August 2021, https://www.rozen-bakher.com/blog/2021/08/19/sudan
Suriname, Rozen-Bakher, Z., Blog on Foreign Direct Investment (FDI) and International Trade by Dr. Ziva Rozen-Bakher, Cycle I, 03 September 2021, https://www.rozen-bakher.com/blog/2021/09/3/suriname
Svalbard, Norway, Rozen-Bakher, Z., Blog on Foreign Direct Investment (FDI) and International Trade by Dr. Ziva Rozen-Bakher, Cycle I, 27 March 2025, https://www.rozen-bakher.com/blog/27032025/svalbard
Sweden, Rozen-Bakher, Z., Blog on Foreign Direct Investment (FDI) and International Trade by Dr. Ziva Rozen-Bakher, Cycle I, 12 December 2023, https://www.rozen-bakher.com/blog/13122023/sweden
Switzerland, Rozen-Bakher, Z., Blog on Foreign Direct Investment (FDI) and International Trade by Dr. Ziva Rozen-Bakher, Cycle I, 13 August 2021, https://www.rozen-bakher.com/blog/2021/08/13/switzerland
Syria, Rozen-Bakher, Z., Blog on Foreign Direct Investment (FDI) and International Trade by Dr. Ziva Rozen-Bakher, Cycle I, 31 March 2022, https://www.rozen-bakher.com/blog/2022/03/31/syria
T
Taiwan, Rozen-Bakher, Z., Blog on Foreign Direct Investment (FDI) and International Trade by Dr. Ziva Rozen-Bakher, Cycle I, 11 May 2021, https://www.rozen-bakher.com/blog/2021/05/11/taiwan
Tajikistan, Rozen-Bakher, Z., Blog on Foreign Direct Investment (FDI) and International Trade by Dr. Ziva Rozen-Bakher, Cycle I, 12 August 2021, https://www.rozen-bakher.com/blog/2021/08/12/tajikistan
Tanzania, Rozen-Bakher, Z., Blog on Foreign Direct Investment (FDI) and International Trade by Dr. Ziva Rozen-Bakher, Cycle I, 25 April 2021, https://www.rozen-bakher.com/blog/25042021/tanzania
Thailand, Rozen-Bakher, Z., Blog on Foreign Direct Investment (FDI) and International Trade by Dr. Ziva Rozen-Bakher, Cycle I, 13 March 2023, https://www.rozen-bakher.com/blog/2023/03/13/thailand
Timor-Leste, Rozen-Bakher, Z., Blog on Foreign Direct Investment (FDI) and International Trade by Dr. Ziva Rozen-Bakher, Cycle I, 07 June 2021, https://www.rozen-bakher.com/blog/2021/06/07/timor-leste
Togo, Rozen-Bakher, Z., Blog on Foreign Direct Investment (FDI) and International Trade by Dr. Ziva Rozen-Bakher, Cycle I, 08 May 2021, https://www.rozen-bakher.com/blog/2021/05/08/togo
Tokelau, New Zealand, Rozen-Bakher, Z., Blog on Foreign Direct Investment (FDI) and International Trade by Dr. Ziva Rozen-Bakher, Cycle I, 01 April 2025, https://www.rozen-bakher.com/blog/01042025/tokelau
Tonga, Rozen-Bakher, Z., Blog on Foreign Direct Investment (FDI) and International Trade by Dr. Ziva Rozen-Bakher, Cycle I, 01 April 2025, https://www.rozen-bakher.com/blog/01042025/tonga
Transnistria, Rozen-Bakher, Z., Blog on Foreign Direct Investment (FDI) and International Trade by Dr. Ziva Rozen-Bakher, Cycle I, 21 March 2025, https://www.rozen-bakher.com/blog/21032025/transnistria
Trinidad and Tobago, Rozen-Bakher, Z., Blog on Foreign Direct Investment (FDI) and International Trade by Dr. Ziva Rozen-Bakher, Cycle I, 26 July 2021, https://www.rozen-bakher.com/blog/2021/07/26/trinidad-and-tobago
Tunisia, Rozen-Bakher, Z., Blog on Foreign Direct Investment (FDI) and International Trade by Dr. Ziva Rozen-Bakher, Cycle I, 03 February 2023, https://www.rozen-bakher.com/blog/2023/02/03/tunisia
Turkey, Rozen-Bakher, Z., Blog on Foreign Direct Investment (FDI) and International Trade by Dr. Ziva Rozen-Bakher, Cycle I, 31 January 2023, https://www.rozen-bakher.com/blog/2023/01/31/turkey
Turkmenistan, Rozen-Bakher, Z., Blog on Foreign Direct Investment (FDI) and International Trade by Dr. Ziva Rozen-Bakher, Cycle I, 04 October 2022, https://www.rozen-bakher.com/blog/2022/10/04/turkmenistan
Turks and Caicos Islands, UK, Rozen-Bakher, Z., Blog on Foreign Direct Investment (FDI) and International Trade by Dr. Ziva Rozen-Bakher, Cycle I, 20 February 2025, https://www.rozen-bakher.com/blog/20022025/turks-and-caicos-islands
Tuvalu, Rozen-Bakher, Z., Blog on Foreign Direct Investment (FDI) and International Trade by Dr. Ziva Rozen-Bakher, Cycle I, 30 July 2024, https://www.rozen-bakher.com/blog/30072024/tuvalu
U
Uganda, Rozen-Bakher, Z., Blog on Foreign Direct Investment (FDI) and International Trade by Dr. Ziva Rozen-Bakher, Cycle I, 20 May 2021, https://www.rozen-bakher.com/blog/2021/05/20/uganda
Ukraine, Rozen-Bakher, Z., Blog on Foreign Direct Investment (FDI) and International Trade by Dr. Ziva Rozen-Bakher, Cycle I, 28 April 2021, https://www.rozen-bakher.com/blog/28042021/ukraine
United Arab Emirates, Rozen-Bakher, Z., Blog on Foreign Direct Investment (FDI) and International Trade by Dr. Ziva Rozen-Bakher, Cycle I, 02 May 2022, https://www.rozen-bakher.com/blog/2022/05/01/united-arab-emirates
United Kingdom, Rozen-Bakher, Z., Blog on Foreign Direct Investment (FDI) and International Trade by Dr. Ziva Rozen-Bakher, Cycle I, 15 May 2021, https://www.rozen-bakher.com/blog/2021/05/15/united-kingdom
United States, Rozen-Bakher, Z., Blog on Foreign Direct Investment (FDI) and International Trade by Dr. Ziva Rozen-Bakher, Cycle I, 21 April 2021, https://www.rozen-bakher.com/blog/21042021/united-states
Uruguay, Rozen-Bakher, Z., Blog on Foreign Direct Investment (FDI) and International Trade by Dr. Ziva Rozen-Bakher, Cycle I, 27 April 2021, https://www.rozen-bakher.com/blog/27042021/uruguay
Uzbekistan, Rozen-Bakher, Z., Blog on Foreign Direct Investment (FDI) and International Trade by Dr. Ziva Rozen-Bakher, Cycle I, 02 June 2021, https://www.rozen-bakher.com/blog/2021/06/02/uzbekistan
V
Vanuatu, Rozen-Bakher, Z., Blog on Foreign Direct Investment (FDI) and International Trade by Dr. Ziva Rozen-Bakher, Cycle I, 28 July 2024, https://www.rozen-bakher.com/blog/28072024/vanuatu
Venezuela, Rozen-Bakher, Z., Blog on Foreign Direct Investment (FDI) and International Trade by Dr. Ziva Rozen-Bakher, Cycle I, 01 November 2022, https://www.rozen-bakher.com/blog/2022/11/01/venezuela
Vietnam, Rozen-Bakher, Z., Blog on Foreign Direct Investment (FDI) and International Trade by Dr. Ziva Rozen-Bakher, Cycle I, 18 March 2025, https://www.rozen-bakher.com/blog/18032025/vietnam
Virgin Islands, USA, Rozen-Bakher, Z., Blog on Foreign Direct Investment (FDI) and International Trade by Dr. Ziva Rozen-Bakher, Cycle I, 02 August 2024, https://www.rozen-bakher.com/blog/02082024/virgin-islands
W
Wake Island, USA, Rozen-Bakher, Z., Blog on Foreign Direct Investment (FDI) and International Trade by Dr. Ziva Rozen-Bakher, Cycle I, 11 June 2025, https://www.rozen-bakher.com/blog/11062025/wake-island
Wallis and Futuna Islands, Rozen-Bakher, Z., Blog on Foreign Direct Investment (FDI) and International Trade by Dr. Ziva Rozen-Bakher, Cycle I, 05 March 2025, https://www.rozen-bakher.com/blog/05032025/wallis-and-futuna-islands
Western Sahara - Sahrawi Arab Democratic Republic, Rozen-Bakher, Z., Blog on Foreign Direct Investment (FDI) and International Trade by Dr. Ziva Rozen-Bakher, Cycle I, 08 April 2025, https://www.rozen-bakher.com/blog/20022025/western-sahara
Y
Yemen, Rozen-Bakher, Z., Blog on Foreign Direct Investment (FDI) and International Trade by Dr. Ziva Rozen-Bakher, Cycle I, 31 May 2021, https://www.rozen-bakher.com/blog/2021/05/31/yemen
Z
Zambia, Rozen-Bakher, Z., Blog on Foreign Direct Investment (FDI) and International Trade by Dr. Ziva Rozen-Bakher, Cycle I, 04 May 2022, https://www.rozen-bakher.com/blog/2022/05/04/zambia
Zimbabwe, Rozen-Bakher, Z., Blog on Foreign Direct Investment (FDI) and International Trade by Dr. Ziva Rozen-Bakher, Cycle I, 15 April 2022, https://www.rozen-bakher.com/blog/2022/04/15/zimbabwe
Section 9. Relevant Items From the Research Projects of Dr. Ziva Rozen-Bakher
Rozen-Bakher, Z. (2021). Are Multinational Enterprises’ (MNEs) Theories explained the reality of Foreign Direct Investment (FDI) and International Trade in the 21st Century?. Unpublished Research Paper, PD2. https://www.rozen-bakher.com/unpublished-research-papers/pd2
Rozen-Bakher, Z. (2021). A Regime Type as a Location Factor of FDI: Democracy, Communism, Absolute Monarchy, Religious Regime, and Military Regime. Unpublished Research Paper, PD5. https://www.rozen-bakher.com/unpublished-research-papers/pd5
Rozen-Bakher, Z. (2021). Technological Location Factors of Foreign Direct Investment (FDI): R&D Expenditure, Technological Strategic Assets, Technical Labour, and ICT Infrastructure. Unpublished Research Paper, PD6. https://www.rozen-bakher.com/unpublished-research-papers/pd6
Rozen-Bakher, Z. (2021). FDI’s Unresolved Risk of Cultural Distance - Alternatives Measuring to National Cultural Values: Language Distance, Religion Distance, and Cultural Openness. Unpublished Research Paper, PD7. https://www.rozen-bakher.com/unpublished-research-papers/pd7
Rozen-Bakher, Z. (2021). Legal Distance in FDI - The Differences in the Legal Location Factors between the Home country, Host country, and International Law: Risk Analysis. Unpublished Research Paper, PD8. https://www.rozen-bakher.com/unpublished-research-papers/pd8
Rozen-Bakher, Z. (2021). Restrictions on International Trade and Foreign Direct Investment (FDI): Nationalism-Mercantilism versus Trade Liberalism. Unpublished Research Paper, PD9. https://www.rozen-bakher.com/unpublished-research-papers/pd9
Rozen-Bakher, Z. (2021). The Chess Game of Forming International Trade Agreements: Shaping Global Economic and Political Power. Unpublished Research Paper, PD10. https://www.rozen-bakher.com/unpublished-research-papers/pd10
Rozen-Bakher, Z. (2021). Is the World Trade Organization (WTO) has a Future under the Mechanism of Consensus in Decision-Making?: A New Framework for Achieving Successful Rounds. Unpublished Research Paper, PD11. https://www.rozen-bakher.com/unpublished-research-papers/pd11
Rozen-Bakher, Z. (2021). Risk Analysis of Entry Modes: Comparison of Greenfield & Brownfield, Mergers & Acquisitions, Joint Ventures, Export, Licensing, and Franchising. Unpublished Research Paper, PD12. https://www.rozen-bakher.com/unpublished-research-papers/pd12
Rozen-Bakher, Z. (2020). The Raising of the Normal Retirement Age (NRA) in the Aging Era in the Advanced Countries: The Dilemma between Securing the Stability of the Pension System versus the Risk of Increasing Unemployment. Policy Studies, 41(6), 641-662.
Rozen-Bakher, Z. (2017). Impact of Inward and Outward FDI on Employment: The Role of Strategic Asset-Seeking FDI. Transnational Corporations Review, 9(1), 16-30.
Rozen-Bakher, Z. (2011). Multinational Enterprises (MNEs) in the Global Era: The Impact of Location Factors ─ Economic, Political, Technological, Cultural and Labour Market Policy ─ on Inward and Outward Foreign Direct Investment (FDI), and the implications of FDI inward and FDI outward on Labour Markets. PhD Dissertation in Hebrew. University of Haifa. Supervisors: Cohen, A. & Weber, Y. https://www.rozen-bakher.com/s/Dissertation-final-Ziva-Rozen-Bachar.pdf
Rozen-Bakher, Z. (2019). Trade Wars: Foreign Direct Investment (FDI) and International Trade. Unpublished Research Book, PDB1. https://www.rozen-bakher.com/s/Dr-Ziva-Rozen-Bakher_Book-Draft-Trade-Wars_18102025-wgfr.pdf
Rozen-Bakher, Z. (2018). Multinational Enterprises (MNE): International Trade and Foreign Direct Investment (FDI). Unpublished Research Book in Hebrew, PDB2. https://www.rozen-bakher.com/s/Dr-Ziva-Rozen-Bakher_Book-Draft-MNE_Hebrew18102025.pdf
Global Survival Rank (GSR) by Dr. Ziva Rozen-Bakher https://www.rozen-bakher.com/gsr
Rozen-Bakher, Z.2025 Global Survival Rank (GSR) by Dr. Ziva Rozen-Bakher, 2025 Global Survival Rank (GSR) by Dr. Ziva Rozen-Bakher, 12 October 2025, https://www.rozen-bakher.com/gsr/2025
Section E3. Determination of Geopolitical Position: Sanctions, Economic Order, Decolonialism, and Trade-war, 2025 Global Survival Rank (GSR) by Dr. Ziva Rozen-Bakherhttps://www.rozen-bakher.com/gsr/2025/e/determination-geopolitical-position
Section F1. Comparison of Multilateral Alliances, 2025 Global Survival Rank (GSR) by Dr. Ziva Rozen-Bakherhttps://www.rozen-bakher.com/gsr/2025/f/comparison-alliances
Section G6. Lack of Multilateral Alliances by the USA Compared to the Russia-China Coalition, Section G. Concluding Risk Remarks and Future Perspectives, 2025 Global Survival Rank (GSR) by Dr. Ziva Rozen-Bakherhttps://www.rozen-bakher.com/gsr/2025/g
Rozen-Bakher, Z. 2024 Global Survival Rank (GSR) by Dr. Ziva Rozen-Bakher, 2024 Global Survival Rank (GSR) by Dr. Ziva Rozen-Bakher, 30 April 2024, https://www.rozen-bakher.com/gsr/2024/e
Section E39. Comparison of Region, Religion, Sovereignty, Colonies, International Recognition, Alliances, Coalitions, Superpowers, & UNSC, 2024 Global Survival Rank (GSR) by Dr. Ziva Rozen-Bakher, https://www.rozen-bakher.com/gsr/2024/e/39
Rozen-Bakher, Z. 2023 Global Survival Rank (GSR) by Dr. Ziva Rozen-Bakher, 2023 Global Survival Rank (GSR) by Dr. Ziva Rozen-Bakher, 29 April 2023, https://www.rozen-bakher.com/global-survival-rank-zrb/2023
Rozen-Bakher, Z. Monitoring Alliances by Dr. Ziva Rozen-Bakher https://www.rozen-bakher.com/monitoring-alliances
Rozen-Bakher, Z, African Union, Monitoring Alliances by Dr. Ziva Rozen-Bakher, https://www.rozen-bakher.com/alliances/african-union
Rozen-Bakher, Z, Alliance of Sahel States (AES), Monitoring Alliances by Dr. Ziva Rozen-Bakher, https://www.rozen-bakher.com/alliances/aes
Rozen-Bakher, Z, Arab League and its Joint Defence Treaty, Monitoring Alliances by Dr. Ziva Rozen-Bakher, https://www.rozen-bakher.com/alliances/arableague
Rozen-Bakher, Z, ASEAN - Association of Southeast Asian Nations, Monitoring Alliances by Dr. Ziva Rozen-Bakher, https://www.rozen-bakher.com/alliances/asean
Rozen-Bakher, Z, BRICS, Monitoring Alliances by Dr. Ziva Rozen-Bakher, https://www.rozen-bakher.com/alliances/brics-plus
Rozen-Bakher, Z, CAFTA-DR - Dominican Republic - Central America - United States Free Trade Agreement, Monitoring Alliances by Dr. Ziva Rozen-Bakher, https://www.rozen-bakher.com/alliances/cafta
Rozen-Bakher, Z, CARICOM - Caribbean Community and Common Market, Monitoring Alliances by Dr. Ziva Rozen-Bakher, https://www.rozen-bakher.com/alliances/caricom
Rozen-Bakher, Z, CIS - Commonwealth of Independent States, Monitoring Alliances by Dr. Ziva Rozen-Bakher, https://www.rozen-bakher.com/alliances/cis
Rozen-Bakher, Z, CPTPP - Comprehensive and Progressive Agreement for Trans-Pacific Partnership, Monitoring Alliances by Dr. Ziva Rozen-Bakher, https://www.rozen-bakher.com/alliances/cptpp
Rozen-Bakher, Z, CSTO - Collective Security Treaty Organization, Monitoring Alliances by Dr. Ziva Rozen-Bakher, https://www.rozen-bakher.com/alliances/csto
Rozen-Bakher, Z, EAEU - Eurasian Economic Union, Monitoring Alliances by Dr. Ziva Rozen-Bakher, https://www.rozen-bakher.com/alliances/eaeu
Rozen-Bakher, Z, EFTA - European Free Trade Association, Monitoring Alliances by Dr. Ziva Rozen-Bakher, https://www.rozen-bakher.com/alliances/efta
Rozen-Bakher, Z, EU - European Union, Monitoring Alliances by Dr. Ziva Rozen-Bakher, https://www.rozen-bakher.com/alliances/eu
Rozen-Bakher, Z, Gulf Cooperation Council (GCC) and its Peninsula Shield Force (PSF), Monitoring Alliances by Dr. Ziva Rozen-Bakher, https://www.rozen-bakher.com/alliances/peninsula-shield-force-gcc
Rozen-Bakher, Z, MERCOSUR Southern Common Market, Monitoring Alliances by Dr. Ziva Rozen-Bakher, https://www.rozen-bakher.com/alliances/mercosur
Rozen-Bakher, Z, NATO - North Atlantic Treaty Organization, Monitoring Alliances by Dr. Ziva Rozen-Bakher, https://www.rozen-bakher.com/alliances/nato
Rozen-Bakher, Z, NDB - New Development Bank Led by BRICS, Monitoring Alliances by Dr. Ziva Rozen-Bakher, https://www.rozen-bakher.com/alliances/ndb
Rozen-Bakher, Z, OIC - Organisation of Islamic Cooperation, Monitoring Alliances by Dr. Ziva Rozen-Bakher, https://www.rozen-bakher.com/alliances/oic
Rozen-Bakher, Z, OPEC - Organization of the Petroleum Exporting Countries, Monitoring Alliances by Dr. Ziva Rozen-Bakher, https://www.rozen-bakher.com/alliances/opec
Rozen-Bakher, Z, PAFTA Pan-Arab Free Trade Area, Monitoring Alliances by Dr. Ziva Rozen-Bakher, https://www.rozen-bakher.com/alliances/pafta
Rozen-Bakher, Z, PICTA - Pacific Island Countries Trade Agreement, Monitoring Alliances by Dr. Ziva Rozen-Bakher, https://www.rozen-bakher.com/alliances/picta
Rozen-Bakher, Z, Qualifying Industrial Zones (QIZs): QIZ of Egypt, QIZ of Jordan and QIZ of Palestine via the FTA of USA and Israel, Monitoring Alliances by Dr. Ziva Rozen-Bakher, https://www.rozen-bakher.com/alliances/qiz
Rozen-Bakher, Z, SAFTA - South Asian Free Trade Agreement, Monitoring Alliances by Dr. Ziva Rozen-Bakher, https://www.rozen-bakher.com/alliances/safta
Rozen-Bakher, Z, SCO - Shanghai Cooperation Organisation, Monitoring Alliances by Dr. Ziva Rozen-Bakher, https://www.rozen-bakher.com/alliances/sco
Rozen-Bakher, Z, USMCA, Monitoring Alliances by Dr. Ziva Rozen-Bakher, https://www.rozen-bakher.com/alliances/usmca
Rozen-Bakher, Z, WTO - World Trade Organization, Monitoring Alliances by Dr. Ziva Rozen-Bakher, https://www.rozen-bakher.com/alliances/wto
Rozen-Bakher, Z. Monitoring Risks by Dr. Ziva Rozen-Bakher https://www.rozen-bakher.com/monitoring-risks-1
Rozen-Bakher, Z., Impact of Foreign Direct Investment (FDI) on Labour Markets: Nationalism-Mercantilism versus Trade Liberalism, Monitoring Risks by Dr. Ziva Rozen-Bakher, 05 July 2023, https://www.rozen-bakher.com/monitoring-risks/05/07/2023
Rozen-Bakher, Z., USA Coalition versus Russia-China Coalition, Monitoring Risks by Dr. Ziva Rozen-Bakher, 12 February 2023, https://www.rozen-bakher.com/monitoring-risks/12/02/2023
Rozen-Bakher, Z., Gas & Oil War-Sanctions: USA Coalition vs. Russian Coalition, Monitoring Risks by Dr. Ziva Rozen-Bakher, 07 April 2022, https://www.rozen-bakher.com/monitoring-risks/07/04/2022
Rozen-Bakher, Z., USA Coalition vs. Russian Coalition: FDI and International Trade Analysis, Monitoring Risks by Dr. Ziva Rozen-Bakher, 30 March 2022, https://www.rozen-bakher.com/monitoring-risks/30/03/2022
Rozen-Bakher, Z., Sanctions against Russia: USA Coalition vs. Russian Coalition, Monitoring Risks by Dr. Ziva Rozen-Bakher, 14 March 2022, https://www.rozen-bakher.com/monitoring-risks/14/03/2022
Rozen-Bakher, Z., Sanctions against Russia: Global Sanctions-War, Monitoring Risks by Dr. Ziva Rozen-Bakher, 23 February 2022, https://www.rozen-bakher.com/monitoring-risks/23/02/2022
Rozen-Bakher, Z., Russia’s Counter-Sanctions: ‘Gazprom-Weapon’, Monitoring Risks by Dr. Ziva Rozen-Bakher, 7 February 2022, https://www.rozen-bakher.com/monitoring-risks/07/02/2022
Rozen-Bakher, Z., Sanctions against Iran and Shanghai Cooperation Organisation (SCO), Monitoring Risks by Dr. Ziva Rozen-Bakher, 3 February 2022, https://www.rozen-bakher.com/monitoring-risks/03/02/2022
Rozen-Bakher, Z. Global Risks by Dr. Ziva Rozen-Bakherhttps://www.rozen-bakher.com/global-risks
Rozen-Bakher, Z., Sanctions, Global Risks by Dr. Ziva Rozen-Bakher, 27 July 2021, https://www.rozen-bakher.com/forum/2021/07/27/sanctions
Rozen-Bakher, Z., Global Corporate Tax, Global Risks by Dr. Ziva Rozen-Bakher, 08 July 2021, https://www.rozen-bakher.com/forum/2021/07/08/global-tax
Rozen-Bakher, Z., Capitalism vs. Socialism vs. Communism, Global Risks by Dr. Ziva Rozen-Bakher, 06 July 2021, https://www.rozen-bakher.com/forum/2021/07/06/economic-system
Rozen-Bakher, Z. Risks Timeline by Dr. Ziva Rozen-Bakher https://www.rozen-bakher.com/timeline-risks-all
Rozen-Bakher, Z., Did Trump kidnap President of Venezuela Nicolás Maduro and his Wife due to Drug Trafficking or for Venezuelan Oil?, Risks Timeline by Dr. Ziva Rozen-Bakher, 07 January 2026, https://www.rozen-bakher.com/timeline-risks/07/01/2026/0542
Rozen-Bakher, Z., Are Trump’s ‘Reciprocal Tariff’ Illegal?: The Violation of the USA’s Free Trade Agreements (FTAs), Risks Timeline by Dr. Ziva Rozen-Bakher, 29 May 2025, https://www.rozen-bakher.com/timeline-risks/29/05/2025/1824
Rozen-Bakher, Z., Is NATO Forever? Trump’s Demand of 5% Defense Spending of GDP, Risks Timeline by Dr. Ziva Rozen-Bakher, 14 April 2025, https://www.rozen-bakher.com/timeline-risks/14/04/2025/1500
Rozen-Bakher, Z., The Backfire on USA Coalition amid the Sanctions against Russia: Slowdown and Recession, Risks Timeline by Dr. Ziva Rozen-Bakher, 05 May 2024, https://www.rozen-bakher.com/timeline-risks/05/05/2024/0141
Rozen-Bakher, Z., OPEC+: Brazil Formally Moved From the ‘West Family’ to the ‘East Family’, Risks Timeline by Dr. Ziva Rozen-Bakher, 31 December 2023, https://www.rozen-bakher.com/timeline-risks/31/12/2023/0855
Rozen-Bakher, Z., BRICS PLUS: Alarm Call to USA, Risks Timeline by Dr. Ziva Rozen-Bakher, 16 December 2023, https://www.rozen-bakher.com/timeline-risks/16/12/2023/1913
Rozen-Bakher, Z., The Failure of War Sanctions against Russia: BRICS, NDB & SEPAM, Risks Timeline by Dr. Ziva Rozen-Bakher, 11 June 2023, https://www.rozen-bakher.com/timeline-risks/11/06/2023/2156
Rozen-Bakher, Z., Egypt: The Dramatic Shift from USA Ally to Russia-China Ally, Risks Timeline by Dr. Ziva Rozen-Bakher, 30 May 2023, https://www.rozen-bakher.com/timeline-risks/30/05/2023/1031
Rozen-Bakher, Z., BRICS Plus - New Global Order, Risks Timeline by Dr. Ziva Rozen-Bakher, 03 May 2023, https://www.rozen-bakher.com/timeline-risks/03/05/2023/0917
Rozen-Bakher, Z., USA about US Dollar: Sleep Walking, Risks Timeline by Dr. Ziva Rozen-Bakher, 07 April 2023, https://www.rozen-bakher.com/timeline-risks/07/04/2023/2330
Rozen-Bakher, Z., China vs. USA: Latin America, Risks Timeline by Dr. Ziva Rozen-Bakher, 26 March 2023, https://www.rozen-bakher.com/timeline-risks/26/03/2023/1152
Rozen-Bakher, Z., West Banking Crisis: Amid Sanctions against Russia?, Risks Timeline by Dr. Ziva Rozen-Bakher, 25 March 2023, https://www.rozen-bakher.com/timeline-risks/25/03/2023/1037
Rozen-Bakher, Z., China's Shift to Russia: Trade and FDI, Risks Timeline by Dr. Ziva Rozen-Bakher, 22 March 2023, https://www.rozen-bakher.com/timeline-risks/22/03/2023/0856
Rozen-Bakher, Z., ‘Merger of Allies’ of Russia-China Coalition, Risks Timeline by Dr. Ziva Rozen-Bakher, 13 March 2023, https://www.rozen-bakher.com/timeline-risks/13/03/2023/1534
Rozen-Bakher, Z., Sanctions Against Russia: Religion Analysis, Risks Timeline by Dr. Ziva Rozen-Bakher, 03 January 2023, https://www.rozen-bakher.com/timeline-risks/03/01/2023/2200
Rozen-Bakher, Z., USA Coalition Lost Brazil, Risks Timeline by Dr. Ziva Rozen-Bakher, 02 January 2023, https://www.rozen-bakher.com/timeline-risks/02/01/2023/0457
Rozen-Bakher, Z., EU: The Big Loser From Ukraine War in the Long-Run, Risks Timeline by Dr. Ziva Rozen-Bakher, 29 November 2022, https://www.rozen-bakher.com/timeline-risks/29/11/2022/1008
Rozen-Bakher, Z., Africa in the Hand of Russia-China Coalition: The Colonialism Backfire on the USA Coalition, Risks Timeline by Dr. Ziva Rozen-Bakher, 20 November 2022, https://www.rozen-bakher.com/timeline-risks/20/11/2022/1522
Rozen-Bakher, Z., Are Sanctions Effective under the Global Mechanism of Middle Trade Brokers?, Risks Timeline by Dr. Ziva Rozen-Bakher, 30 September 2022, https://www.rozen-bakher.com/timeline-risks/30/09/2022/0247
Rozen-Bakher, Z., The Illusion of the West that India is Part of the ‘West Family’, Risks Timeline by Dr. Ziva Rozen-Bakher, 25 September 2022, https://www.rozen-bakher.com/timeline-risks/25/09/2022/0747
Rozen-Bakher, Z., Alternatives to SWIFT as a Counter-Sanctions: Russia’s MIR, Risks Timeline by Dr. Ziva Rozen-Bakher, 23 September 2022, https://www.rozen-bakher.com/timeline-risks2/23/09/2022/1159
Rozen-Bakher, Z., Serbia: ‘Sitting on the Fence’ or Russia Ally in the Middle of the ‘NATO Sea’?, Risks Timeline by Dr. Ziva Rozen-Bakher, 22 September 2022, https://www.rozen-bakher.com/timeline-risks/22/09/2022/1017
Rozen-Bakher, Z., The High Risk for Lasting EU If Germany and France, the Two Foundations of the EU, are weakened by the Sanctions Against Russia, Risks Timeline by Dr. Ziva Rozen-Bakher, 12 September 2022, https://www.rozen-bakher.com/timeline-risks2/12/09/2022/1059
Rozen-Bakher, Z., The Global Despotism of the Superpower USA via Sanctions: The Case of Taliban, Risks Timeline by Dr. Ziva Rozen-Bakher, 09 September 2022, https://www.rozen-bakher.com/timeline-risks/09/09/2022/0947
Rozen-Bakher, Z., The Increase in Living Costs in the EU due to the Sanctions against Russia: Backfire on the EU via Social Unrest and Fall of Governments, Risks Timeline by Dr. Ziva Rozen-Bakher, 08 September 2022, https://www.rozen-bakher.com/timeline-risks2/08/09/2022/1725
Rozen-Bakher, Z., Empires Rise and Fall: The Case of USA, Risks Timeline by Dr. Ziva Rozen-Bakher, 07 September 2022, https://www.rozen-bakher.com/timeline-risks2/07/09/2022/1442
Rozen-Bakher, Z., Swiss Sanctions against Russia: The Risk for Swiss Banks Due to Swiss Discontinuing with its Neutrality Policy, Risks Timeline by Dr. Ziva Rozen-Bakher, 27 August 2022, https://www.rozen-bakher.com/timeline-risks/27/08/2022/1922
Rozen-Bakher, Z., The Risk for Oil Tankers War - 'Lose-Lose Scenario': Do We Need Pirate-Military Units?, Risks Timeline by Dr. Ziva Rozen-Bakher, 26 May 2022, https://www.rozen-bakher.com/timeline-risks/26/05/2022/2138
Rozen-Bakher, Z., The Huge Mistake of Germany to Withdraw From Nord Stream: The Cheap Gas via Nord Stream versus the Risky-Expensive Option of LNG Carriers via Suez Canal, Risks Timeline by Dr. Ziva Rozen-Bakher, 20 May 2022, https://www.rozen-bakher.com/timeline-risks/20/05/2022/1748
Rozen-Bakher, Z., Biden Illusion: Destroying the Central Role of Russia in Oil and Gas = Ban on the Sunlight From Shining in Russia, Risks Timeline by Dr. Ziva Rozen-Bakher, 19 may 2022, https://www.rozen-bakher.com/timeline-risks2/19/05/2022/1455
Rozen-Bakher, Z., USA Restrictions on China: We Can Come to Your Market but You Can Not Come to Us, Risks Timeline by Dr. Ziva Rozen-Bakher, 19 May 2022, https://www.rozen-bakher.com/timeline-risks/19/05/2022/0735
Rozen-Bakher, Z., Will Brexit Lead to the Unification of Northern Ireland and Ireland?, Risks Timeline by Dr. Ziva Rozen-Bakher, 08 May 2022, https://www.rozen-bakher.com/timeline-risks/08/05/2022/0848
Rozen-Bakher, Z., The Missing Link between the Labour Market and Prosperity in USA: Lack of Permanent Jobs, Risks Timeline by Dr. Ziva Rozen-Bakher, 06 May 2022, https://www.rozen-bakher.com/timeline-risks/06/05/2022/1453
Rozen-Bakher, Z., Russian Counter-Sanctions: The Replacement of West Exporters with East Exporters, Risks Timeline by Dr. Ziva Rozen-Bakher, 16 April 2022, https://www.rozen-bakher.com/timeline-risks/16/04/2022/0833
Rozen-Bakher, Z., The Risk of Antagonism Against USA: USA Attitude towards Russian Occupation of Ukraine versus Israeli Occupation of Palestine, Risks Timeline by Dr. Ziva Rozen-Bakher, 14 April 2022, https://www.rozen-bakher.com/timeline-risks/14/04/2022/0731
Rozen-Bakher, Z., West Sanctions Against North Korea: Is it Worked?, Risks Timeline by Dr. Ziva Rozen-Bakher, 12 April 2022, https://www.rozen-bakher.com/timeline-risks/12/04/2022/0719
Rozen-Bakher, Z., Is Iran Succeeded to Bypass the West Sanctions?, Risks Timeline by Dr. Ziva Rozen-Bakher, 10 April 2022, https://www.rozen-bakher.com/timeline-risks/10/04/2022/0716
Rozen-Bakher, Z., What Can the New German Chancellor, Olaf Scholz, Learn From Angela Merkel?: Sitting on the Fence Between East and West, Risks Timeline by Dr. Ziva Rozen-Bakher, 04 April 2022, https://www.rozen-bakher.com/timeline-risks2/04/04/2022/1616
Rozen-Bakher, Z., Australia Bans Alumina Exports to Russia: An Effective Sanctions?, Risks Timeline by Dr. Ziva Rozen-Bakher, 20 March 2022, https://www.rozen-bakher.com/timeline-risks/20/03/2022/0536
Rozen-Bakher, Z., The Illusion of USA that China will not Help Russia to Bypass the Sanctions, Risks Timeline by Dr. Ziva Rozen-Bakher, 27 February 2022, https://www.rozen-bakher.com/timeline-risks/27/02/2022/1028
Section 10. Recommended Reading from the Scientific Literature
Long live globalization: geopolitical shocks and international trade Cevik, S. (2025). Long live globalization: geopolitical shocks and international trade. International Economics and Economic Policy, 22(2), 32.
Government export promotion: A global perspective Seringhaus, F. R., & Rosson, P. J. (2026). Government export promotion: A global perspective. Taylor & Francis.
Trade wars: Past and present Oermann, N. O., & Wolff, H. J. (2022). Trade wars: Past and present. Oxford University Press.
Introduction: trade wars past and present: causes, dynamics and consequences Zeng, K., & Liang, W. (2022). Introduction: trade wars past and present: causes, dynamics and consequences. In Research handbook on trade wars (pp. 1-25). Edward Elgar Publishing.
Trading for security: Military alliances and economic agreements Long, A. G., & Leeds, B. A. (2006). Trading for security: Military alliances and economic agreements. Journal of Peace Research, 43(4), 433-451.
Military alliance and international trade: Evidence from NATO enlargement Li, B., Ge, Y., & Lin, Y. M. (2024). Military alliance and international trade: Evidence from NATO enlargement. The World Economy, 47(3), 930-956.
Defense pacts and international trade Long, A. G. (2003). Defense pacts and international trade. Journal of Peace Research, 40(5), 537-552.
Trade and growth in developing countries: the role of export composition, import composition and export diversification Carrasco, C. A., & Tovar-García, E. D. (2021). Trade and growth in developing countries: the role of export composition, import composition and export diversification. Economic Change and Restructuring, 54(4), 919-941.
From economic competition to military combat: Export similarity and international conflict Chatagnier, J. T., & Kavaklı, K. C. (2017). From economic competition to military combat: Export similarity and international conflict. Journal of Conflict Resolution, 61(7), 1510-1536.
Rising import tariffs, falling exports: When modern supply chains meet old-style protectionism Handley, K., Kamal, F., & Monarch, R. (2025). Rising import tariffs, falling exports: When modern supply chains meet old-style protectionism. American Economic Journal: Applied Economics, 17(1), 208-238.
Effects of innovation strategies on export performance: New empirical evidence from developing market firms Edeh, J. N., Obodoechi, D. N., & Ramos-Hidalgo, E. (2020). Effects of innovation strategies on export performance: New empirical evidence from developing market firms. Technological Forecasting and Social Change, 158, 120167.
De-globalization, international trade protectionism, and the reconfigurations of global value chains Zahoor, N., Wu, J., Khan, H., & Khan, Z. (2023). De-globalization, international trade protectionism, and the reconfigurations of global value chains. Management International Review, 63(5), 823-859.
International trade: New patterns of trade, production and investment Grimwade, N. (2020). International trade: New patterns of trade, production and investment. Taylor & Francis.
Volatility in the small and in the large: The lack of diversification in international trade Kramarz, F., Martin, J., & Mejean, I. (2020). Volatility in the small and in the large: The lack of diversification in international trade. Journal of international economics, 122, 103276.
The effect of technological intensity on international trade Xiong, T. (2023). The effect of technological intensity on international trade. International Economics, 176, 100456.
The impact of foundational AI on international trade, services and supply chains in Asia Meltzer, J. P. (2024). The impact of foundational AI on international trade, services and supply chains in Asia. Asian Economic Policy Review, 19(1), 129-147.
Investigating the effects of renewable energy on international trade and environmental quality Khan, S. A. R., Yu, Z., Belhadi, A., & Mardani, A. (2020). Investigating the effects of renewable energy on international trade and environmental quality. Journal of Environmental management, 272, 111089.
Digital transformation in international trade: Opportunities, challenges, and policy implications Mirzaye, S., & Mohiuddin, M. (2025). Digital transformation in international trade: Opportunities, challenges, and policy implications. Journal of Risk and Financial Management, 18(8), 421.
International trade: what everyone needs to know Krueger, A. O. (2020). International trade: what everyone needs to know. Oxford University Press.
International trade and income differences Waugh, M. E. (2010). International trade and income differences. American Economic Review, 100(5), 2093-2124.
Advanced international trade: theory and evidence Feenstra, R. C. (2015). Advanced international trade: theory and evidence. Princeton university press.
The effect of the Internet on international trade Freund, C. L., & Weinhold, D. (2004). The effect of the Internet on international trade. Journal of international economics, 62(1), 171-189.
The political economy of international trade Milner, H. V. (1999). The political economy of international trade. Annual review of political science, 2(1), 91-114.
Industrial organization and international trade Krugman, P. R. (1989). Industrial organization and international trade. Handbook of industrial organization, 2, 1179-1223.
International trade theory: the evidence Leamer, E. E., & Levinsohn, J. (1995). International trade theory: the evidence. Handbook of international economics, 3, 1339-1394.